EUR JPY Short OpportunityEUR JPY Short Opportunity based on supply zone break failure and its targeting the bottom demand zone.
Eurjpysell

EURJPY short speculationShorting EURJPY
Based on signal generated by our indicator.
Best to short once we close daily below our blue zone.

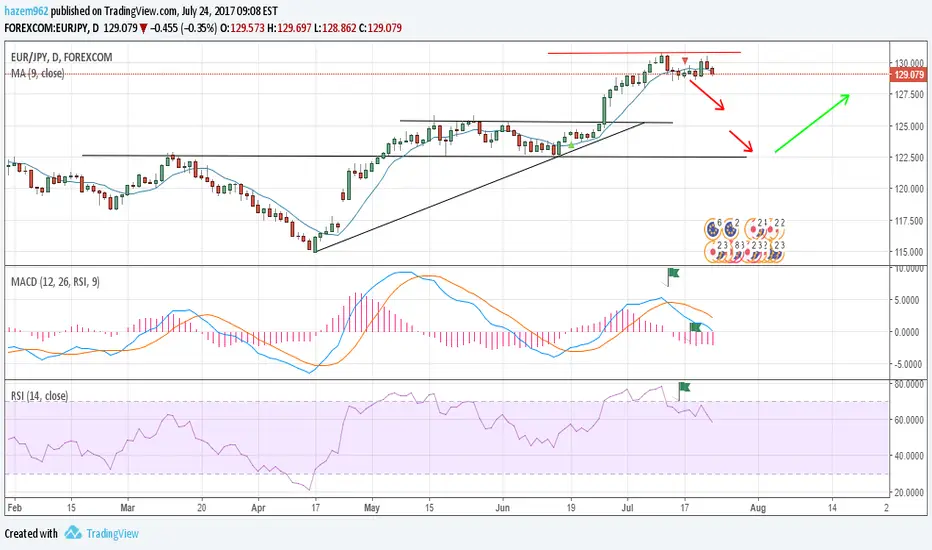
EURJPY A new Long idea hey guys a new chance to get best trade
EURJPY now to get Wave 3
all details in chart there everything
look at chart


EURJPY SELL possibilityhello dear traders as we know its to electric about the jpy crosses so we have to be so attentive when we enter .
the USDJPY is ready to sell enter with a small lot size from the green area take a place where youre confortable .
good luck .

Eurjpy Bat pattern and possible reversal at trend line.Revised, this could be a Bat pattern and possible reversal at trend line. It has been very strong today, so caution is warranted. Possible intraday gartley reversal hourly chart for EURJPY which could point back to the 132.500 level.

Shoring EURJPY - Excellent risk/rewardI haven't posted in a while on TV and I will keep it that way as I am to busy with coaching and analysis on my personal blog, however I will try to post a trade idea a week here too.
Today I am shorting EURJPY, even tough the EUR is pretty strong in todays EURO/UK trading session and even in the US session, I expect/believe (based on my analysis) that EURJPY is at a key resistance level, ofcourse I am no guru and my analysis is many times wrong, not becasue its not solid, my method is excellent, but nothing can be 100%.
Right now I have two technical reasons to short the pair,
1. Price action is testing the recently broken, short-term, trend line
2. Price action is at the 30% level from the recent high to the recent low
Looking at the EUR I see plenty of reasons for uncertinaty as I believe the Catalonian's will not let go lightly and I expect riots to slowly begin in the Barcelona region and around, the people of Catelonia want an independace from Spain and the Spanish goverment used plenty of force which in return injured many people, these people have all circles of family and friends around them which are rigth now "pissed off" with the police and the Spanish goverment, since their family, friends, loved ones got hurt for trying to vote. This "cause" can turn into an "effect" and that effect is possibly, riots.
We have on going terror attacks in Europe which have recently not affected the markets (going back to 2016 the terrorist attacks caused issues to the EUR) so I am not expecting terror attacks to hurt the EUR unless its something BIG.
In terms of the JPY, again fundamentally, the tensions in the Korean peninsulla are giving a boost to the YEN and I fully expect the tensions to continue so I expect a rapid rise in the YEN coming soon.
So there you have it, a little bit of fundamentals and a little bit of technicals. My SL is tight and my TP is targeting only the 1st of 4 take profit levels. The take profit levels are listed below.
TP1: 131.300
TP2: 130.515
TP3: 129.770
TP4: 129.025
PS: Apoliges for any spelling mistakes, im rather busy to go over what I wrote a second time.
Size those pips!

Eurjpy Bearish flag pattern Eurjpy Make Down flag pattern ,,
if it break that downtrend flag pattern it going down
tp1 1.3200 and tp2 1.3100 sl above 133.50
Trade with care and happy trading
Asad ullah

Sell EURJPY Short Term Based On Multiple Time FramesThis research is for informational purposes and should not be construed as personal advice. Trading any financial market involves risk. Trading on leverage involves risk of losses greater than deposits.
Please comment below and Like if you agree with my analysis.


EURJPY - Short on Dovish DraghiWe have a lot of EUR news due out tomorrow together with a speech from Mario Draghi, the President of the European Central Bank.
His comments alone will move the market and we are hoping for an alignment with the PMI data due out later on in the morning. This will give us a great trading opportunity on the EUR throughout the rest of the week.
We are planning a short trade on the EURJPY should we see and hear dovish sentiment from Draghi. The Yen has been the stronger of the two currencies over the past week, and over the past month, and is currently sitting at resistance.

EUR/JPY (SP) (SHORT)There is possibility to go SHORT from the price of 129.30 to the level of 128.00,125.30
TP should be considered 23.6%,38.2%, because of RISING WEDGE ....
Note: Everything works with Best money management.
Note: Please leave comments for any query.
Disclaimer: Trade at your own risk.
Good Luck...!!
Regards,

Short EURJPY Break Out Long Term Based On Weekly + Monthly TFThis research is for informational purposes and should not be construed as personal advice. Trading any financial market involves risk. Trading on leverage involves risk of losses greater than deposits.
Please comment below and Like if you agree with my analysis.

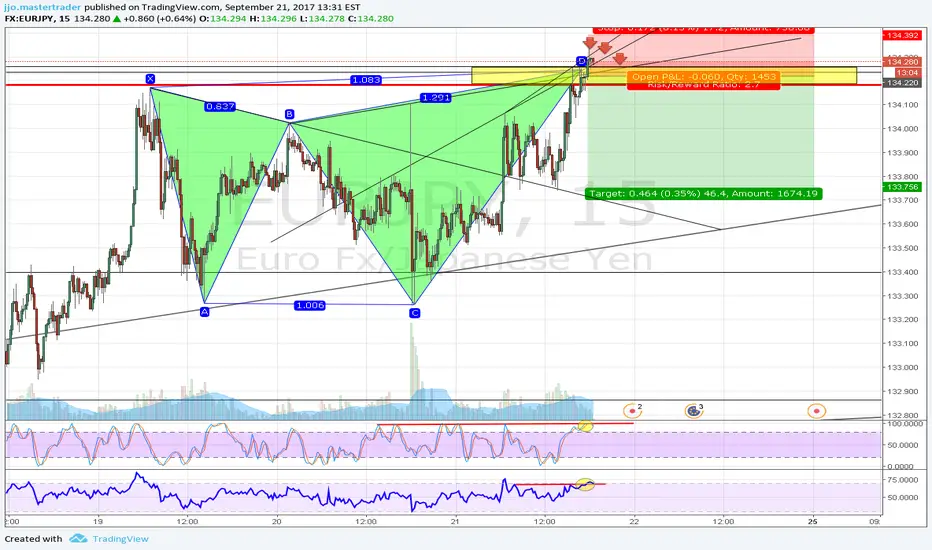
Short EURJPY Longterm Bearish Gartley Formation 700+ PipsThis research is for informational purposes and should not be construed as personal advice. Trading any financial market involves risk. Trading on leverage involves risk of losses greater than deposits.
Please comment below and Like if you agree with my analysis.

EURJPY Sell OffAfter weeks of climbing it looks like EURJPY has reached the stop. If failed to break the resistance and after lots of sideways trading it failed to break it again. We can now expect a retest of 126.60. So EURJPY will follow the other JPY pairs.
Use the various mentioned support level as possible take profits. Try to add a long the way down more sell positions (pyramid stacking) and lower your stop loss accordingly.
SL: 131


EURJPYOur preference: sales position below 129.80 with targets at 128.55 & 127.95 in extension.
Alternative scenario: in excess of 129.80, aim for a continuation of the rise with 130.00 & 130.50 in line of sight.
Comment: The RSI is misdirected.


EURJPY Sell trading ideaEURJPY Chart Confluence factors :
1: pattern : Symmetrical Triangle Patterns(Continues Pattern)
2: Bearish bias
3 : wait for proper breakout
4: timeframe 240min
5:Possibility 60 to 85 %
6: Sell signal : Entry : 123.75-50 TP : 122.55 , 121.55 , 120.55 Stop Loss : 124.65

EURJPY profit target reached perfectly, time to sell for a shortSell below 125.13. Stop loss at 125.36. Take profit at 124.63.
Reason for the trading strategy (technically):
Price has shot all the way up and reached our profit target perfectly. We prepare to sell below 125.13 resistance (Fibonacci extension, Elliott wave theory) for a short term setback to at least 124.63 (Fibonacci retracement, horizontal pullback support).
Stochastic (55,5,3) is seeing major resistance below 99% where we expect a reaction from.

EUR/JPY SHORTHi,
Seildev here:
Area of interest:
- Daily chart resistance for all May/17 at 38.2% fib from high Dec/2014 to low Jun/2016
- Respected resistance from 25th/May/17
- Confluence 61.8% fib for short
- 124.45 to short
Safe Trading everyone.
