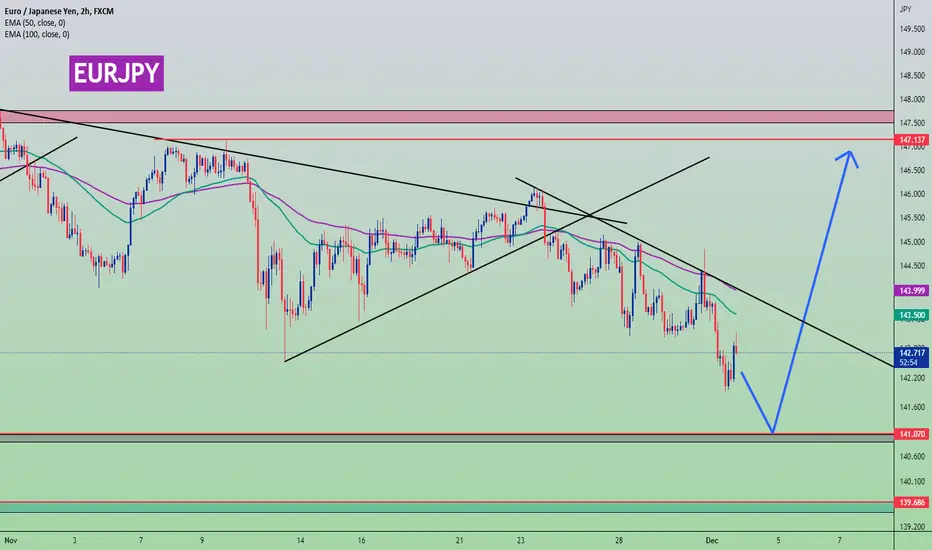
EURJPY - Bearish price action ✅Hello traders!
‼️ This is my analysis on EURJPY .
Here we are bearish from H1 timeframe perspective, so I am looking for shorts. I
missed the entry point, but I will look for a short if price makes a retracement.
Like, comment and subscribe to be in touch with my content!
Eurjpyshort

eurjpy shortConsidering the weakness in the price rise and the strength of the fall and reaching the ceiling of the descending channel, I enter a sell position when I see favorable conditions.
According to my risk and capital management system, the risk of each trade is one percent per position.

eurjpyfinally after a longtime expecting reversal
forming rising wedge in daily tf
incase of breakout expecting 800 pips bearish move
this is not a financial advice do your own research before any action


EURJPY - FALLING AFTER BREAK AND RETESTI see EURJPY dropping from here after this clear break and retest.

EURJPY Breakout Short! EUR-JPY broke the rising support line
So we are locally bearish biased
And so after the pullback and retest
horizontal resistance at 142.405
Further move down is expected

EUR/JPY Confirms New Reset We have broken previous peak formation low and we look to have more selling pressure. I expect to see more selling on this pair to at least cover over 3x its own ADR .

EURJPY - FUNDAMENTAL AND TECHNICAL VIEW#EURJPY
- Currently there is an UP SIDE BIAS for EURJPY. XXXJPY CURRENCIES BUYED VERY FAST IN THE PREVIOUS WEEKS WITH JPY WEAK AFTER THE INTERVENTION. Somehow it is being RECOVERED again. MARKET RISK is still ON. VIX is going DOWN, XXXJPY CURRENCIES SHOULD BE BUY FAST NOW.
- Some NEWS coming for the USD will help strengthen the EURO. Because the reason for that is because the NEWS related to USD is quite weak and USD has got a weak SENTIMENT. But in the future, if the RATE HIKE SENTIMENT is PRICED by the ECB, EURO may be BUY more. For that, the support of EURO STOCKS and VIX must be received. We have no more confirmation that the EURO is likely to be WEAK.
EURJPY can sell at 141.070 level before BUY. After that you can BUY at 150.00 LEVEL. If the MAIN STRUCTURES BREAK anyway, EURJPY price can definitely be BUY at 147.00 LEVELS.
EURJPY CHART ANALYSIS POSTED ON SUNDAY 27 NOVEMBER 2022EURJPY CHART ANALYSIS SHORT!!!
Make sure you do your research and based on your confluence please look for the entry.
Trade safe use proper risk management always.

EURJPY - Short from bearish orderblock ✅Hello traders!
‼️ This is my analysis on USOIL .
Here we are bearish from H1 timeframe perspective, so I am looking for shorts. I expect price to make a retracement to fill the imbalance higher and then to reject from bearish orderblock to take out sell side liquidity.
Like, comment and subscribe to be in touch with my content!

EURJPY Short Opportunity - NOVEMBER RECAP Posted analysis within the setup!
Nice 2RR trade, good M.S and P.A
S turned R and complete RT with bearish engulfing and momentum candle.

EURJPY Top-down analysisHello traders, this is a complete multiple timeframe analysis of this pair. We see could find significant trading opportunities as per analysis upon price action confirmation we may take this trade. Smash the like button if you find value in this analysis and drop a comment if you have any questions or let me know which pair to cover in my next analysis.

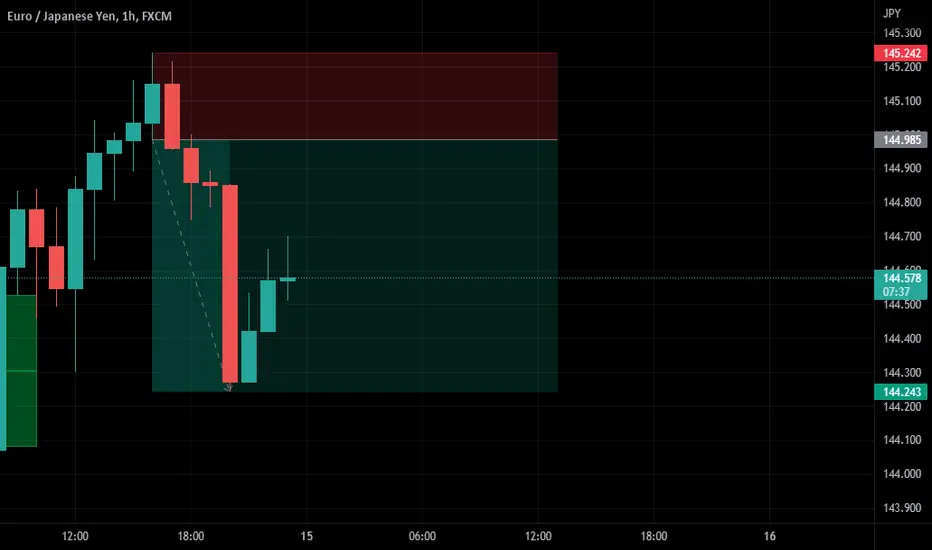
EUR/JPY SHORT TRADE ...According to SMC , EUR/JPY has good entry point for short trade as follow :
ENTRY @ 144.985
SL @ 145.242
TP @ 144.243
RRR IS 1:2.89
GOOD LUCK GUYS ...
20 reasons for Sell EURJPY 🔆MULTI-TIME FRAME TOP-DOWN ANALYSIS OVERVIEW☀️
1 ✨Eagle eye: Multi years Sideways market current candle bullish and tao upper side resistance
2 📆Monthly: Rejected by monthly Resistance, and the current candle is Bearish
3 📅Weekly: Clear Up trend, but the price is Corrective phase now
4 🕛Daily: structural bear toward FVG or Ob
😇7 Dimension analysis
🟢 analysis time frame: Daily
5: 1 Price Structure: Bear
6: 2 Pattern Candle Chart: Big Doji /higher low lower low
7: 3 Volume: good Volume at selling candles
8: 4 Momentum UNCONVENTIONAL Rsi: Sideways
9: 5 Volatility measure Bollinger bands: Below middle band bearish w type formation
10: 6 Strength ADX: strength in for bearish side
11: 7 Sentiment ROC: Currently, JPY perform well against Eur
✔️ Entry Time Frame: H4
12: Entry TF Structure: Bear
13: entry move: Impulse
14: Support resistance base: rejected at previous Resistance
15: FIB: Done trigger event
☑️ final comments: Sell right now
16: 💡decision: Sell
17: 🚀Entry: 144
18: ✋Stop losel:145.2
19: 🎯Take profit:140.8
20: 😊Risk to reward Ratio:1:3.5
🕛 Excepted Duration:5 days

EURJPYBearish flag breakout has already done
now wait for counter tl for shorting eurjpy
not a financial aDVICE

EURJPY SHORT - SUPPORT ABOUT TO BREAK!Waiting for a retest of 143.754 to Short EURJPY back to the prior swing Lows at 140.921
If you agree drop a like and if you have any questions leave a comment :)

EURJPY TRADE! +9.76%Hello traders around the world!
My name is Alexandre Karim.
I want to talk about the trade that I took on EURJPY + How I planned for it.
First of all, if we go back to the Monthly or Weekly chart, we can clearly see that the price reached a mass psychological area around 147.900 / 149.000.
A big ascending channel is formed since 2009 & the price is moving up correctively since March 2020; Which means that the gravity is to the downside.
I was planning to take a short position on that pair.
On November 22 (One day before taking my short position), I noticed an ascending channel with a clear upper TL + multiple touches. I was waiting for the 4th touch on the upper TL and wait for a reversal pattern in this area.
On November 23, the price reached the upper TL & I took a short position on the 15 mins as a consolidation (Mini ascending channel) Moved to BE when the price reached the lower TL @ around 145.077.
Closed my trade at 143.954 (Locked above 1H correction) & out from this trade with 9.76% profit.

EUR/JPY Third Entry Running In 170 Pips , All Entries +900 PipsThis Is An Educational + Analytic Content That Will Teach Why And How To Enter A Trade
Make Sure You Watch The Price Action Closely In Each Analysis As This Is A Very Important Part Of Our Method
Disclaimer : This Analysis Can Change At Anytime Without Notice And It Is Only For The Purpose Of Assisting Traders To Make Independent Investments Decisions.

EURJPY IS SELL FOR SHORT TERMEURJPY IS SELL FOR SHORT TERM, take a short entry and i am sure that the price will fall till my target today

EURJPY 4h Major Supplybeen waiting for price to push up to fill the imbalance above for 2 weeks now, lets see how this plays out. good luck brokies.

Eurjpy Trade Runnig 650 (pips) ProfitEurjpy Trade Ruung 650 pips profit
if you want to Hold must Half lot close movr sl 145
(Goodluck & enjoy Trade)

EUR JPY Short...EUR JPY Sell.... This is not signal... Dont risk more than 3% of your account on any trade...

Eurjpy sell opportunity Eurjpy after the last analysis we shown before, it didnt come to the level where we were ready to sell and its get down before the resistant level..
so now we have opportunity to sell as i did on chart at this levels
I got to risk about 20 pips for sl as I had calculated for this trade
Have i nice day and dont give up..
