EURJPY : Long Trade , 4hHello traders, we want to check the EURJPY chart. The price is moving in an ascending channel and has pulled back to the specified key level. We expect this level to play the role of a support level for us and maintain the upward trend of the price. If the price increases, we expect the price to increase to around 157,900. Good luck.
Eurjpysignal

EURJPY will Move Soon the instrument is getting sneezed in a triangle which is very much located in a heavy Distribution zone and between the monthly Support and Resistance areas which is a good sign of some upcoming volatility
better to have an eye on it as as soon as break true and pull back we can trigger the trade
we have 2 target areas for both the scenarios

EURJPY: Uptrend is formed!The EUR/JPY has experienced a significant bounce from a critical support level, which includes the upper boundary of a slightly upward-trending channel that has been in place since last year, as well as an ascending trend line that dates back to March 2023. This rebound has created an opportunity for the currency pair to potentially reach the previous high at 158.00, which was recorded in early July.

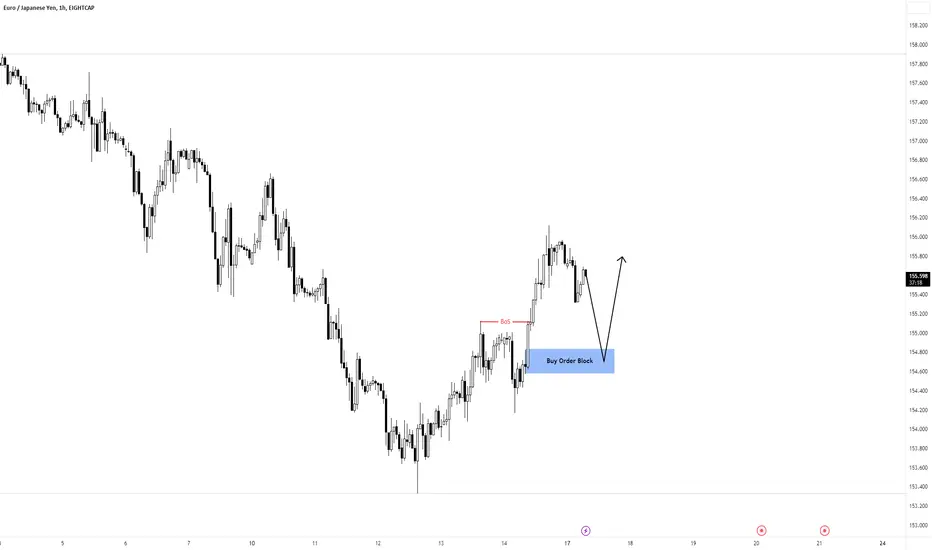
EURJPY Analysis H1Here is my analysis for EURJPY on H1 using Order Block. The price could go bullish, you can put a pending order on the Order block or find an entry on LTF within OB Zone. Trade Safe!
EURJPY 4H Bearish Setup for SELL!Hello Everyone,
Welcome to FXMYWORLD.
I still don't have sell confirmation yet.
For sure once we have sell confirmation, it will be big sell.
Make sure you do your research and based on your confluence please look for the entry.
Don't rush your trades without any confirmation.
Thanks in advance for checking my trade idea.


EURJPY POSSIBLE TRADE SHORTA POSSIBLE REVERSE ON THE LOW TIME FRAMES GOOD TRADE FOR INTRADAY STYLE
waiting for agressive sellers to step in

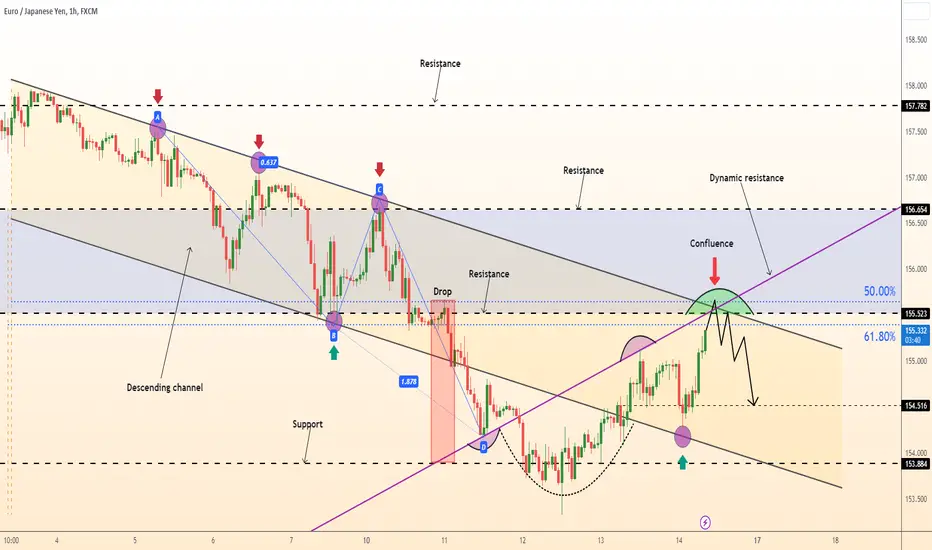
DeGRAM | EURJPY confluence levelEURJPY is moving down the channel.
The market is testing the confluence level by making a complex pullback.
Price action broke and closed above the lower high, meaning the market is in consolidation.
The price is likely to bounce off the confluence level.
-------------------
Share your opinion in the comments and support the idea with like. Thanks for your support!
EURJPY Potential DownsideIf the movement at the closing of the H4 candle is still in the 155.30 area, then most likely the HNS could be valid.
Short position I have done with RR 1:2

GBPJPY and EURJPY Top-down analysis Hello traders, this is a complete multiple timeframe analysis of this pair. We see could find significant trading opportunities as per analysis upon price action confirmation we may take this trade. Smash the like button if you find value in this analysis and drop a comment if you have any questions or let me know which pair to cover in my next analysis.

EURJPY AnalysisHello Everyone. I want share my idea about EURJPY.
After pretty bullish trend now we see price correction.
Daily Fibonacci gave us good LVL for open long position with good 1:3 reward.
My price prediction will be long, but here we have one thing what we need to pay attention, JPY index which started strong reversal price movement after touch weekly support (I will link in the idea my last price prediction about that index)
Overall trend is bullish which is strong and in my opinion it will continue until it touch to 2008 high ( in this year was collapse of market )
Here is my 2 price prediction.
1 Bullish - price pull back from Fibonacci 50 LVL and continue moving up, with it we will see new good low of uptrend.
2 Bearish - price brake support which is at 154-152.8 same as Fibonacci levels then it will make retest and continue moving down.
BE PATIENT!!

EURJPY Idea H1Here is my analysis for EURJPY on H1 using Order Block. The price could go bearish, you can put a pending order on the Order block or find an entry on LTF within OB Zone. Trade Safe!

EURJPY Analysis 11July2023for now the price is stuck at the second SND, if the price manages to fall more than the second SnD, then the bullish trend has collapsed. could be the beginning of a change to a bearish trend.

EURJPY Breakout Trade IdeaEURJPY Breakout Trade, place buy and sell stop.
Manage your risk according to Account Size!

EURJPY BuyDo not think that the pair is overbought and it will now, look at Japan economy and their policy. Japan will strong but not now. They are doing great work but their currency is weak against the all pairs.

DeGRAM | EURJPY bearish opportunityEURJPY is currently breaking out of the ascending channel .
It broke and closed below the psychological level of 157.000. and the consolidation zone.
Price movement is gaining momentum, and we might see a sharp bearish move.
We expect a bearish move.
-------------------
Share your opinion in the comments and support the idea with like. Thanks for your support!

EURJPY: Despite the alarming inflation figures from Germany and.The EUR/JPY pair extended its losses for the second consecutive day, sliding to 157.40. Strong retail sales data from Japan contributed to the strengthening of the Japanese Yen. Despite hot inflation figures reported in Germany, with CPI rising to 6.4% (compared to the expected 6.3%), and in Spain, with CPI reaching 1.9% (compared to the expected 1.7%), the EUR/JPY pair still faced pressure. However, the increased interest rates in Germany limited the potential depreciation of the Euro.

EUR JPY Short Setup - Bearish Divergence Play Well. OANDA:EURJPY EUR JPY Short Setup - Bearish Divergence Play Well in 1hr

EURJPY Top-down analysisHello traders, this is a complete multiple timeframe analysis of this pair. We see could find significant trading opportunities as per analysis upon price action confirmation we may take this trade. Smash the like button if you find value in this analysis and drop a comment if you have any questions or let me know which pair to cover in my next analysis.

EURJPY - Bearish Setup - Hight TF Supply AreaPrice has tapped into weekly supply area and a market structure shift on LTF confirming a retracement to 0.382 Fib level and 4H demand level.
Entry: 155.864
TP:153.196
SL: 156.516
RR: 1:4
Follow for more :)


EURJPY Day Trade SellFX:EURJPY Sell
Day Trade today
EURJPY Sell 155.969
Top 155.600
It has reached the resistance and moving horizontal so good opportunity to sell

EURJPY: New events!Asian stock markets could fall in Monday's trade as investors await to see if the recent sell-off in long-dated bonds will last and could ease pressure on the dong. Dollar.
The MSCI index of Asia-Pacific shares (excluding Japan), was down 0.02% at 562, but still near the January high of 574.52.
Japan's Nikkei (N225) fell 0.4% after hitting a six-month high on Friday, as Japan recorded a record economic contraction in the second quarter.
E-Mini futures for the S&P 500 were up 0.25%, well below a record-high close of 3,386.15.
US second-quarter earnings season will end with major retailers reporting this week, including Walmart Inc (N: WMT), Home Depot Inc (N: HD) and Kohls Corp (N: KSS).
Politics will be in the spotlight as the Democratic National Convention kicks off the 2020 presidential election season.
