EURNOK - short on economic surprise differentialFundamentals:
-EU: eco slowdown continues, underpinned by ECB
-NOR: inflation picking up, central bank will further hike this year -> carry trade
-NOK gained even under risk-off sentiment
-CitiBank Eco Surprise Index (1mo) differential: -53.9 vs +53.6 in favor of NOK
EURNOK
a micro analysis on eursekfollowing our last analysis on eursek where we expect a big drop, we expect eursek to behave the very same way it did the last two peaks before drop last months. to target the exact point of reversal during those endless ascending move (generally heralding an important reversal) we want to see two things :
1) the upper bollinger band on 4h time frame must draw an upper parabolic maximum
2)the price curve must in a last attempt (typical stop loss hunting) impulsively touch this point and reverse immediately
regarding how eursek is near of such a situation this should take place this monday or at the latest thursday with a flat monday to bring confusion first.
we shall do nothing before seeing that, if it crosses badly this upper bollinger band we won't be caught, if it falls even without doing so we won't believe in the reality of the fall, experience on eursek tells us to be cautious and act if and only if those two conditions are met before
eursek, all or nothingeursek has been perfectly bouncing on a support 3 times with a bounce losing intensity each time it hit the support, then it broke and started confidently a down move inside a new channel below. of course now we have through a perfect alignment a retest by below of this previous support, exactly at this point the DMI reaches an extreme value, we do not see how eursek can do anything else than dropping sharply now, this move is also supported by what we see on noksek, usdsek, eurnok and eurusd. this is very simple, if eursek surprisingly cross confidently the 1.53 1.54 area, we will see it coming very soon and then we freeze everything, the loss will be minimal, otherwise we can short eursek massively from where it stands
short EURNOK on continued poor EUR growth Trade we have had on for a while- continue to like short EURNOK on poor EUR growth and interest rate differentiation vs Norway. Highlighted two declining trendlines as well as Fibonacci support areas that we are currently trading around.
Head and shoulder pattern with right, declining leaning shoulder highlighted by the trendline.
EURNOK - H4 SHORT SETUP - TTS-IIEntered SHORT on on EURNOK after the break and confirmed retest of the support turned resistance at 9.70000.
Monday gap has broken the 20 SMA as well as the range support and waited for the confirmed retest of the previous support (now resistance) before entering SHORT.
TP is at 9.40000 (365 pips) which is the first logical level of structure while SL just above (or barely above) the trigger candle (180 pips), giving a potential risk reward of 1:2.
EURNOK Sell IdeaEURNOK Sell Idea @ Daily Supply Zone (9.75401 - 9.80640)
Sell Limit: 9.74897
Stop Loss: 9.81383
Take Profit: 9.60227
Risk Management = 0.01/$100
Recommended Leverage not to exceed 1:50
Recommended Risk Ratio 1:1.5 – 1:3
Close partially the contract once it reaches 50% of profit, Move stop loss over the entry level
Close partially the contract once it reaches 80% of the profit
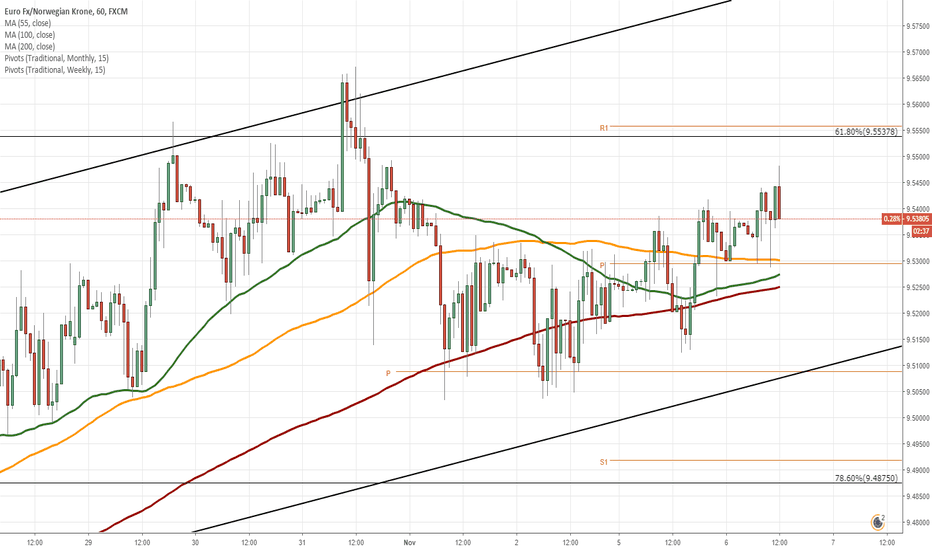
EUR/NOK 1H Chart: Bullish momentum prevailsThe Euro has been appreciating against the Norwegian Krone since the the middle of October. This movement has been bounded in an ascending channel.
Given that the currency pair is supported by the 55-, 100– and 200-hour SMAs, it is likely that the rate continues to go up within the following trading sessions. Technical indicators for the 4H and 1D time frames also support bullish scenario. A potential target is the resistance cluster formed by a combination of the weekly R2, the monthly R1 and the Fibonacci 50.00% retracement located circa 9.6000.
It is the unlikely case that some bearish pressure still prevails in the market, the Euro should not exceed the weekly S2 at 9.4719.
EUR/NOK 1H Chart: Downside potentialThe Norwegian Krone has been appreciating against the Euro in a short-term descending channel. This movement began on September 7 when the pair reversed from the upper boundary of a long-term descending channel.
As apparent on the chart, the currency pair is pressured by the 55– and 100-hour SMAs. Most likely that the pair will continue to go down and will aim for the support level formed by a combination of the weekly S1 and the Fibonacci 100.00% retracement located circa 9.4100.
If given support level does not hold, it is likely that the exchange rate will continue to go downside to the weekly S2 at 3.3377.
EURNOK to rally=> Here we are arguing from the angle that the bearish sentiment on EURO as mentioned in our previous ideas will fade and begin to position into a solid macro narrative.
=> Qatar has announced an FX swap agreement with Turkey for $15bn this morning, frankly they might as well wave goodbye to this money with Erdogan at the helm. Short-term however this will provide support for EMU based banks.
=> ECB's Weidmann has begun talking up policy normalisation as expected and on the other side of the coin we have Italy praying for an extension in QE.
pascalToday at 10:00
=> Concerns over continued pressure on commodity prices is not painting a pretty picture for NOK. Markets have fully priced in the hike coming in September from Norges Bank and we are starting to see smart money taking profits.
=> We are targeting 9.80 - 9.90 with stops below the recent 9.50 low
=> Good luck


