EURNOK

OBX shortWith falling oil prices and corona-virus spreading like a wildfire, we are likely to see the obx drop even more. It does not look like Saudi or Russia is planning to stop dumping the oilprice either. The Norweigan krone is has had a huge loss because of the oil price, and foreign investors leave the norwegian market when the price of NOK vs EUR/USD is rising. The Euro has now risen more than 13% in the last 29 days

EURNOK suffers the worst sell-off in a few decadesEURNOK Forex cross pair (Euro versus Norwegian Krone) has broken all time high again after months. A previous monthly demand imbalance gained control last June 2018 and this cross pair has been rallying ever since.
Why has Norway’s Krone suffered the worst drop in half a century? Well, by doing supply and demand analysis on the monthly timeframe we can see that EURNOK forex cross pair was in a clear uptrend on. There is no reason to go short, only longs are possible by following the big picture monthly uptrend. We can see in the attachment a very strong monthly impulse around 10.35 at (1) that could eventually become an imbalance if price continues like that.
We don’t need to pay attention to Forex fundamental analysis if we are trading a supply and demand imbalances strategy and trading with the bigger picture trend. It’s taken for granted that if you trade the very small timeframes, fundamental analysis and news events will kick you out of the trade.


EURNOK Idea until next seasonability of structural liquidityArea of working until next seasonability of structural liquidity, between ATH of october 2019 and ATH 2014.

EURNOK - mean reversionNOK got undervalued due to the OIL price decline
Norges Bank interest rate: 1.5% vs ECB 0% -> carry favors NOK
Inflation is also higher in Norway
I went short on technical + fundamental factors coinciding.

EUR/NOK short/sell idea. almost 2150 pips move...in the name of ALLAH who is most merciful and the master...

EURNOK BULLISH TREND-HIGH PROBABIITY TO MAKE MONEYReversal pattern for EURNOK completed and ready to go.
EURNOK analyze built reversal pattern what is a reversal pattern, Trend reversal patterns are essential indicators of the trend end and the start of a new movement. They are formed after the price level has reached its maximum value in the current trend. The main feature of trend reversal patterns is that they provide information both on the possible change in the trend and the probable value of price movement.
What pattern do we have?
A head and shoulders pattern is a chart formation that resembles a baseline with three peaks, the outside two are close in height and the middle is highest. In technical analysis, a head and shoulders pattern describes a specific chart formation that predicts a bullish-to-bearish trend reversal.
source: Head And Shoulders Pattern Definition - Investopedia
What is the target?
The target will be probably around 10.60.
Thank you to read and good luck .

New York Watchlist: EURNOK Sell EURNOK SELL
ENTRY 10.1580 /// MODERATE 10%
SL 10.17915 ( pips 221 )
TP 10.08605 ( pips 709 / RR 3.2 )
On 4H we have a solid contraction and we are pretty much at the top of it. RSI is at its highs too.
On 1H we have a minor contraction supportin the sell idea with a decent rejection level.
On the minute charts I see a reversal coming within this hour (in the next 50mins)

ridethepig | Apple in the worm for CADNOKA very good time to update the short-term flow setup for CADNOK after such a brilliant squeeze. For those tracking the 2020 Macro flows:
This week we have a simple technical move in play. A textbook case of "Apple in the worm" as it seems to me a poor choice of the moment for buyers to continue the advance. Extending the characteristics position (= swing configuration) by letting buyers go overboard and bet on momentum while the macro defence can be a reliable guardian.
A better move is to sell the 6.99xx highs here with targets located initially at the support levels 6.865xx.. and then perhaps 6.47xx. The business of a bullish NOK did not become an attacking instrument; stops can be kept comfortably above the 7.00xx handle.
Good luck all those trading CADNOK in the coming sessions, as usual thanks for keeping your support coming with likes, comments and etc!

EUR/NOK changes trendNorwegian Krone became quite overpriced and we see the change in trends for the short and midterm.
Entry: 9.86
Stop-Loss: 9.77
Target: 10.10
Have a nice week! Follow for more.

EURNOK-Head & Shoulders In The worksThis pair has just come off a multi-year high. Does it really make any sense since Norway is pretty solid on cash and Europe is a mess? With oil at support, I am going to short this right shoulder.

EURNOK: Buy opportunity on 1D MACD.The pair is trading within a long term 1M Channel Up (RSI = 53.878, MACD = 0.135, ADX = 43.274, Highs/Lows = 0.0000) since Q4 of 2017. At the moment the price seems to have found Support around the 1D MA200 (orange line) and withi the 1D MACD making a bullish cross over, is expected to rise.
According to a similar fractal in January 2018, the High of that spike could be around the 0.618 Fibonacci retracement level. We place our Target at 10.0700.
** If you like our free content follow our profile (www.tradingview.com) to get more daily ideas. **
Comments and likes are greatly appreciated.


EURNOK and USDNOK SetupsEURNOK and USDNOK both been in a prolonged downtrend with multiple swings and we have reached an important support/flip zone on the daily chart.
Looking to see a reversal here and we already getting signs of trend exhaustion with a potential double bottom pattern and we could also create our first higher low swing here with a break above the highlighted zone.
A simple trade idea with good confluences. Await for the break and close to enter.

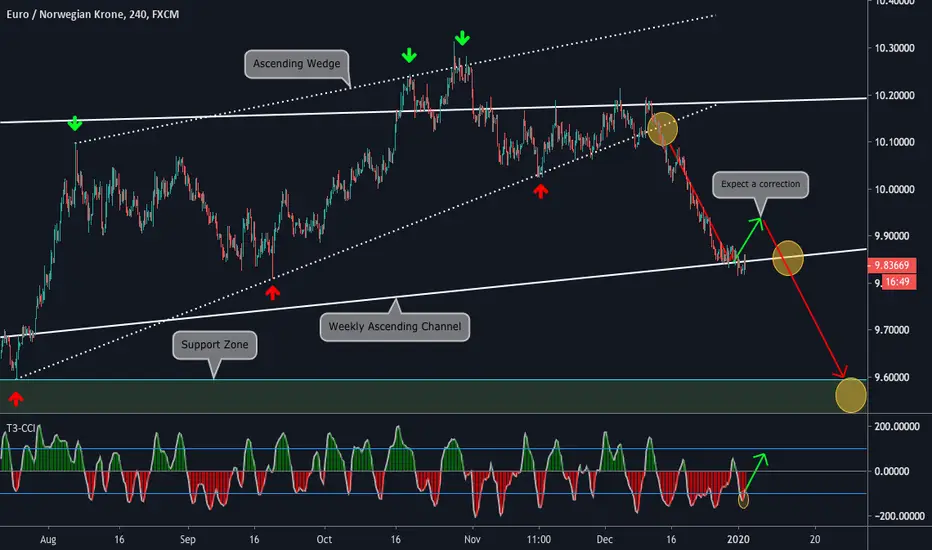
"EURNOK: first target reached" by ThinkingAntsOk4H Chart Explanation:
- Price was on a Ascending Wedge.
- It moved down towards the Weekly Ascending Channel after the wedge was broken.
- Bullish CCI could be indicating a correction.
- If price breaks the Ascending Channel, it has potential to move down towards the Support Zone.
Daily Vision:
Weekly Vision:
EURNOK is near the Support/Resistance Zone!We can look for accurate Buy entry above the Support/Resistance Zone.
The best trade will be after the false breakout and D1 candle will close above.
Potential profit will be 3 times bigger than the risk.
Push like if you think this is a useful idea!
Before to trade my ideas make your own analyze.
Write your comments and questions here!
Thanks for your support!


EURNOK Neutral TakeWill be using both Key Resistance and Support to enter the market, if price fails to enter any region and include a confident reason to enter, then we will not enter.


EURNOK - Elliot Wave patternPrice completed ABC wave. Now we're in the abcde corrective wave. Looking for price to react off descending trendline
