HelenP. I Euro can reach resistance zone and then dropHi folks today I'm prepared for you Euro analytics. If we look at the chart, we can observe a mature uptrend that has been supported by a major ascending trend line for an extended period. However, the momentum of this trend appears to be waning, as evidenced by the price's recent failure to establish new highs. The asset is currently trading below the critical resistance zone of 1.1770 - 1.1800, an area that has proven to be a significant barrier for buyers. My analysis for a short position is based on the condition of a final retest of this resistance zone. I believe the price will make another attempt to rally into this area, and a forceful rejection from this zone would serve as the confirmation that sellers are taking definitive control of the market. Such a rejection would likely initiate a strong downward impulse with sufficient momentum to break the long-standing ascending trend line, a pivotal event that would shift the market structure. Therefore, the primary goal for this bearish scenario is set at the 1.1600 level, a logical target for the price to reach after such a significant structural break. If you like my analytics you may support me with your like/comment ❤️
Disclaimer: As part of ThinkMarkets’ Influencer Program, I am sponsored to share and publish their charts in my analysis.
Euro

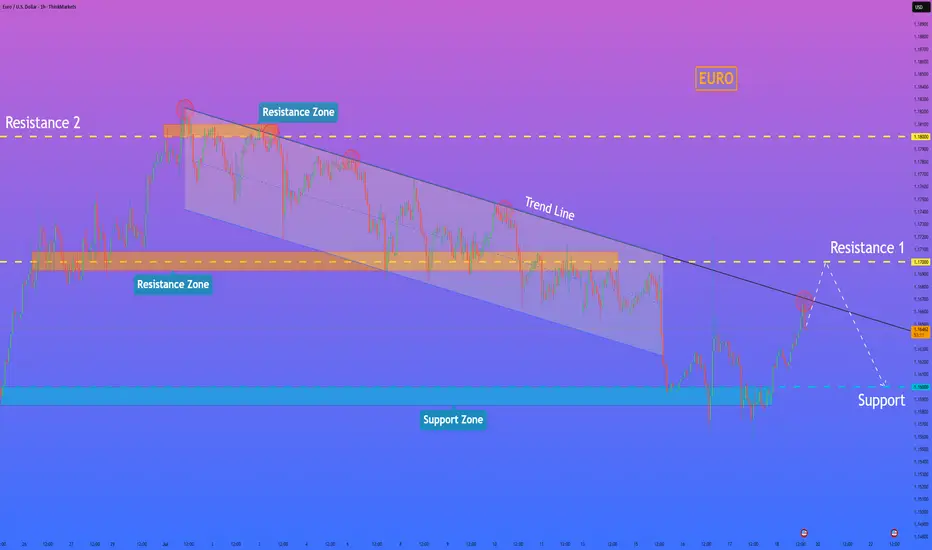
Euro may reach resistance level, break it and continue to growHi guys, this is my overview for EURUSD, feel free to check it and write your feedback in comments👊
For an extended period, the price was dictated by a descending channel, with each rally attempt failing at its upper boundary.
The downward trend culminated in a test of the crucial support level at $1.1635, where sellers were unable to secure a foothold, signaling a potential momentum shift.
This shift was confirmed when buyers took control, launching an upward impulse that decisively breached the long-standing resistance of the channel's upper trendline.
After the breakout, the price established a new local support base above the former channel, solidifying the change in market structure.
The subsequent rally carried the asset's price to the significant horizontal resistance zone around $1.1755, where the upward advance has temporarily stalled.
I expect that after a brief consolidation, bullish pressure will resume, enabling the price to break the $1.1755 barrier and continue towards the $1.1820 target.
If this post is useful to you, you can support me with like/boost and advice in comments❤️
Disclaimer: As part of ThinkMarkets’ Influencer Program, I am sponsored to share and publish their charts in my analysis.

SHORT ON EUR/NZDEZ Has given a nice CHOC to the downside with plenty of sell side liquidity to be collected.
I will be selling EZ to the next level of demand looking to catch 300-500 pips

Euro will rise a little and then start to fall to support lineHello traders, I want share with you my opinion about Euro. After a prolonged consolidation period, a strong upward trend was initiated from the buyer zone around 1.1285, propelling the EUR significantly higher. This initial impulsive move has since transitioned into a more complex and mature phase, taking the shape of a large upward wedge formation, a pattern which often signals underlying exhaustion in the prevailing trend. Currently, the pair is operating within this defined market zone, characterized by a clear ascending support line and a corresponding resistance line. The price action inside the wedge has become corrective, with the most recent upward correction originating from the support area near 1.1575. The working hypothesis is centered on a short-term bearish scenario, which anticipates that this current rally will fail as it approaches the upper boundary of the wedge. A rejection from this resistance would confirm that selling pressure is increasing and that the bullish momentum is waning. This would likely trigger a significant downward rotation within the structure, with the immediate objective being a retest of the main ascending support line. For this reason, the TP is strategically and logically placed at the 1.1665 level, as this point lies directly on the trend line and serves as the most critical test for the existing uptrend's viability. Please share this idea with your friends and click Boost 🚀
Disclaimer: As part of ThinkMarkets’ Influencer Program, I am sponsored to share and publish their charts in my analysis.

EUR/JPY: Bullish Thesis on Policy DivergenceOur primary thesis is built on a powerful confluence of compelling fundamental drivers and a clear technical structure. We are taking a long position in EUR/JPY with high conviction, anticipating significant upside fueled by a stark monetary policy divergence confirmed by a constructive chart formation.
📰 Fundamental Analysis: The core of this trade is the widening policy gap between the European Central Bank (ECB) and the Bank of Japan (BoJ). While the BoJ is only just beginning to exit its ultra-loose monetary policy, the global environment points toward continued JPY weakness. The upcoming high-impact US news will act as a major catalyst. A "risk-on" reaction to the data would significantly weaken the JPY, providing a strong tailwind for this trade.
📊 Technical Analysis: The chart structure for EUR/JPY is decidedly bullish. The pair has established a clear uptrend, and recent price action indicates a period of healthy consolidation above key support levels. This presents a strategic entry point, as the market appears to be gathering momentum for the next leg higher. The current setup suggests a low-risk entry into a well-defined upward trend.
🧠 The Trade Plan: Based on this synthesis, we are executing a precise trade with a favorable risk profile.
👉 Entry: 172.422
⛔️ Stop Loss: 171.292
🎯 Take Profit: 174.684
⚖️ Risk/Reward: 1:2

EUR/GBP: Bullish Stance Above 0.8640This signal outlines a tactical long entry on EUR/GBP, positioning for a bullish resolution from today's major fundamental events.
📰 Fundamental Thesis
This position is taken ahead of the two primary market movers: the ECB rate decision and the UK PMI data. The core thesis is that the ECB policy statement will be the dominant catalyst, providing strength to EUR that will outweigh the impact of the UK data release.
📊 Technical Thesis
The trade is defined by a sound technical structure. The stop loss is anchored beneath the critical support zone at 0.8640. The profit target is set to challenge the resistance area just above 0.8722. This setup offers a favorable and clearly defined risk-to-reward profile.
🧠 Risk Management
Execution is timed before extreme event-driven volatility. Adherence to the stop loss is critical to manage the inherent risk of this pre-news strategy.
Trade Parameters
⬆️ Direction: Long (Buy)
➡️ Entry: 0.86690
⛔️ Stop Loss: 0.86344
🎯 Target: 0.87382
✅ Risk/Reward: 1:2

Euro Futures (6E) – Bearish Drift Below ResistanceEuro Futures (6E) appears to be grinding lower showing clear signs of fading bullish momentum.
After a bounce off 1.16160 support on July 17, Euro Futures (6E) made a failed push into 1.17995 resistance on Tuesday, July 22, a level that’s acted as a firm ceiling since June 26.
Since then, price action has been in a descending broadening channel, often a precursor to further downside with expanding volatility as sellers control the tempo.
As of 5:20 AM GMT, the structure points to continued weakness. I expect 6E to settle around 1.17170 – 1.16990 by close of Wednesday, July 23, 2025.
📉 Bias: Bearish
🔍 Pattern: Broadening Descending Channel
🕒 Date: July 23, 2025

Trump did it again!Donald Trump did exactly what he did in his previous term: Dollar Devaluation .
Reason? Strengthening the US exports.
Will it work? We'll see.
What's your thoughts?
#dollar #forex #euro #devaluation #trump #exports #trading #algo

EURUSD Will the 1D MA50 hold?The EURUSD pair seems to be rebounding just before a 1D MA50 (blue trend-line) test, which is its short-term Support. At the same time it bounced off the 0.382 Fibonacci retracement level, which after a +6.92% rise, it resembles the March 27 rebound.
The 1D RSI is printing a standard bullish reversal setup, seen already 4 times since February, and a break above its MA will confirm it.
As long as the 1D MA50 holds, it may extend the uptrend to a new Channel Up (dashed), outside the blue one that may look for a new +6.92% rise. In that case our Target will be 1.21000.
If the 1D MA50 breaks, we will add one last buy at 1.14000, near the 1D MA100 (green trend-line).
-------------------------------------------------------------------------------
** Please LIKE 👍, FOLLOW ✅, SHARE 🙌 and COMMENT ✍ if you enjoy this idea! Also share your ideas and charts in the comments section below! This is best way to keep it relevant, support us, keep the content here free and allow the idea to reach as many people as possible. **
-------------------------------------------------------------------------------
Disclosure: I am part of Trade Nation's Influencer program and receive a monthly fee for using their TradingView charts in my analysis.
💸💸💸💸💸💸
👇 👇 👇 👇 👇 👇

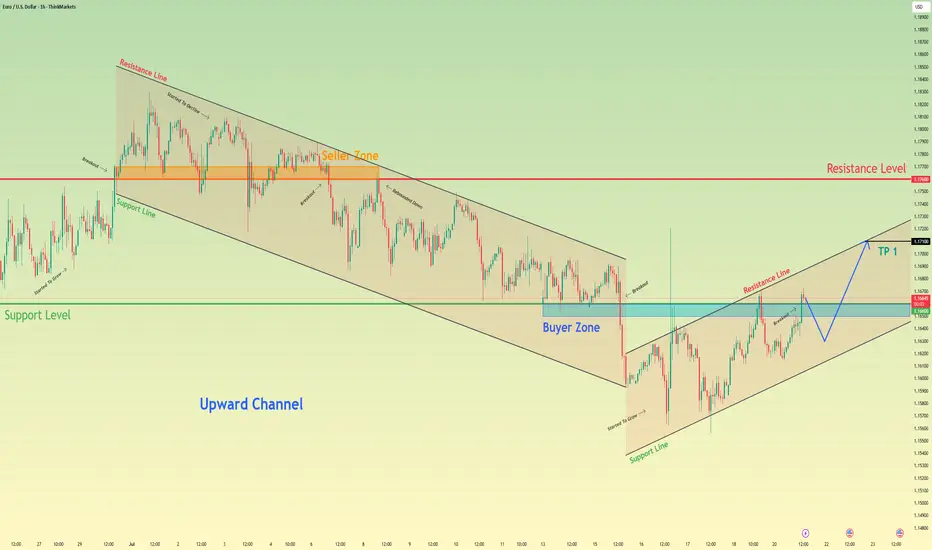
Euro may correct a little and then continue to rise in channelHello traders, I want share with you my opinion about Euro. Observing the recent price action, we can map out a clear transition in market structure. Previously, the pair was contained within a well-defined downward channel, where the seller zone around the 1.1760 resistance level consistently capped rallies, leading to multiple breakdowns and correctional movements. However, after a final push lower, the dynamic shifted, with the price action showing a clear downtrend-to-uptrend reversal. Currently, the euro has established a new upward channel, finding solid ground in the buyer zone around the 1.1660 support level. The price is now engaged in a constructive upward movement within the boundaries of this new channel. The prevailing hypothesis is that after a potential minor correction towards the channel's support line, the pair will resume its ascent. Therefore, the take-profit target for this scenario, tp 1, is strategically placed at 1.1710, as this level directly corresponds with the resistance line of the current upward channel, representing a logical point for price to react. Please share this idea with your friends and click Boost 🚀
Disclaimer: As part of ThinkMarkets’ Influencer Program, I am sponsored to share and publish their charts in my analysis.
euraud long tradein my opinion this is a good trade with a good r/r
hope hit the tp
consider this is my trade not your trade and i just like to share my trades with world

EURO - Price can continue to decline in falling channelHi guys, this is my overview for EURUSD, feel free to check it and write your feedback in comments👊
For a long time, the price was moving within a large ascending wedge, showing a gradual upward trend.
However, buyers failed to maintain momentum, and the price made a decisive breakout below the wedge's support line.
Following the breakout, the instrument established a new structure, a local falling channel, and has been trading within its boundaries since.
Currently, the price is in a corrective upward move, approaching the key resistance area of $1.1630 - $1.1660.
This zone is significant as it aligns with a previous support level and the upper boundary of the current falling channel.
I expect that the price will face rejection from this resistance area and will then continue its decline towards the channel's support line, targeting the $1.1465 level.
If this post is useful to you, you can support me with like/boost and advice in comments❤️
Disclaimer: As part of ThinkMarkets’ Influencer Program, I am sponsored to share and publish their charts in my analysis.

HelenP. I Euro will reach resistance level and then start fallHi folks today I'm prepared for you Euro analytics. For an extended period, the euro was trading within a clearly defined downward channel, consistently respecting its boundaries and moving under bearish pressure. Recently, however, the price staged an aggressive breakout from this structure, pushing above the upper trend line with a strong impulse. This move signaled a potential shift in momentum, as buyers appeared to take control and drive the price away from the major support zone near the 1.1600 level. Currently, following this upward breakout, the price is approaching a critical test at resistance 1. This area, centered around the 1.1700 level, is significant as it previously acted as a key pivot point and support inside the downward channel. The current price action is a classic scenario where old support is being retested as new resistance, which will determine the validity of the recent bullish move. Despite the recent breakout, I expect the upward momentum to fail as the price challenges the resistance zone 1 around 1.1700. I anticipate a rejection from this level, which would confirm the breakout as a false move and re-establish the dominant bearish trend. The primary target for the subsequent decline is the major support level at 1.1600. For this reason, my goal is set at the 1.1600 level. If you like my analytics you may support me with your like/comment ❤️
Disclaimer: As part of ThinkMarkets’ Influencer Program, I am sponsored to share and publish their charts in my analysis.
SHORT ON EUR/CADEUR/CAD has given us a nice CHOC (change of character) to the downside followed by a nice retest to supply.
I expect price to push up a little more into supply before dropping to the next support/demand level.
Looking to Catch 300-400 pips over the next few days.

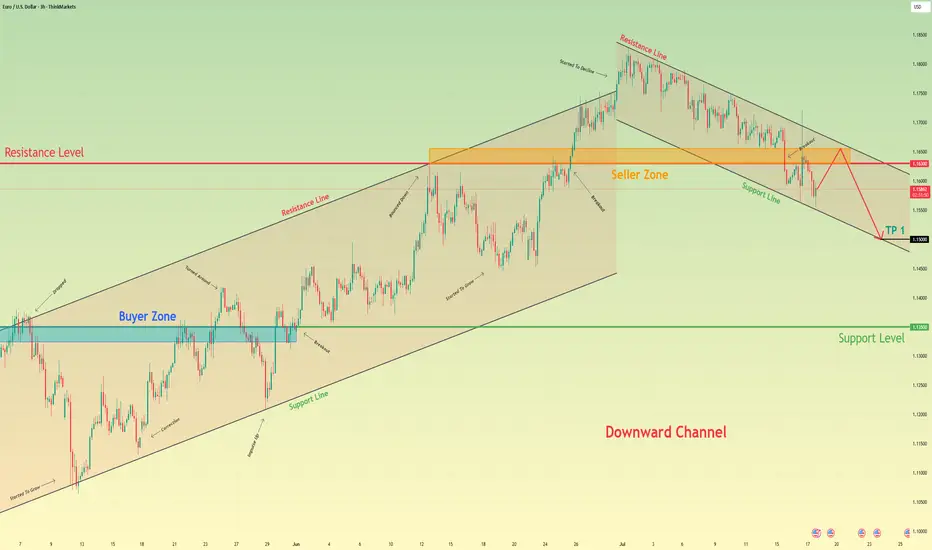
Euro may reach seller zone and then continue to fall in channelHello traders, I want share with you my opinion about Euro. The price pair has recently shifted its market structure, establishing a clear downward channel after breaking its previous uptrend. Before this breakdown, the price was consistently trading within an Upward Channel, repeatedly finding support in the buyer zone (1.1325–1.1350) and reversing upward. The bullish momentum eventually faded when the price failed to break the major horizontal resistance level at 1.1630. This failure triggered a strong bearish impulse, leading to a decisive breakout below the channel's support line and confirming a trend reversal. Currently, the price is making a corrective move up inside the newly formed downward channel, which appears to be a classic retest of the broken structure from below. I expect this upward move to stall as it approaches the heavy confluence of resistance formed by the channel's upper Resistance Line and the horizontal seller zone at 1.1630–1.1655. After testing this area, I anticipate a rejection and the beginning of a new bearish leg down. That's why I've set my TP at the 1.1500 level — it aligns perfectly with the support line of the current downward channel, making it a logical target for sellers. Please share this idea with your friends and click Boost 🚀
Disclaimer: As part of ThinkMarkets’ Influencer Program, I am sponsored to share and publish their charts in my analysis.
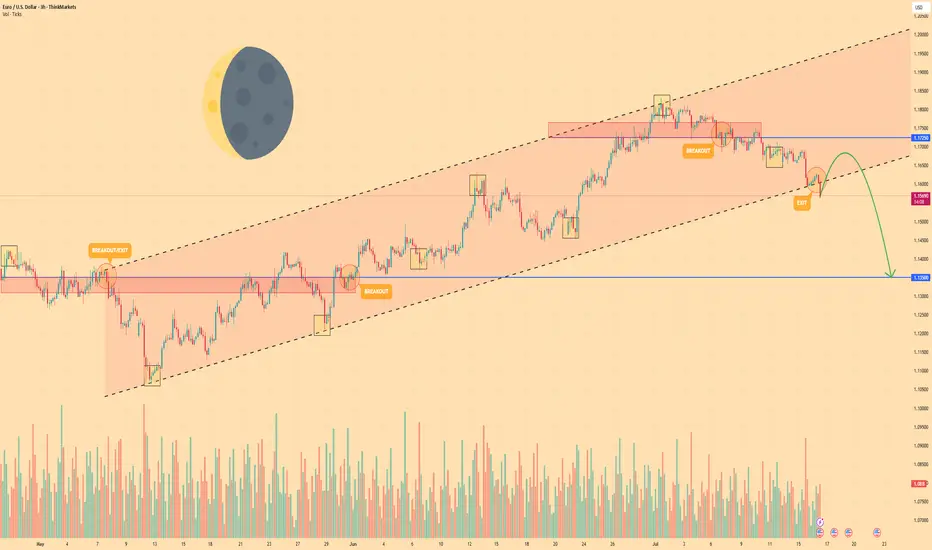
EURO - Price may drop to $1.1350 support level Hi guys, this is my overview for EURUSD, feel free to check it and write your feedback in comments👊
Euro began its journey by breaking into a rising channel off the swing low near $1.1080, establishing a clear uptrend.
Within this channel, price carved out steady support along the lower trendline, touching $1.1350 before buyers stepped.
Mid-channel, two breakout attempts at $1.1550 and $1.1725 highlighted bullish conviction, yet both retreated back below resistance.
Simultaneously, two exit signals appeared near the upper trendline around $1.1765, showing that upward momentum was losing steam at key inflection points.
Currently, EUR is holding just below the channel base after a minor bounce, consolidating as traders weigh the next move.
I foresee a brief climb toward near $1.1670 before a renewed bearish thrust drives price back down to test $1.1350 level.
If this post is useful to you, you can support me with like/boost and advice in comments❤️
Disclaimer: As part of ThinkMarkets’ Influencer Program, I am sponsored to share and publish their charts in my analysis.
Euro may fall to support area and then start to growHello traders, I want share with you my opinion about Euro. The price previously moved inside a wedge formation, where it tested the buyer zone and showed a strong reaction from this area. After that, the pair broke out upward and started to trade inside an upward channel, building momentum and forming a clear bullish structure. Later, the price created a pennant pattern, often considered a continuation signal. But before continuing the upward trend, I expect the Euro to first exit from the pennant and decline toward the support area. This zone was previously resistantce, and now it may turn into a strong support. Now the price is trading near the pennant resistance, but I don’t expect a breakout right away. The market needs to correct before it resumes the uptrend. Once the price reaches the current support level or slightly lower, it may find demand again and bounce. That’s why I expect the Euro to retest the support zone and then grow further toward TP 1 - 1.1850 points. This target aligns with the upper border of the upward channel and would complete the continuation move after the pennant breakout. Given the previous structure, bullish momentum, and patterns on the chart, I remain bullish after the correction and expect the price to rise from the support zone. Please share this idea with your friends and click Boost 🚀
Disclaimer: As part of ThinkMarkets’ Influencer Program, I am sponsored to share and publish their charts in my analysis.

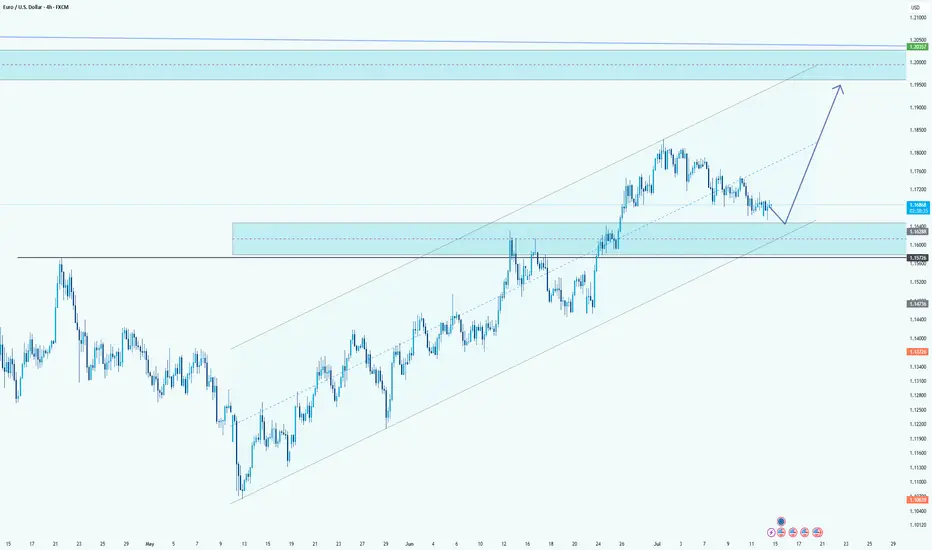
EUR/USD Retracement Into Demand ZoneHello guys!
EUR/USD is currently undergoing a healthy retracement after an extended bullish trend within the ascending channel. The price is now approaching a key demand zone, which aligns perfectly with the mid-line of the channel structure.
This zone previously acted as a strong resistance area and is now expected to serve as support, confirming a classic flip in market structure. The reaction around the 1.16288 - 1.15774 area will be crucial.
If buyers step in here, the bullish momentum is likely to resume with the next major target being the upper resistance zone near 1.20000 , as projected by the upward arrow. The overall structure remains bullish as long as the price holds above the channel support and doesn't close below the last demand zone.
EURUSD The 4H MA200 distinguishes bullish from bearish.The EURUSD pair has been trading within a (blue) 2-month Channel Up since the May 12 Low and it just broke below its 4H MA100 (green trend-line). The previous two Bearish Legs of this pattern bottomed (made a Higher Low) on or just above the 0.5 Fibonacci retracement level.
As a result, the price is very close to the most optimal buy level of this pattern and as long as it holds, we expect to start the new Bullish Leg and target the 1.5 Fibonacci extension (1.20000 our Target just below), which is in line with the previous two Bullish Legs.
If however the 4H MA200 (orange trend-line) breaks, we will take the loss on that long and go short as technically the price should seek the bottom of the (dotted) wider Channel Up. Our Target on that occasion will be 1.14000, right at the top of the High Volatility Zone.
-------------------------------------------------------------------------------
** Please LIKE 👍, FOLLOW ✅, SHARE 🙌 and COMMENT ✍ if you enjoy this idea! Also share your ideas and charts in the comments section below! This is best way to keep it relevant, support us, keep the content here free and allow the idea to reach as many people as possible. **
-------------------------------------------------------------------------------
Disclosure: I am part of Trade Nation's Influencer program and receive a monthly fee for using their TradingView charts in my analysis.
💸💸💸💸💸💸
👇 👇 👇 👇 👇 👇

EURO - Price will rise a little and then drop to $1.1500 pointsHi guys, this is my overview for EURUSD, feel free to check it and write your feedback in comments👊
Price earlier carved out a pennant pattern after a strong rally, with price oscillating between converging trendlines and indecision mounting near $1.1550 resistance.
After several weeks in consolidation, sellers finally broke down below the pennant base, sending price back toward the support area and trapping late buyers.
Buyers regrouped and launched a new advance, driving EUR into a well-defined rising channel.
During this channel run, two notable breakouts above interim highs were quickly followed by exits at the upper trendline.
Price now sits in a tight consolidation just under the rising channel’s ceiling near $1.1700, forming small corrective swings on lighter volume.
I expect one more shallow rally toward $1.1750 before sellers overwhelm buyers again, pushing Euro down through $1.1550 and toward the $1.1500 points.
If this post is useful to you, you can support me with like/boost and advice in comments❤️
Disclaimer: As part of ThinkMarkets’ Influencer Program, I am sponsored to share and publish their charts in my analysis.

EURGBP Perfect Channel Up giving one more buy opportunity.Last time we looked at the EURGBP pair (May 30, see chart below) we gave the most timely buy signal right at the bottom (Higher Lows trend-line) of the Bullish Megaphone, and the price is only a few candles away from the 0.87400 Target:
If we look at the price action from a 4H perspective we can see that it is a Channel Up that has been driving the pair upwards since the May 28 bottom and today's rebound is taking place after a direct hit on the 4H MA50 (blue trend-line).
This is the start of the new Bullish Leg. Since the previous two have increased by +1.90%, this rally has the potential to even exceed our 0.87400 Target marginally. Still, this is a perfect bullish set-up.
-------------------------------------------------------------------------------
** Please LIKE 👍, FOLLOW ✅, SHARE 🙌 and COMMENT ✍ if you enjoy this idea! Also share your ideas and charts in the comments section below! This is best way to keep it relevant, support us, keep the content here free and allow the idea to reach as many people as possible. **
-------------------------------------------------------------------------------
Disclosure: I am part of Trade Nation's Influencer program and receive a monthly fee for using their TradingView charts in my analysis.
💸💸💸💸💸💸
👇 👇 👇 👇 👇 👇

HelenP. I Euro will drop more, breaking the support levelHi folks today I'm prepared for you Euro analytics. After analyzing the current structure of the EURUSD chart, I noticed a strong break of the ascending trend line, which had been respected for a long period. The price has now returned to test the broken trend line from below, aligning with the resistance zone between 1.1665 and 1.1700 points. This area used to serve as solid support, but after the breakout, it turned into resistance. The retest from below could become the final confirmation before the pair continues its downward movement. Right now, EUR is trading just inside this resistance zone. There is a small chance the price might move slightly higher to touch the upper boundary of the zone, but overall, the pressure looks bearish. I expect that after a minor bounce, EUR will decline again, breaking below the local support at 1.1665. Once that happens, a larger impulse down could be triggered, targeting even 1.1525 points, which is my main goal for this setup. This bearish scenario is supported by the failed attempts to recover above the trend line and the fact that previous support has already flipped to resistance. If you like my analytics you may support me with your like/comment.❤️
Disclaimer: As part of ThinkMarkets’ Influencer Program, I am sponsored to share and publish their charts in my analysis.

EURO - Price will continue to grow inside rising channelHi guys, this is my overview for EURUSD, feel free to check it and write your feedback in comments👊
Recently, price entered to rising channel, where it soon reached the support level, which coincided with the support area.
After this movement, the price broke this level, but soon turned around and corrected the support line of the channel.
Next, EUR went back to $1.1365 level and broke it again, after which it made a retest and continued to move up.
In a short time, EUR rose to the resistance line of the channel, made a correction, and then grew to $1.1700 support level.
Price broke this level too and reached the resistance line of the channel, but not long ago corrected.
At the moment, I expect that the Euro can correct to the support line of the channel and then rise to $1.1900
If this post is useful to you, you can support me with like/boost and advice in comments❤️
Disclaimer: As part of ThinkMarkets’ Influencer Program, I am sponsored to share and publish their charts in my analysis.
