Fundamental Market Analysis for August 8, 2025 EURUSDThe EUR/USD exchange rate remains stable after rising during the previous three sessions, trading at around 1.1660 during Asian trading hours on Friday. The pair may regain its positions as the US dollar (USD) may struggle as markets assess the probability of a 25 basis point (bp) rate cut at the September meeting at nearly 93%, compared to 48% a week ago.
Expectations for a Fed rate cut in September have intensified as the number of new applications for unemployment benefits in the US increased after the US nonfarm payrolls (NFP) report for July pointed to a cooling labor market.
Data on initial jobless claims in the US showed that the number of US citizens filing new claims for unemployment benefits rose to 226,000 for the week ending August 2. This figure exceeded the market consensus forecast of 221,000 and was higher than the previous week's figure of 218,000.
The probability that the central bank will leave rates unchanged is approximately 87%. Markets estimate the probability of another ECB rate cut before March 2026 at only 60%.
Trade recommendation: BUY 1.1660, SL 1.1625, TP 1.1710
Euro-dollar

EURUSD Current Market Situation Technical Analysis Current Market Situation
The chart displays a Double Top pattern, a strong bearish reversal signal that often indicates the start of a downward move.
The price has already broken the neckline, and it is now approaching a retest of both the neckline and the broken trendline, which serves as a critical resistance area for potential bearish continuation.
Key Zones
Neckline Retest Zone: Around 1.1600, acting as immediate resistance.
Trendline Retest Zone: Between 1.1670 – 1.1700, serving as an additional resistance level to confirm the bearish bias.
Potential Scenarios
✅ Bearish Scenario (Preferred):
If price respects the retest zones and fails to break higher, we may see a decline toward:
Target 1: 1.1500
Target 2: 1.1400
Target 3: 1.1300
⚠ Bullish Scenario (Alternative):
A clear breakout and daily close above 1.1700 would invalidate the bearish outlook and could lead to a bullish reversal.
Conclusion
The market structure currently favors the bears.
Rejection from the neckline or trendline retest zones will provide a strong confirmation for sell positions.
⚠️ Trade at your own risk – We are not responsible for any losses.

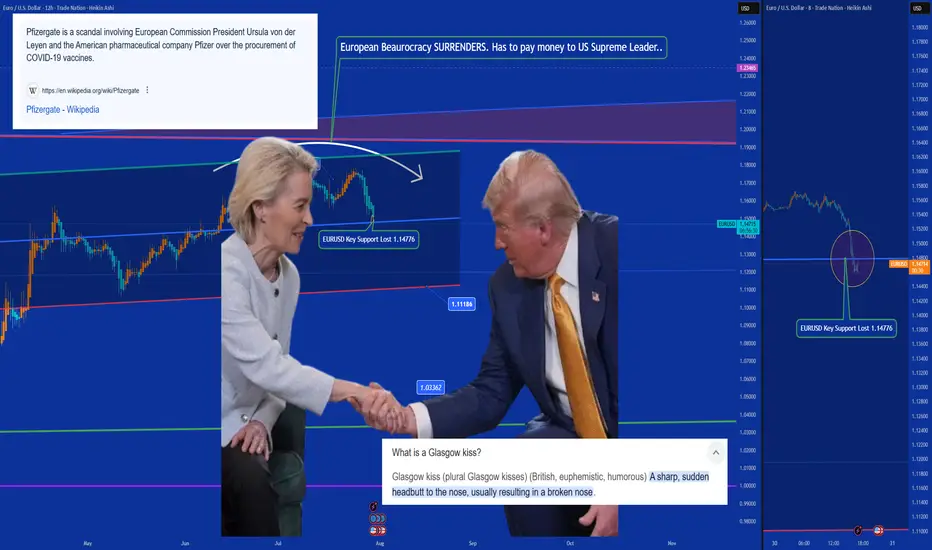
Ursulization = Bureaucracy > Democracy (a.k.a. The Glasgow Kiss)🤝💥 Ursulization – Bureaucracy Replaces Democracy (a.k.a. The Glasgow Kiss) 🇺🇸🇪🇺
📍Background:
The media spun it as a "15% tariff agreement"…
But in reality, this wasn’t diplomacy — it was a disguised capitulation.
And the stage? None other than Scotland, ancestral ground of Donald J. Trump.
So when Ursula von der Leyen came seeking a gentle diplomatic handshake…
What she received instead was the infamous Glasgow Kiss — sudden, sharp, and unmissable.
💥 What’s a Glasgow Kiss?
A British slang term for a violent headbutt to the face —
No grace. No warning. Just raw force.
💬 The Real Story:
Ursula von der Leyen — unelected, unaccountable —
signed off on $1.4 trillion in U.S.-bound capital flows:
💸 $750B to buy American energy
🛠 $600B in U.S. infrastructure, defense & industry
All to sidestep 50% tariffs the Trump team had ready to roll.
But here's the kicker:
She wasn’t acting on behalf of European citizens.
She was speaking for the bureaucracy, not the people.
🔥 Welcome to Ursulization:
Where democracy is sidelined by unelected power.
Where negotiations happen in silence.
Where scandals like PfizerGate get buried while the euro breaks down.
📉 EUR/USD just lost key support at 1.14776 —
The chart shows t he cost of surrender.
💉 PfizerGate Reminder:
Ursula already faced heat for secretive vaccine contracts with Pfizer.
Now, she’s handing over Europe’s industrial backbone —
To Trump. In Scotland. With no public mandate.
📌 Conclusion:
Trump didn’t compromise — he collided.
Europe didn’t resist — it surrendered.
This wasn’t diplomacy.
It was a Glasgow Kiss — a collision between legitimacy and bureaucratic power.
👑 One elected by the people (Trump). One not elected at all (Woke agenda style Ursula).
💰 One walks away with trillions (Trump). The other, with silence (Ursula 'Von der Pfizinen never electenen'').
One Love,
The FXPROFESSOR 💙
ps. Till we can bring Democracy and Europe back.
Disclosure: I am happy to be part of the Trade Nation's Influencer program and receive a monthly fee for using their TradingView charts in my analysis. Awesome broker, where the trader really comes first! 🌟🤝📈
The euro extends sharp losses following the US-EU tariff deal
The euro weakened sharply against the dollar amid views that the US-EU tariff deal favors the US. European leaders voiced mixed reactions. Germany’s Chancellor Merz welcomed the agreement as a safeguard against economic damage, while Hungary’s PM Orbán criticized it as a one-sided win for the US. Meanwhile, the IMF raised its eurozone growth forecast from 0.8% to 1.0% in its July outlook, citing the lower-than-expected tariff levels as supportive of the region’s economy.
EURUSD broke below the ascending trendline and briefly tested the support at 1.1520. EMA21 has death-crossed EMA78, indicating the potential extension of bearish momentum.
If EURUSD fails to hold above the support at 1.1520, the price could decline further toward 1.1450. Conversely, if EURUSD breaches above the resistance at 1.1590, the price may gain upward momentum toward 1.1640.

Opportunities Arise from Dollar WeaknessSince the dollar peaked in 2022, it has declined by 24%.
Such a decline may not seem significant for a stock, it’s a different story when it comes to currencies, especially a reserve currency for USD. US purchasing power has dropped by a quarter, meaning they will now have to pay 24% more for imports from EU.
However, the decline in the USD also presents opportunities in other markets.
Mirco EUR/USD Futures
Ticker: M6E
Minimum fluctuation:
0.0001 per euro = $1.25
Disclaimer:
• What presented here is not a recommendation, please consult your licensed broker.
• Our mission is to create lateral thinking skills for every investor and trader, knowing when to take a calculated risk with market uncertainty and a bolder risk when opportunity arises.
CME Real-time Market Data help identify trading set-ups in real-time and express my market views. If you have futures in your trading portfolio, you can check out on CME Group data plans available that suit your trading needs www.tradingview.com

EUR/USD: Euro Pops Above $1.16 in Four-Year High. What’s Next?The dollar wobbles, Trump talks tariffs, and the euro’s got its dancing shoes on.
The Euro Wakes Up, Stretching Its Legs at $1.16
Look who just rolled out of bed and decided to make a scene.
For the first time in four years, the euro has finally leapt out of its slumber and sprinted to $1.16 — all at the expense of the US dollar, which continues to shed value.
The FX:EURUSD isn’t just crawling higher. It’s flexing, fueled by dollar fatigue, political drama, and some very European stubbornness.
So what’s behind the move? Why is the euro soaring while the European Central Bank is actually cutting rates? And what’s the dollar doing? Let's unpack it all — one central bank, one tweet, and one inflation print at a time.
Trump’s Tariff Ping-Pong: Back On, Back Off
Let’s start with the one thing that never quite leaves the headlines: Trump’s trade policy.
Just when traders were catching their breath after some tariff reprieve on China, the market got pulled back into the mess. “WE ARE GETTING A TOTAL OF 55% TARIFFS, CHINA IS GETTING 10%. RELATIONSHIP IS EXCELLENT,” Trump posted on Truth Social late on Wednesday, reigniting fears that the trade war is getting heated up again. Especially after a US squad of negotiators touched down in London and walked away with some promising news .
Markets don’t love confusion. Investors especially don’t love a US trade policy that changes faster than the Nasdaq NASDAQ:IXIC during CPI week. This kind of noise erodes confidence in US economic leadership and — more importantly — in the dollar.
The world’s most important currency is starting to feel… less important, less relevant, and less reliable. And while it’s not collapsing, it’s definitely catching fewer friends at the FX party.
On the other side of the pond, the euro isn’t rising because Europe is crushing it (even though it’s doing pretty well against rival currencies, just check the forex heatmap ) — it’s rising because the dollar is slipping off its pedestal. So yes, the euro’s up. But this isn’t a standing ovation for Europe — it’s more of a polite shrug away from America.
US Inflation Creeps Higher — And That Means a Cut?
US inflation picked up to 2.4% in May but still left the door open for a cut by the Federal Reserve.
So what does the market do? It prices in a cut.
Lower rates mean lower yields on Treasuries, which means less incentive for global investors to hold dollars. And when the yield game turns dull, guess what gets more attention? Gold OANDA:XAUUSD — because if your asset doesn’t yield anything, at least let it be shiny.
ECB Cuts Again, and the Euro Still Rises?
Now here’s the riddle. The ECB last week cut its benchmark rate to 2% , hitting a two-year low. By all textbook logic, a rate cut should weaken the local currency.
Here’s why it’s rising instead:
Markets are forward-looking . The rate cut was expected and already priced in. What matters now is whether more cuts are coming (spoiler: not too many). Traders are betting the ECB is nearing the end of its easing cycle — and may turn neutral soon.
The Fed looks more dovish . Rate differentials still matter. Even if the ECB is cutting, the Fed is expected to cut more over the next 12 months. That narrows the gap between euro and dollar yields, making the euro more attractive in relative terms.
Eurozone data isn’t great — but it’s not falling apart either. While growth in the eurozone isn’t setting any records, it’s been just OK to support the currency. Inflation is cooling in line with ECB targets, unemployment remains low, and key sectors like manufacturing are showing signs of life.
Put it all together and you get a euro that’s rising despite rate cuts — a phenomenon that would make FX professors tear their hair out, but makes perfect sense when you zoom out.
Technicals: This Isn’t a Flash in the Pan
From a chartist’s perspective, the FX:EURUSD breakout above $1.16 was a big deal. That level had acted as resistance since November 2021. Now cleared, a flurry of algo buys and retail FOMO might fuel the next leg in either direction.
From the bulls’ perspective, momentum is picking up, and the euro looks poised to test $1.17–$1.18 if the dollar stays fragile (that said, keep your eye on any hot news coming out of the economic calendar ). RSI is not yet flashing overbought, and MACD is still screaming “more grounds to cover.”
Question is: How long can the euro dance before the music changes? And we’re asking you — share your thoughts on the euro-dollar pair and let’s see who gets it right!

SHORT ON EUR/USDEUR/USD has just swept a previous high and has plenty of liquidity to the downside to capture.
I will be selling EU to the next swing low looking to catch 80-100 pips.

SHORT ON EUR/USDEUR/USD has pulled back to a major supply zone that previously formed a DOUBLE TOP in that area in the past. (This is technically the re-test)
I have placed a sell limit order in the supply area and I will be expecting EUR/USD to fall past the swing low for over 100 -150 pips.

Digital Euro: Separating Fact from Conspiracy TheoriesIn today’s fast-paced digital landscape, misinformation can spread rapidly and mislead even those well-intentioned readers. With the Digital Euro project circulating online, numerous pieces of fake news have surfaced—not just criticism or differing opinions, but outright falsehoods that may convince citizens, especially those less familiar with financial innovations, that the project is something it is not. In this article, we delve into the most common misconceptions and explain with clarity and factual context why these claims do not correspond with reality.
1. Myth: "The Digital Euro Will Replace Cash"
❌ False. Despite alarming headlines, cash will not vanish. The Digital Euro is poised to become an additional payment option alongside physical money. The Eurosystem is committed to ensuring that banknotes and coins remain accessible. In fact, plans are already underway to introduce new series of euro banknotes, reaffirming the continued value of cash in our daily transactions.
2. Myth: "The ECB Will Be Able to Control and Block Your Payments"
❌ False. Privacy is a cornerstone of the Digital Euro. Similar to the way cash transactions operate, offline payments would be possible without any tracking by the Eurosystem. This means that your personal transactions remain private and free from arbitrary interference. The design of the digital euro ensures that your financial autonomy is preserved.
3. Myth: "There Will Be Arbitrary Limits on How Much Digital Euro Can Be Held"
❌ False. Any limits imposed on holding digital euros would not be arbitrary measures of control but rather tools to safeguard financial stability. Such thresholds are considered from the perspective of systemic security—not the curtailment of individual freedom. The focus is on ensuring that the financial ecosystem remains resilient rather than monitoring or constraining individual spending.
4. Myth: "The Digital Euro Is a Way to Introduce Negative Interest Rates on Deposits"
❌ False. The digital euro is designed to mirror cash in its fundamental properties—namely, being interest-free. It is not a mechanism for financial authorities to impose negative interest rates on personal funds. The purpose is to complement traditional cash by offering a modern payment solution without altering the neutrality of money.
5. Myth: "It Will Be Mandatory to Use the Digital Euro"
❌ False. Use of the digital euro is entirely optional, serving as one out of many available payment instruments. Just as consumers choose between cash, credit cards, or other digital means, the digital euro is simply an additional tool. No regulation compels you to adopt this innovation if you prefer your existing methods.
6. Myth: "Banks Will Lose All Their Role"
❌ False. The introduction of the digital euro will not render banks obsolete. Banks will continue to provide essential financial services, acting as intermediaries and offering the digital euro alongside other products. The evolution of the payment system enhances consumer choice without dismantling the traditional banking framework.
7. Myth: "The Digital Euro Will Be Programmable, So They Will Tell You How to Spend Your Money"
❌ False. The concept of programmability—that is, dictating how funds are spent—has been explicitly ruled out by the ECB. Both proposals from the European Commission and the legislative frameworks confirm that the digital euro will not be programmable. The goal is to maintain financial freedom and user discretion, similar to how cash operates.
8. Myth: "It's a Project to Eliminate Cryptocurrencies"
❌ False. Rather than extinguishing cryptoassets, the Digital Euro is designed to coexist alongside them. While cryptocurrencies are often speculative and volatile, the digital euro aims to offer a more stable and secure means of payment. The two are intended to serve different purposes: cryptoassets are generally considered investment or speculative instruments, whereas the Digital Euro would fulfill everyday transactional needs.
9. Myth: "There Will Be No More Privacy in Payments"
❌ False. Privacy in the digital age remains a top priority. Offline transactions with the Digital Euro will mirror the privacy features of cash, shielding your personal data. For online transactions, robust privacy regimes are in place. Importantly, the issuer—the Eurosystem—will not have the ability to directly connect transactions to specific individuals, ensuring that your financial privacy is maintained.
Conclusion
The Digital Euro is not the harbinger of a new era of financial surveillance or control. Instead, it represents an additional, modern means of payment designed to coexist with traditional cash and current banking services . By dispelling these myths, we hope to foster a clearer understanding of the Digital Euro project and promote informed discussions based on official facts.
Embracing accurate information is crucial to navigating the ever-changing world of digital finance, ensuring that choices are made based on facts rather than fictions.
FX_IDC:EURUSD TVC:DXY TVC:EXY INDEX:BTCUSD CRYPTO:BTCUSD TVC:SPX EUREX:FESX1! EURONEXT:N100 AMEX:FXE TVC:GOLD FX_IDC:XAUUSD

SHORT ON EUR/USDEUR/USD has finally given a change of character to the downside and is currently pulling back into a supply area.
The dollar is gaining strength due to Tariffs and looks like it will rise.
I will be selling EUR/USD with a sell limit order looking to catch over 200-300 pips over the next few days.

ICT Concepts for FX and GOLD traders: 2025 edition🔍 ICT (Inner Circle Trader) is a trading methodology developed by Michael J. Huddleston. It focuses on market structure, smart money concepts (SMC), and how institutions manipulate liquidity to trap retail traders.
📚 It's not about indicators or over-complication — it's about reading the price action like a pro, understanding where liquidity is, and trading with the banks, not against them.
📐 1. Market Structure
Understand Highs & Lows: Identify break of structure (BOS) and change of character (CHOCH)
Follow the macro to micro flow: D1 > H4 > M15 for precision entries
🧱 2. Order Blocks (OBs)
An order block is the last bullish or bearish candle before a major price move.
Banks and institutions place large orders here.
Smart traders look for price to return to these areas (mitigation), then enter with tight stop losses.
👉 Think of OBs as institutional footprints on the chart.
💧 3. Liquidity Zones
Equal highs/lows, trendline touches, support/resistance — these are liquidity traps.
ICT teaches that price often hunts liquidity before reversing. That’s why many retail traders get stopped out.
Learn to trade into liquidity, not off it.
🔄 4. Fair Value Gaps (FVGs)
Also called imbalances — when price moves too fast and leaves gaps.
Price often retraces to "fill the gap" — a key entry point for ICT traders.
🥇 ICT for Gold & Forex in 2025
💰 Why It Works for XAUUSD & Majors:
Gold is a highly manipulated asset, perfect for ICT-style trading.
It responds beautifully to liquidity grabs, order blocks, and Asian–London–New York session transitions.
Forex majors (EUR/USD, GBP/USD, etc.) are also ideal since they’re heavily influenced by institutional flow and news-driven liquidity hunts.
🕐 Timing Is Everything
Trade Killzones:
📍 London Killzone: 2AM–5AM EST
📍 New York Killzone: 7AM–10AM EST
These are high-volume sessions where institutions make their moves.
📈 Typical ICT Setup
▪️Spot liquidity zone above or below recent price
▪️Wait for liquidity sweep (stop hunt)
▪️Identify nearby order block or FVG
▪️Enter on a pullback into OB/FVG
▪️Set tight SL just past the recent swing
Target internal range, opposing OB, or next liquidity level
👨💻 Why FX/GOLD Traders Love ICT
✅ It’s clean, no indicators, and highly logical
✅ Great for part-time trading — 1 or 2 trades a day
✅ Feels like "leveling up" your understanding of the market
✅ Perfect for backtesting and journaling on platforms like TradingView or SmartCharts
✅ Easy to integrate into algo-based systems or EAs for semi-automation
If you’re tired of indicators and guessing, and want to trade like the institutions, ICT is a game changer. In 2025, more prop firms and traders are applying ICT concepts to dominate markets like gold, forex, and even crypto.
🧭 Master the method. Understand the logic. Ride with the smart money.
🔥 Welcome to the next level of trading.

Eur/Usd Mar/24 Weekly analyzeHello eveyone.
Price reject at W200 ma for 2 weeks and Closed below W 200 MA also this w open below W pivot so i'm gonna sell for this week
..............................
( This is an idea and entry-tp-sl placed for my own trade , you can change entry-tp-sl depends on your risk management )

Eurozone Spending Plans Boost EuroThe euro surged past $1.09, its highest in four months, gaining 5% since early March. This rally was driven by Eurozone plans to expand deficit spending, stimulating growth prospects. Germany pushed for a €500 billion infrastructure fund, while France and Italy supported joint EU funding for economic and military initiatives.
The ECB signaled a shift toward a less restrictive policy after last week’s rate cut, suggesting the easing cycle may be nearing its end. Meanwhile, US economic concerns pressured the dollar, further lifting the euro.
Key resistance is at 1.0950, followed by 1.1000 and 1.1050. Support stands at 1.0800, with further levels at 1.0730 and 1.0650.

EurUsd ShortEUR/USD Short Idea
The EUR/USD pair is approaching the 1.09700--1.09940--1.10204 resistance level, which aligns with a significant supply zone and a potential area for bearish reversal.
Key Analysis:
Resistance Zone:
The 1.09700--1.09940--1.10204 levels marks a critical resistance where selling pressure has previously emerged.
Technical Indicators:
RSI is approaching overbought conditions, indicating limited upside potential.
Bearish divergence may form if momentum weakens near this level.
Fundamental Context:
A stronger USD due to hawkish Fed sentiment or economic data could pressure EUR/USD downward.
Eurozone economic uncertainties may add to bearish bias.
Entry: Short positions around 1.09700--1.09940--1.10204
This setup offers a favorable risk-reward opportunity in a high-probability reversal zone.

Fundamental Market Analysis for February 28, 2025 EURUSDEUR/USD remains under selling pressure near 1.0390 during Asian trading on Friday. The euro (EUR) is weakening against the US dollar (USD) amid risk-off sentiment. The US Personal Consumption Expenditure (PCE) price index will take centre stage later on Friday.
Late Thursday, US President Donald Trump said that 25 per cent duties on imports from Canada and Mexico will take effect on March 4, rather than April 2 as he had anticipated the day before. Trump also said goods from China would be subject to an additional 10 per cent duties. He also promised this week to impose 25 per cent tariffs on shipments from the European Union. Tariff uncertainty from Trump is likely to weigh on the common currency in the near term.
Cleveland Fed President Beth Hammack said on Thursday she expects the US central bank's interest rate policy to be put on hold for now amid a search for evidence that inflationary pressures are easing and returning to the 2 per cent target. Meanwhile, Atlanta FRB President Raphael Bostic said late Wednesday that the Fed should keep interest rates on hold, which continues to put downward pressure on inflation. The Fed's cautious stance could boost the US Dollar and serve as a headwind for EUR/USD.
Trade recommendation: SELL 1.0380, SL 1.0430, TP 1.0300

Fundamental Market Analysis for February 19, 2025 EURUSDU.S. President Donald Trump said late Tuesday that he would likely impose tariffs on imports of cars, semiconductors and pharmaceuticals of about 25%, with an announcement to follow as early as 2 April.
Ukrainian President Volodymyr Zelensky said a peace deal could not yet be concluded. He postponed his visit to Saudi Arabia, scheduled for Wednesday, until 10 March to avoid giving ‘legitimacy’ to the US-Russia talks. This uncertainty could lift the US dollar and serve as a tailwind for the pair.
Investors are awaiting the release of the minutes of the January FOMC meeting, which are due to be released later on Wednesday. This report could provide some clues as to how policymakers assess the risk of a global trade war.
On the other side of the pond, the ZEW Eurozone Economic Sentiment Index came in at 24.2 in February versus 18.0 previously, missing expectations. Rising bets that the European Central Bank (ECB) will cut interest rates three more times this year could put pressure on the Euro (EUR).
Trade recommendation: SELL 1.0450, SL 1.0500, TP 1.0350

Fed Talk Lifts Dollar, EUR/USD Under PressureEUR/USD hovers around 1.0455, while the dollar index rebounded to 107 on Tuesday, snapping a three-day losing streak. The recovery followed remarks from Federal Reserve officials signaling a pause in rate cuts to focus on inflation control. Fed Governor Christopher Waller suggested holding off on cuts unless inflation trends match 2024 levels, while Governor Michelle Bowman stressed the need for more evidence before easing policy. Philadelphia Fed President Patrick Harker also supported maintaining current rates amid economic strength.
Markets now await this week’s FOMC minutes for further rate guidance. Last week, the dollar weakened due to mixed US economic data and reduced tariff concerns. Treasury Secretary Scott Bessent noted that currency manipulation is now a key factor in trade strategy.
Technically, resistance stands at 1.0515, with further barriers at 1.0600 and 1.0650. Support lies at 1.0350, followed by 1.0275 and 1.0220.

Dollar Weakens as Trade Tensions EaseEUR/USD is hovering around 1.0460 on Friday morning, while the dollar index remains near 107, poised for a 1% weekly decline. The drop is driven by easing trade tensions and expectations of a softer personal consumption expenditures (PCE) price index later this month. The dollar weakened 0.8% on Thursday after President Trump directed his administration to explore reciprocal tariffs on countries with unfair trade practices. However, since these tariffs are not expected immediately, concerns over retaliation and inflation eased, reducing uncertainty around the Fed's ability to lower borrowing costs.
Meanwhile, producer inflation data exceeded expectations, following strong consumer inflation figures from the previous day. Despite this, components of the report suggest that core PCE inflation, the Fed's key focus, may come in lower than anticipated.
Technically, 1.0460 is the first resistance level, with further barriers at 1.0515 and 1.0600 if the pair moves higher. On the downside, initial support is at 1.0350, followed by 1.0275 and 1.0220.

Euro Gains Ground on Ukraine Peace TalksThe EUR/USD traded at $1.04 on Thursday, gaining 0.1% for the day after rebounding from earlier declines. The euro found support amid optimism over a potential peace agreement between Ukraine and Russia, spurred by encouraging progress in diplomatic discussions. Despite rising U.S. Treasury yields strengthening the dollar, the euro remained steady.
U.S. inflation data exceeded expectations, tempering hopes for Federal Reserve rate cuts. While the dollar stays relatively strong, the euro’s stability suggests it could hold firm against the greenback. Moving forward, U.S. monetary policy and geopolitical events will be key factors influencing EUR/USD.
From a technical standpoint, the first resistance level is at 1.0460, with further resistance at 1.0515 and 1.0600 if the price breaks higher. On the downside, initial support is at 1.0350, followed by additional levels at 1.0275 and 1.0220.

EUR/USD Steady as Markets Await Key US Inflation ReportEUR/USD trades near 1.0450, with the dollar index steady at 108 on Wednesday, as markets await a key inflation report. January CPI is expected to show core inflation rising to 0.3% from 0.2% MoM, while annual inflation may ease to 3.1% from 3.2%. Fed Chair Powell told Congress the Fed isn’t rushing to cut rates, citing economic strength and inflation risks. He warned that premature easing could stall inflation progress, while delays could harm growth. Markets also assess the impact of Trump’s latest tariff hike.
From a technical perspective, the first resistance level is at 1.0400, with further resistance levels at 1.0460 and 1.0515 if the price breaks above. On the downside, the initial support is at 1.0275, followed by additional support levels at 1.0220 and 1.0180.

Eur/Usd Sup/ResEur/Usd Break Res...I think it's clear enough in chart...so let's see
will share trade entry later
( any 4H close below 1.03360 means sup not working.. )

Fundamental Market Analysis for february 3, 2025 EURUSDEUR/USD was subjected to heavy selling on Monday and fell towards 1.0200 early in the Asian session. Spot prices have returned to more than two-year lows reached in January and look set to continue their multi-month downtrend.
The US Dollar (USD) is rising across the board in response to US President Donald Trump's decision over the weekend to impose 25 per cent duties against Canada and Mexico, as well as an additional 10 per cent against China. This marks the start of a new global trade war and has curbed investor appetite for risky assets. The flow of anti-risk sentiment is putting good pressure on the safe-haven quid, which is becoming a key factor putting downward pressure on EUR/USD.
Meanwhile, on Friday evening, Trump announced that he will impose tariffs on goods from the European Union. This comes amid the European Central Bank's (ECB) stance, which continues to undermine the common currency. As expected, the ECB cut borrowing costs by 25 basis points (bps) last Thursday and left the door open for further rate cuts before the end of this year.
This is a significant divergence from the Federal Reserve's (Fed) pause, which favours dollar bulls and supports the prospects for further EUR/USD declines. Meanwhile, the recent sharp pullback in US Treasury yields acts as a headwind for the quid and may provide some support to spot prices. Nevertheless, the fundamental backdrop suggests that the path of least resistance for spot prices is to the downside.
Trade recommendation: Trading mainly with Sell orders from the current price level.

EUR/USD SHORTEUR?USD is likely to continue down further to support zones such as 1.03397 1.02612 1.01789 with strong USD news coming later it is advisable to enter trade at pivot 1.04096.
