AUDUSD at resistance level for short trade.AUDUSD is trading at resistance level (as shown in chart). it is very strong resistance level . According to chart pattern analysis, we might see down side in AUDUSD from current level. One can initiate the short trade with risk management and stop loss.
Thank You
Vivek S.
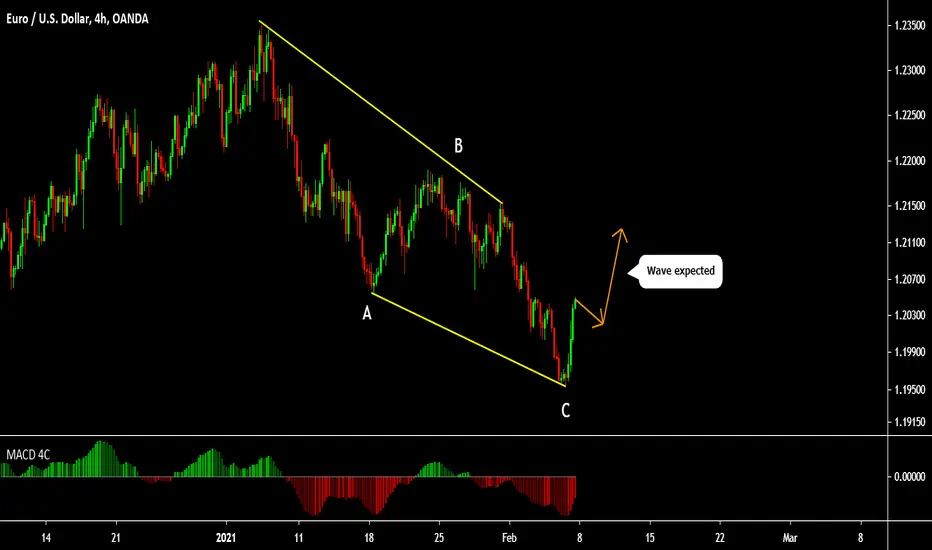
Euro-dollar

EURUSD IDEAConfluences:
- Reverse head and shoulders pattern has been fully formed
- General downtrend on the monthly timeframe
- Expecting a bearish engulfing candle to form to signal the start of a downtrend


EUR-USD Breakout! Will Go UP From SUPPORT! Buy!
Hello, Traders!
EUR-USD broke the horizontal resistance level
And Is now trading above it which makes me bullish
I think that we will see bullish continuation after possible pullback
To retest the new support
The final target is the key level at 1.217
BUY!
Like, comment and subscribe to boost your trading!
See other ideas below too!

💡 Don't miss the great buy opportunity in EURUSDTrading suggestion:
. There is a possibility of temporary retracement to suggested support line (1.208). if so, traders can set orders based on Price Action and expect to reach short-term targets.
Technical analysis:
. EURUSD is in a range bound and the beginning of uptrend is expected.
.The price is above the 21-Day WEMA which acts as a dynamic support.
. The RSI is at 70.
Take Profits:
TP1= @ 1.2155
TP2= @ 1.2190
TP3= @ 1.2225
SL= Break below S2
❤️ If you find this helpful and want more FREE forecasts in TradingView
. . . . . Please show your support back,
. . . . . . . . Hit the 👍 LIKE button,
. . . . . . . . . . . Drop some feedback below in the comment!
❤️ Your Support is very much 🙏 appreciated! ❤️
💎 Want us to help you become a better Forex trader ?
Now, It's your turn !
Be sure to leave a comment let us know how do you see this opportunity and forecast.
Trade well, ❤️
ForecastCity English Support Team ❤️

What I'd love to see on EURUSD!Also due to the dollar's weakness lately, EURUSD has been experiencing some growth. If it gets to my trendline, i should short with proper confirmation. Till then, lets see

🏛EUR_USD↗️ LONG TRADING PLAN🎥
☑️In this Video I Explain what happened with EUR_USD
And Give you a Trading Plan For this pair!
Thank you for watching, as always!😸
✅Like and subscribe to never miss a new idea!✅

EUR USD BUY (EURO - US DOLLAR)Hi there. Price is moving impulsively to the upside.
Wait for the price to form a continuation pattern and watch strong price action for buy.

EUR-USD Will Fall From Resistance! Sell!
Hello, Traders!
EUR-USD broke the horizontal support and fell epically
Now, we are seeing a pullback from a minor support
And a retest of the broken support that is now a resistance level
Therefore, I suggest a short trade once the pair reaches the resistance level
Sell!
Like, comment and subscribe to boost your trading!
See other ideas below too!

💡 Don't miss the great sell opportunity in EURUSDTrading suggestion:
. There is still a possibility of temporary retracement to suggested resistance line (1.2015). if so, traders can set orders based on Price Action and expect to reach short-term targets.
Technical analysis:
. EURUSD is in a range bound and the beginning of downtrend is expected.
. The price is below the 21-Day WEMA which acts as a dynamic resistance.
. The RSI is at 25.
Take Profits:
TP1= @ 1.1950
TP2= @ 1.1900
TP3= @ 1.1835
TP4= @ 1.1760
TP5= @ 1.1625
SL: Break Above R2
❤️ If you find this helpful and want more FREE forecasts in TradingView
. . . . . Please show your support back,
. . . . . . . . Hit the 👍 LIKE button,
. . . . . . . . . . . Drop some feedback below in the comment!
❤️ Your Support is very much 🙏 appreciated! ❤️
💎 Want us to help you become a better Forex trader?
Now, It's your turn!
Be sure to leave a comment let us know how do you see this opportunity and forecast.
Trade well, ❤️
ForecastCity English Support Team ❤️

EUR-USD Two Potential Reversal Points!BUY!
Hello, Traders!
EUR-USD broke horizontal support level conclusively
And is now trading below this resistance
However, the closest support level is right below
Therefore, there is a good chance to see a pullback
And retest of the broken level
However, if this support gets broken,
The next strong support area is around 1.19000
And, if reached, I expect a surge from it.
BUY!
Like, comment and subscribe to boost your trading!
See other ideas below too!

EURUSD: Where are We Going? Price Action Analysis
EURUSD is currently stuck within an expanding triangle formation on 4H.
Its lower boundary is based on a major horizontal daily/4h support.
Its upper boundary is based on a strong 4H rising trend line.
The breakout of its boundaries will clarify the future long term direction of the market.
If we see a bear breakout of horizontal support,
it will most likely lead to a start of a long term bearish trend on a pair.
If we see a bullish breakout of its trend line, bullish continuation will most likely follow.
For intraday trading, both boundaries can be considered.
Please, support this idea with like and comment. Thank you


EUR-USD Between Two Levels What To Do? Wait!
EUR-USD is stuck between two horizontal level
Support and Resistance
Adventurous traders might wanna trade the pair between the levels
Shorting from resistance and buying from support
But THE trade will come when one of the levels gets broken
Given that the pair is generally in the Uptrend
And given that the support is still unbroken
I lean towards the bullish scenario
But we don't trade it until we see a breakout
One way or the other and enter the trade in the direction of the breakout
WAIT!
Like, comment and subscribe to boost your trading!
See other ideas below too!

EUR-USD Bear Flag Will Fall!Sell!
Hello,Traders!
EUR-USD is trading in a bear flag pattern
And we saw a breakout happen today
Which is a bearish signal
And I expect the pair to go further down
With 3 targets in sight
SELL!
Like, comment and subscribe to boost your trading!
See other ideas below too!

EURUSD: Update & Technical Outlook
Daily/4h time frame analysis on EURUSD.
Price action & potential scenarios.
Trading recommendations.
Please, support this video with like and comment!

💡 Don't miss the great sell opportunity in EURUSDTrading suggestion:
. There is still a possibility of temporary retracement to suggested resistance line (1.2165). if so, traders can set orders based on Price Action and expect to reach short-term targets.
Technical analysis:
. EURUSD is in a range bound and the beginning of downtrend is expected.
. The price is below the 21-Day WEMA which acts as a dynamic resistance.
. The RSI is at 40.
Take Profits:
TP1= @ 1.2115
TP2= @ 1.2100
TP3= @ 1.2055
SL: Break Above R2
❤️ If you find this helpful and want more FREE forecasts in TradingView
. . . . . Please show your support back,
. . . . . . . . Hit the 👍 LIKE button,
. . . . . . . . . . . Drop some feedback below in the comment!
❤️ Your Support is very much 🙏 appreciated! ❤️
💎 Want us to help you become a better Forex trader?
Now, It's your turn!
Be sure to leave a comment let us know how do you see this opportunity and forecast.
Trade well, ❤️
ForecastCity English Support Team ❤️

EURUSD: Still Bullish BUT ...
As I have predicted earlier, EURUSD has successfully bounced from 1.206 horizontal structure support.
This week the price has set a nice local bullish trend on 4H with a higher low and two higher highs.
I remain bullish biased and expect more growth, HOWEVER:
Now we see a completed harmonic abcd pattern formation.
For next week there are two potential scenarios:
1) The price may retrace from D point of ABCD and only then continue growing
or
2) The price may just continue growing to new highs
Safe option is always to wait for a pullback first.

EURUSD to bottom of range or lower. 7.66/1 RRHere is what I am seeing on EURUSD. While price could very well turn around me and reverse past it's short term highs it appears that there is a lot absorption of higher prices (lower lows) during this consolidation period which gives me confidence in my position and allows for a nice risk to reward. Furthermore, the exchange quote for the Euro Dollar has become quite extended on the back of stimulus news every other week, now that Stimulus and US elections are settled higher prices will likely continue to be sold with ease. My first target is a 1.8/1 second target is 3.85/1 and my swing target is 7.66/1

EUR USD SELL (EURO - US DOLLAR)Hi there. Price is forming a continuation pattern to the downside.
Watch strong price action at the current levels for sell.
