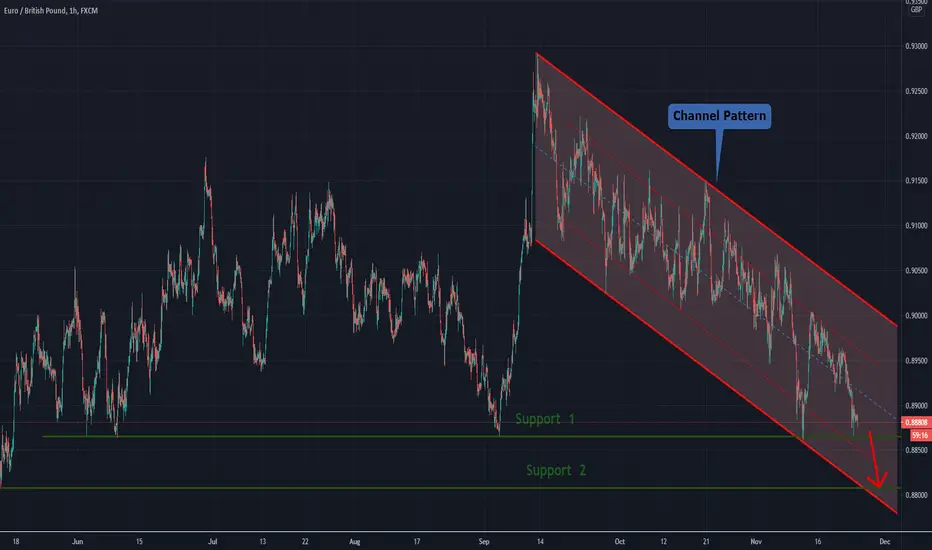
EURGBP At Breakout of Support For Short Trade.EURGBP is trading at s Support Level also it is trading at Support Level of Channel Pattern (shown in chart). According to chart pattern analysis , we might see downside in EURGBP from current level if it break the support 1. One can initiate the short trade with proper risk management and stop loss.
Thank You.
Euro-dollar
💡 Don't miss the great sell opportunity in EURUSDTrading suggestion:
. There is still a possibility of temporary retracement to suggested resistance line (1.1876). if so, traders can set orders based on Price Action and expect to reach short-term targets.
Technical analysis:
. EURUSD is in a range bound and the beginning of downtrend is expected.
.The price is above the 21-Day WEMA which acts as a dynamic support.
. The RSI is at 34.
Take Profits:
TP1= @ 1.1800
TP2= @ 1.1760
TP3= @ 1.1703
TP4= @ 1.1650
TP5= @ 1.1603
SL: Break Above R2
❤️ If you find this helpful and want more FREE forecasts in TradingView
. . . . . Please show your support back,
. . . . . . . . Hit the 👍 LIKE button,
. . . . . . . . . . . Drop some feedback below in the comment!
❤️ Your Support is very much 🙏 appreciated! ❤️
💎 Want us to help you become a better Forex trader?
Now, It's your turn!
Be sure to leave a comment let us know how do you see this opportunity and forecast.
Trade well, ❤️
ForecastCity English Support Team ❤️


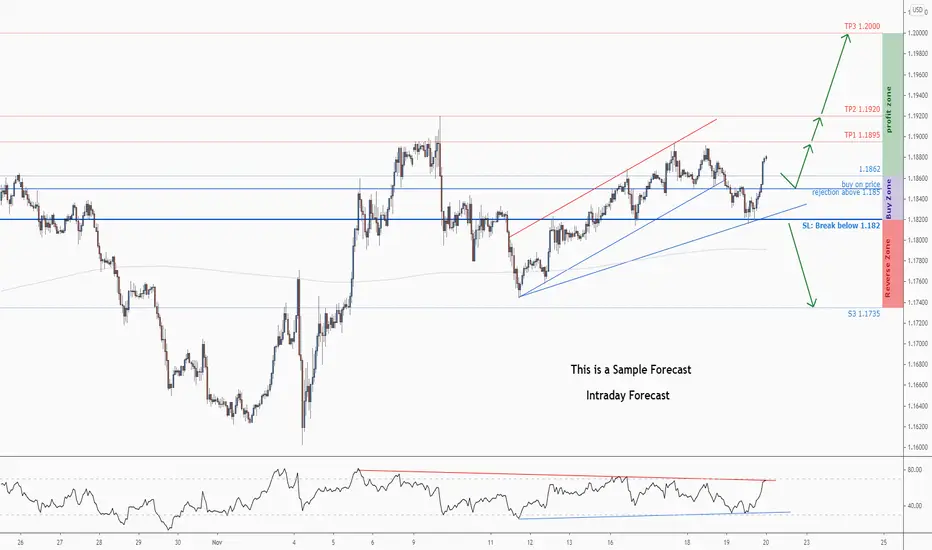
💡 Don't miss the great buy opportunity in EURUSDTrading suggestion:
. There is a possibility of temporary retracement to suggested support line (1.185). if so, traders can set orders based on Price Action and expect to reach short-term targets.
Technical analysis:
. EURUSD is in a range bound and the beginning of uptrend is expected.
.The price is above the 21-Day WEMA which acts as a dynamic support.
. The RSI is at 67.
Take Profits:
TP1= @ 1.1895
TP2= @ 1.1920
TP3= @ 1.2000
SL= Break below S2
❤️ If you find this helpful and want more FREE forecasts in TradingView
. . . . . Please show your support back,
. . . . . . . . Hit the 👍 LIKE button,
. . . . . . . . . . . Drop some feedback below in the comment!
❤️ Your Support is very much 🙏 appreciated! ❤️
💎 Want us to help you become a better Forex trader ?
Now, It's your turn !
Be sure to leave a comment let us know how do you see this opportunity and forecast.
Trade well, ❤️
ForecastCity English Support Team ❤️
EUR USD SELL (EURO - US DOLLAR)Hi there. Price is forming a continuation pattern to the downside. Watch strong price action at the current levels for sell.

EURUSD DAILY TIMEFRAMEHello traders, Here is the full analysis for this pair... I think the price going to touch 50 percent of fibo level area and then we have a long opportunity. *Support this idea with a Like or Comments if you find it useful* ... Thank you

EUR-USD will bounce from the level. Sell.
Hello, Traders!
EUR-USD is facing horizontal level again.
It will most likely bounce from it
To retest the channel support
Sell
Like, comment and subscribe to boost your trading!
See other ideas below too!

EUR/USD QUICK TRADELooks like eur/usd might pump on tomorrows news events, cup and handle and an rvi bullish cross on the ema 89, good set up in my plan. last trade this week, see you all next week.


EURO: Short-term Decline AheadHello,
Looking for a temporary decline on EURUSD today as I am anticipating Dollar to pick up some strength.
Needless to say, I'm unsure of the weekly direction as I need more framework to determine a decision, but after moving away significantly from 1.17702 to 1.17444 as I delineated in my previous post - we are due for some sort of retracement to the downside.
How far can that retracement be? I'm not sure. I'm leaning towards 1.1780 as a reachable and realistic objective. 54.4 points away from current prices, which provides a great window of opportunity to capitalize from.
For now, I am focusing on shorts to 1.1780.
GLGT

EURUSD: Price Action & Bullish Outlook
hey traders,
it looks like at least the beginning of the next week will be bullish for EURUSD.
the pair has perfectly respected a major falling trend line, and during the last two days, we see a steady bullish continuation from that.
looking left at structure, the closest strong resistance that we can identify is 1.18 - 1.19 zone based on a current local daily high.
in case if you didn't manage to join this movement, wait for a retest of a trend line because opening the position from current prices is very risky.


EUR/USD to rise and pullback from the 0.236 fib lvlEUR/USD🇪🇺🇺🇸 is expected to test the 0.236 fib lvl but according to Stochastic the price is expected to be rejected by it and pullback down to the 1.17998 lvl.
If you like the idea PLEASE don't forget to hit the LIKE 👍👍👍button
Also share your thoughts and charts here in the comment ⌨️ section.

Don't Short Euro - Upside To GoEuro is going to make one more down leg and it will see extreme volatility to the upside as Dollar is likely to see continued weakness to the downside.
Many, many of you are anticipating downside projections but something is telling me to disregard that thought.
We will go higher, and trade above 1.19202 significantly.
Ideal buy entries can be anywhere from 1.17702 to 1.17444 about a 25.8 pip range to go long.
Price should NOT go below 1.17276.
GLGT - Thoughts and Feedback are always appreciated,
Thank you


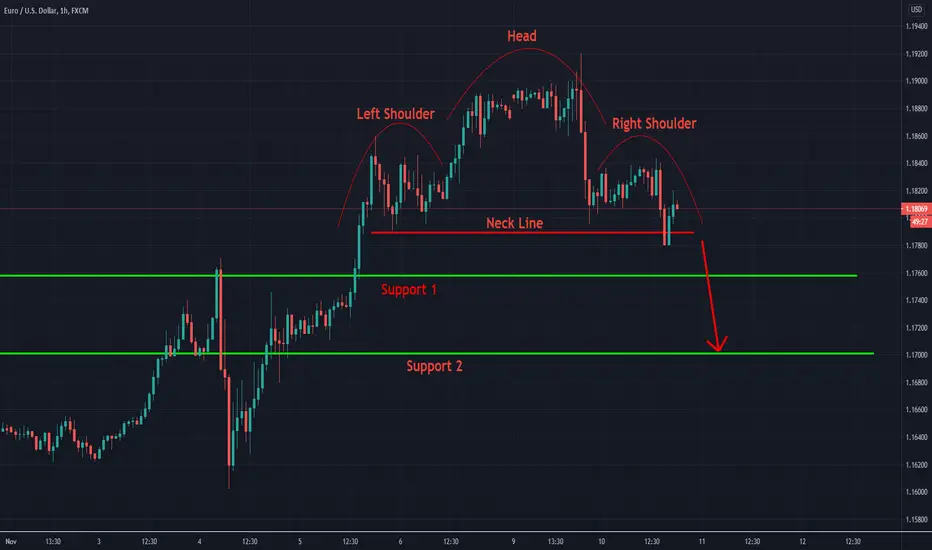
EURUSD Head & Shoulder Pattern For Short TradeEURUSD is Forming Head & Shoulder Pattern which is bearish pattern or trend reversal pattern (Shown in Chart) . According to chart pattern analysis , we might see down trend in EURUSD . One can initiate the short trade on EURUSD with proper risk management and stop loss
Thank You
💡Don't miss the great sell opportunity in EURUSDTrading suggestion:
. There is still a possibility of temporary retracement to suggested resistance line (1.186). if so, traders can set orders based on Price Action and expect to reach short-term targets.
Technical analysis:
. EURUSD is in a range bound and the beginning of downtrend is expected.
.The price is above the 21-Day WEMA which acts as a dynamic support.
. The RSI is at 40.
Take Profits:
TP1= @ 1.1780
TP2= @ 1.1745
TP3= @ 1.1695
TP4= @ 1.1623
TP5= @ 1.1540
SL: Break Above 1.192
❤️ If you find this helpful and want more FREE forecasts in TradingView
. . . . . Please show your support back,
. . . . . . . . Hit the 👍 LIKE button,
. . . . . . . . . . . Drop some feedback below in the comment!
❤️ Your Support is very much 🙏 appreciated! ❤️
💎 Want us to help you become a better Forex trader?
Now, It's your turn!
Be sure to leave a comment let us know how do you see this opportunity and forecast.
Trade well, ❤️
ForecastCity English Support Team ❤️

EUR-USD will keep falling DOWN
EUR-USD fell from strong resistance just as I predicted
Now bears will keep pushing down to retest support
Pair will go down
Like, comment and subscribe to boost your trading!
See other ideas below too!

EURUSD: Multi Time Frame Analysis & Trading Plan
Daily/4h/1h time frame analysis on EURUSD.
Price Action & Key Levels.
Trading Plan & Scenarios.
Please, support this video with like and comment.
Thank you!

EURO_DOLLAR STRONG RESISTANCE| SELL
EUR_USD has reached a strong resistance
I expect a pullback as the bullish movement was too-strong-too-fast
The pullback can be from 25 to 50% of the initial movement
Thus the target is the weak support level.
Like and Subscribe to never miss a new idea!

Sell USD through NovemberHere is another index chart USD vs EUR and Chinese Yuan combined (two biggest trading partners of the USA) from which you can see massive bearish engulfing after price broke yearly floor.
Even more bearish breakout from consolidation is observed on USDEUR*USDYJPY chart.
You can not see this well if you look just at EURUSD or DXY (which does not even include Yuan) charts. EURUSD should hit 1.22 by the end of this month. This is what I was speaking in one of my posts a few days ago, a missing 3rd bullish Elliott wave in EURUSD daily. See (its "upside down" from the chart above - means bullish eurusd rallies through November) -
