EURUSD Sell Opportunity 200+ pipEURUSD at main resistance area of 1.1900
Pair is volatile but extremely overbought, expecting a short possible retrace.
Entry:
1. Aggressive Entry @ current price area of 1.1870
2. 1.1900 area
TP 1: 1.1700
TP 2: 1.1600
50 pips stop loss
1:2 and 1:4 risk reward trade.
Trade safely on this one, see my main EURUSD idea linked. I am waiting for a strong bear daily candle close and at least a weekly bear candle before trading this down to long-term target of 1.1400 handle. But this pair is a good sell for short pips. I recommend taking increments of 30-50 pips if you are selling to protect risk to the upside.
Good luck trading! Let me know how I can help.
Charles V
www.cvfxmanagement.com
@cvfxwealth
Trading made Simple
EURO-USD

STRONG DAILY EVENING STAR IN EUR/USD, real or fake ?As you can see in EURO/USD there is a very strong daily candelstick pattern which you know it as a EVENING STAR!
What is an EVENING STAR? An Evening Star is a stock-price chart pattern used by technical analysts to detect when a trend is about to reverse. It is a BEARISH! candlestick pattern consisting of three candles: a large white candlestick, a small-bodied candle, and a red candle.
so clearly we have a fight between bulls and bears in euro/usd :
Fundamental view: as you know euro has very strong bullish fundamental news rather than US and the factors effecting on USDOLLAR during opening economics after pandemic , not very intresting for SELLERS !
so now what is my idea ? im searching for short-term intraday in euro/usd because its too soon to tell you about changing the trend in euro/usd.
I expect to see euro/usd bulls at first hours of next day trying to raise the price somewhere between 1.1820 - 1.1850, then bears come and use good sell situation and price falls 1.1720-1.1700.
important demand area for euro/usd bulls : 1.1720-1.1700


Don't miss the great sell opportunity in EURUSDTrading suggestion:
. There is a possibility of temporary retracement to suggested Resistance line (1.1819). if so, traders can set orders based on Price Action and expect to reach short-term targets.
Technical analysis:
. EURUSD is in a range bound and the beginning of downtrend is expected.
. The price is below the 21-Day WEMA which acts as a dynamic resistance.
. The RSI is at 30.
Take Profits:
TP1= @ 1.1750
TP2= @ 1.1708
TP3= @ 1.1626
TP4= @ 1.1562
TP5= @ 1.1463
SL= Break Above R2
❤️ If you find this helpful and want more FREE forecasts in TradingView
. . . . . Please show your support back,
. . . . . . . . Hit the 👍 LIKE button,
. . . . . . . . . . Drop some feedback below in the comment!
❤️ Your Support is very much 🙏 appreciated! ❤️
💎 Want us to help you become a better Forex trader ?
Now, It's your turn !
Be sure to leave a comment let us know how do you see this opportunity and forecast.
Trade well, ❤️
ForecastCity English Support Team ❤️

EUR/USD Long PossibilityI have highlighted multiple possible price directions. With reference to one of my commenters, I see a probability that the price will head to the top most resistance before seeing a push to the downside after its current consolidation. Take note that the dollar is possibly weakening considering its low GDP stimulus, low unemployment figures and the current COVID situation that it's in. Furthermore, the upcoming U.S elections will play a significant role in its currency strength too. Should the price hit the high of 1.19, consider shorting.
The price may remain consolidated in its channel and push to the downside. Do your own due diligence before trading.
For more content follow me on TradingView

EURUSD Double Top PatternSome resistance forming at the 1.19 key level. Double top pattern seems to be forming.
This could be a good place to catch a quick intraday short trade.

EURUSD: Candlesticks & Scenario For Next Week
after 1 month long bullish rally on EURUSD,
it looks like we finally see a strong reversal signal.
on a daily, the price went rejected after an attempt to violate a key weekly resistance
and the previous daily bullish candle was eaten by a strong bearish engulfing candle.
in conjunction with rsi divergence, it looks like the market is ready for a pullback.
for now, the first goal is 1.1625. it's based on the 382 retracement of the last bullish leg.
I guess the price will need at least one week to reach that goal.
please note, that it is not a sell signal.
I would suggest looking for a safe entry on a lower time frame.

Simple Analysis (EUR/USD) : direction the Golden RationThe market is preparing to face significant resistance. In case of a breakout, there is a high probability that the EUR / USD pair will hit its golden ratio. Follow and share


Strong Bearish Reversal for EUR/USDHello Traders!
EUR/USD might be heading towards a strong bearish reversal very soon. Bollinger Bands and RSI both indicate an Over Bought Market and we are now approaching a significant Resistance Zone. That's three different confirmations. Keep a lookout for a reversal happening soon!
What's your opinion on EUR/USD? Do you agree or do you have a different opinion? Let me know in the comments!
Much love,
- ALPHALICIOUS
Disclaimer: This is my personal opinion of the current markets. I am not responsible for any trades that you may take part in. Please use your own analysis and research when trading and use proper risk management. Thank you!


EUR/USD ULTRA RESISTANCE AHEAD|THE CASE FOR THE DOLLAR
EUR/USD is now moving in an upward channel, facing the blue resistance area, yet no one is talking about the real resistance ahead of us, that is the 11 year downward trend line, that has so far worked like a clockwork, with only a slight violation attempt, in 2014.
Now, the cross lines that you see on the chart represent estimated touch point of a price and the resistance, depending on the speed of the price growth.
It is obvious, that the touch point is realistically to happen below 1.1600. Thus, 1.1600 Is THE resistance level. However, given a relatively gradual slope of the resistance line, the touch point will most likely be no lower than 1.1500
Many link the current surge in Euro to the FED cutting rates, thereby negating the carry trade benefits and what we see now is the capital flow back to Europe, spurred by the current FED's and Treasury's collective dollar liquidity pump. That leads the aforementioned "many" to go further and make claims of the end of the Euro downtrend, which naturally means that the downtrend line will be broken and Euro will break out shining and free.
While there is certainly some truth to that, here is the FED funds rate chart, that shows us the beginning of the Euro down-trend, after the FED cut rates to de-facto zero in 2008, while the Euro funds rate, while going down too, was cut to near zero only in 2015. Therefore, while there is certainly a relationship between the two, it is not the single factor issue.
As I have already said before, I am convinced, that Europeans realize how damaging is the strong Euro to the EU’s economy, and therefore, It would be reasonable to assume, that the ECB will do Its best to make sure the downtrend line stands. Once broken, It will take much more liquidity to get the ginny back into the bottle.
Also, I am convinced that the dollar is the place to be now, as all the investable assets are in this currency, and will be in the future. The dollar represents 70% of the global trade and global financial liquidity, so the current collective effort of the FED and the Treasury serve merely as a patch for the liquidity hole in the global finances.
And the last but not the least, the dollar demand is driven by the companies that are not US based and therefore lack access to dollars, as well as the governments, that do not have access to the FED’s dollar swaps program, but which have borrowed heavily in dollars during the weak dollar years, and are now facing dollar cashflow shortages due to the massive corona related slump in the global trade.
All the talk of the dollar being replaced or sidelined as a global reserve currency are facing the harsh reality:
As of the moment, there is not a single currency that has the financial market depth and sophistication to accommodate the worlds capital. The Euro is a currency of a zero growth continent, that is plagued by local debts, a coming banking crisis, and is a poly-country currency, which means that Euro is always under the risk of being hit by the exit or a default of one or many member countries, or even a complete blocks dissolution.
In that case, one, who has Euro-German assets finds himself with the Deutschmark assets and Euro debts on hand. A great position to be in. While one with the Italian assets, finds himself with the Lira assets and Euro debts on hand. An awful position to be in.
That persistent ambiguity makes Euro an unreliable harbor for global capitals. The common finance ministry and the common debt, it if becomes reality, will certainly boost Euro’s reliability, yet that is a double edged sword, due to the fact that further federalization will push more countries into the Euro sceptic direction, and each move to strengthen the EU and the Euro is a step towards its demise.
Chinese RMB can not be a global reserve currency, for many reasons. Among the many are the fact that there are no RMB asses that are available for non-chines entities, there is no rule of law to protect ones property rights, and China is still largely a developing country. Don’t be fooled by the splendor of the ex-Canton, or Shanghai. China beyond its mega cities on the coast remains a second tier country at best.
More developed than India, less developed than Brazil.
Japanese Yen is not big enough for such task, with only 126 million people, a third of the one of the USA. Besides, the country itself has been plagues by zero growth for decades, and is militarily indefensible in case of a war with China or Russia. Other economies are regional and are not worth consideration. The US remains the power that keeps the seas open for everyone, while allowing everyone to use its judicial system to protect their property right. And in exchange, we just have to use dollars. A low price to pay if you asked me.
A shift to the gold based transactions is the only somewhat viable alternative, yet the US has by far the largest gold reserves, which means that the Gold backed dollar will be the currency to use anyways.
Besides, the global security role and the global property rights body will remain in the dollar realm anyway.
Thus, as a convinced dollar bull I say that the level will stand strong, which gives all of us a gorgeous swing short opportunity on EUR/USD.
Please, tell me your opinion in the comments, I very much welcome an intelligent discussion.
Thank you for reading. Like and subscribe and have a nice day!

EURUSD: Price Action & Scenario for Next Week
EURUSD is trading within a rising parallel channel on 4H.
the resistance of the channel was reached on Wednesday and the market set it's last higher high there.
during the next two days the pair started to consolidate:
with a sequence of three equal highs and two equal lows, the price is stuck in a narrow horizontal trading range.
next week, with a high probability the price will retrace one more time from the horizontal resistance.
then sellers will face with a buying pressure from a channel's and range's supports.
consider this range for potential quick trades next week.
to catch the next wave, I would suggest waiting for a violation of the range.
we can not estimate how long the market will trade there, so it would be better to just wait.
have a great weekend!!!

EUR/USD CHANNEL SHORT|STRUCTURE TRADE
EURUSD is trading in an upward channel, and has just reached a confluence of a channel resistance and a lower end of the horizontal structure resistance.
+a double top will be formed. Thus- we aim at short.
The resistance, though violated on 8 hour remains intact on the daily and therefore I consider it to be valid.
TRADNING PLAN:
1-Enter in the identified entry area, with sell limit.
2-SL and Takes are on the chart.
3- What if the price does not reach the take area and does down from here? >>setup invalid.
Great trade with 3,5:1 risk reward and about 50% probability
Thank you for reading, like and subscribe, and have a nice day.


EURUSD: Year's High AHEAD!!! Key Levels & Scenarios
EURUSD is approaching a key daily structure resistance.
1.15 is year's high, short rally from that level was just crazy in march.
we don't know how the market will react this time, so we must be prepared for both scenarios:
in case of a bullish violation of the underlined resistance (daily higher high higher close)
the pair will most likely keep growing.
next midterm resistances will be:
1.155
1.160
if the structure will be respected (some reversal formation on lower timeframes)
the market may retrace.
closest midterm supports will be:
1.137
1.130
of course, bias right now is bullish, but it is too late to jump in.
let's patiently wait and see whats gonna happen.

EUR/USD STRUCTURE BREAKDOWN|SHORT
EUR/USD has broken out of the upward diagonal channel, and ignored the double top it should have formed with the last high.
Now, it is entering the big resistance area, thus, despite the recent strength, the target trade is a short
+RSI near overbought which is a bearish signal.
The pair might move further up from the current level, so I am not giving any precise entry point right now.
However, a short towards the first support at least will be a good trade.
Watch the price action closely, the opportunity for a short must present itself, and now you are aware of it, thanks to me.
Thank you for reading, like and subscribe and have a nice day!


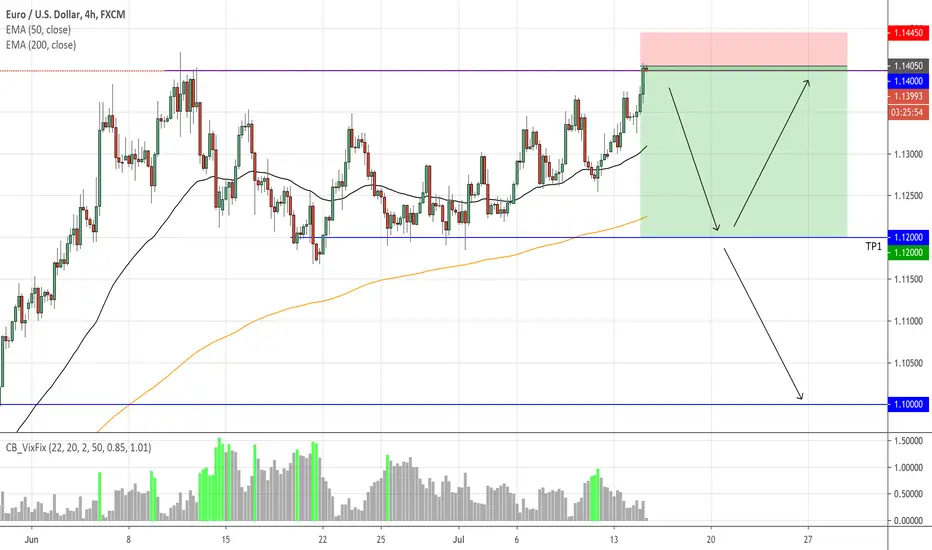
EURUSD Short *KEY LEVEL RESISTANCE*Nice resistance and potential double top @ 1.14.
Shorting here and targeting the bottom of the current price range which is 1.12. If that level breaks then price should fall further to 1.10. Alternatively a bounce off that level will see the sideways price action continue.