EURO-USD

EURUSD Probabilities For Pullback? Mid Term PossibilitiesTechnically exhausted bulls and tonight we have Businesses & Employment reports incoming from the US (ADP, ISM, and PMI) which are some key data representing the US economic outlook. Any unexpected numbers can spark volatility on this major pair. We had a 50bp emergency rate cut which was a surprise last night from FED and the aftermath outcome for the king was not good which we can know by watching over DXY around the floor (lately did rebound upward showing some correction hope). Exhausted euro bulls and oversold dollar make me think if tonight somehow the US passes a good outlook on those key reports then it can be a chance for the greenback for retracement over a shorter time horizon around 32.80% Fibonacci which line up with last time R1 of the W period pivot. I won't say that this major pair may have a full reversal at this point by knowing that FED has probabilities of 2 more rate cuts this year. It is the nature of the market to fall and rise back harder or rise and then fall back harder on the various factors of the underlying asset. Nothing goes to hell or heaven straight forward. Last night market players have pushed price further upward on this major pair after knowing FED surprise announcement which let me think psychologically and technically once at this point that there may not be more room left upward for this pair (overbought oscillators condition too). Even if the news doesn't favor the US tonight it has already priced in finely last night so possibilities can be just opposite creating a sell-off scenario (don't forget what happened with AUDUSD even after the cut by RBA last day). Even if reports end up being good for the US then also bear have some reason to push the price lower where market is already overbought for this major so that make some sense too. In both cases, it seems we may today have some pullback in this pair hypothetically talking.

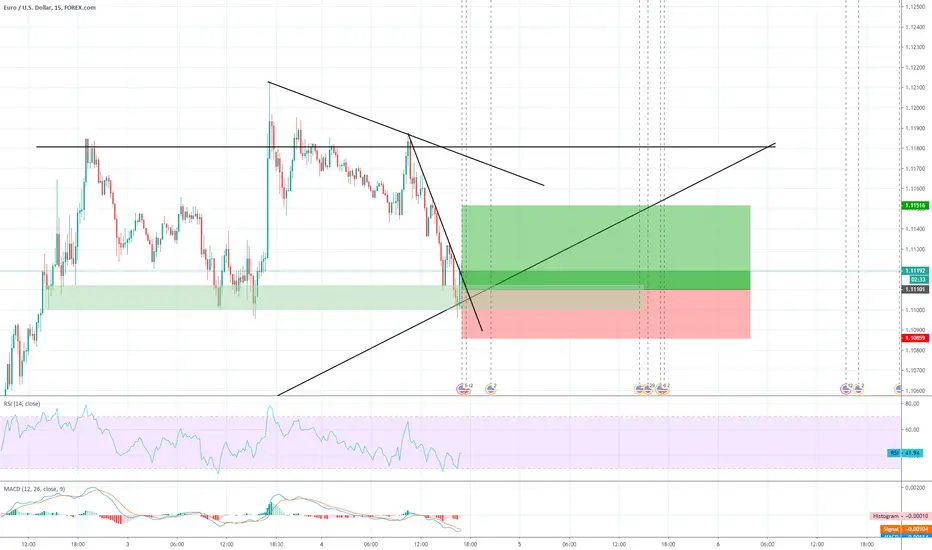
EURUSD SHORT WITH TARGETS!enter only on price action confirmation and use appropriate risk management and stop loss

EURUSD If You Missed Long...
many traders have missed long trade on Friday morning and now are looking for an opportunity to join the rally.
be careful with buying on current prices,
on 4H the pair has reached an important trendline and it feels like it is still respected buy the market participant.
the best option for you to buy the pair is to wait for a bullish breakout of the trendline and buy it on pullback
aiming at 1.09 level.
such a plan will give you a good r/r ratio and protection against the occasional price fluctuations,
please, support the idea with like!
thank you!

Ever Going Downtrend in EURUSD? EURUSD has been in a downtrend for quite some time now, after the retest at its support of the EMA 20. MACD is showing no signs of decrease in momentum, but there has been a slight decrease in volume traded compared to 2019. The next support support would be at S3, where some substantial profits can be made. Some may decide to long at the next support.

EURUSD: Bearish Wave & Breakout
without any hesitation, EURUSD has easily broken below a strong daily horizontal support
and now bears are pushing the market lower.
analyzing weekly chart it looks like a bearish wave proceeds.
The next target for bears will be a support line of a falling channel that the market is following from 2018.
if you still hold a long trade, I believe that the best option for you is to embrace the loss and stop struggling!
good luck!

EURUSD Short after successful short & long (see past trade)Waiting for pullback and price action confirmation before entering

EURUSD-Buy setupreaching the bottom of the channel, close to support zone, wait for a break to the upside and a retest of 1.000 after we break the descending channel.


EUR/USD Daily ViewHi Foxes
As you can see on the chart, there is a good accur channel which is mark by two purple tradeline.
Price touch that and the resistance zone so could goes up again as we expect.
Trade safe and respect to the Risk Management rules :)

It's a long time i am not posting analysis.. but i am back.BUYEUI don't remember last time i posted one of my analysis. It's passed so much time... but i think it's time to get back and share my ideas. So, here you are a fresh signal before the NFP. EURUSD has made a consecutively 4 bear bars on weekly charts. History is clear, usually when EU is too much oversold... pullback is coming hard. Next, we are on important pullback zone. 1.100 is an important price, and looking on H1 tf i can clearly see a MACD divergence, that can anticipate a rally up. I suggest you to wait eu to come back to 1.10100 again before buying, or enter now with small size and buy again later. The target are marked with red lines, also the possible retracement.
What do you think guys? Hope you appreciate :)
I'm back :)
Simo

EUR/USD Daily - Possible Bullish ReversalTuesdays close on the 1D chart gave us a bullish hammer. Depending on the outcome of Wednesdays daily close we may have a sign for a bullish reversal.
RSI is sitting around 35 which may also give the indication the trend has tired out.
Strategy:
Wait for Wednesday close.
If we close above 1.1025 (the hammers high) then I will be looking for a long position.
If we close below 1.1000 the possibility of bearish continuation is in sight, then I will be opening a short position.

EURUSD ANALYSISThis pair bounce from the top of a descending channel, making a head and shoulders pattern. right now, we got the neck of the pattern converging with a support zone, a .78 FIB level and a 4H timeframe ascending trend line. to go bear i would like to see a close below mentioned converging zone.
To see the full analysis, educational content and quality signals service contact us on
Telegram: @FedericoGallo - @MrFlawlezz
Instagram: @Forex_society

Euro (EURUSD) short.All description on the chart.
Please, don't forget to like and follow.
Thank you.

Trade idea on EurUsd(4Hrs)EurUSD on 4hrs is currently on a supports/resistance parameters and therefore pose a great opportunity for either a buy/sell.. So therefore wait for any breakouts i.e if the market breaks 1.11150 its a very safe buy to 1.11600 And if market breaks 1.10700 its a very safe sell to 1.10100 Otherwise stay out at consolidation(ranging) points OR once the trades breaks the light blue rectangular shades, Buy if top is broken, sell if bottom is broken and apply stop loss @opposites ends... Also apply proper risk management and set your buystop/sellstops respectively to the mentioned breakouts mp. Goodluck!! Please comment and share your ideas too on this particular pair. thanks!

#EURUSD Mind the gap... yetThis pair had been such a great one for intraday trading but nice to let it run. Remember... Good things take time.
Cream Live Trading

Seige WarfareWith a breakout in play on the daily, the formation can advance towards 1.128x and 1.146x extension. The diagram below highlights the attempt shows little defence to transfer the attack on weekly:
Given what we have recognised on the technicals around the principled handicap bears have it makes it possible to construct the Macro chart:
When our opponent possesses a weakening defence it is worthwhile to push into the advance. In this case, after the Macro and Technical diagrams, we must continue to work the buy side with action towards the highlighted targets. As long as we are allowed to continue the grind higher, reassessment is only necessary below 1.110x. The weakness will appear miles in advance if it is the case and we can update the chart as we go.
Here the static weakness of the Dollar can be seen in detail, and in this case bears clearly with the advantage:
Remember when a cross shows static weakness, you should aggressively load against them and not be afraid to double the sizes. Now consider the positioning in the next diagram taken from " Apple in the worm "
Bulls encouraged Bear's hope that he was headed for a momentum break down, which mean exploitation for the macro swing was not all that difficult. Next came:
And now it is important for bulls that the break is tempered into an impulsive swing, the result of which will hold the key to unlocking the targets at 1.128x and 1.146x. Bulls are counting on the strength of the longer term Euro funded currency leg:
The correct march forward for bulls here is over the flank, so 1.197x and 1.125x resistance will be key to track for mid-term swings. On the other side, 1.093x and 1.087x will need to be taken in order to demand reassessment of the core bullish view I have constructed over the past three months. Here the win looks forced:
...Thanks all for keeping the support coming with likes, comments, charts and etc.

EUR/USD: long scenario Long leg started to move on the EUR/USD pair.
We have confluences on different TF's.

pull back for the eurusdSup Traders
We had a big move from the eurusd last night and unfortunately, what goes up must come down!
I could see a little fakeout in the asian session then back down to at least 1.03
Keep risk managed!
Cheers

EURUSD thoughts and opinionThe bilateral chart pattern is seen in the hourly timeframe. ECB: A strong call for unity was made at the October meeting. Daily ATR is around 42 meaning, for now, price is trading below the average (may have some room for upside). It seems like a break for now from the upper trendline of the bilateral chat pattern has occurred. Price was held by this crucial level from the last day but for now, the bull breaks this wall.

Time for EURUSD to make its next move down?Sup traders
The eurusd looks like its had its 3 levels with the liquidity grab.
Looks like its ready to make its next move down over the next sessions.
Keep the risk managed!
Cheers :D

EURUSD: What to expect next week???
EURUSD has retraced from 1.1 support this Thursday
and I believe that bullish tendency will remain at least until 1.108 level.
I have placed an alert on 1.108 and will try to catch a bearish continuation to the support of the range.
Wait for a confirmation on a lower timeframe before entering the trade.
