Euro Dollar.. more pips.Good pull back opportunity on EU. Check DXY (dollar index) for confluences. USD fundamentals at play.
EURO-USD

EURUSD - Trade PlanningHey!
As you can see it on the chart we have a strong support 'area' where the 200ema and my dark red horizontal line cross.
If price can break above the orange-ish line, then, a good long position can be placed - although the red downwards trendline can stop it.
Let's see how it goes - today is a very calm day, I do not expect any major movement.


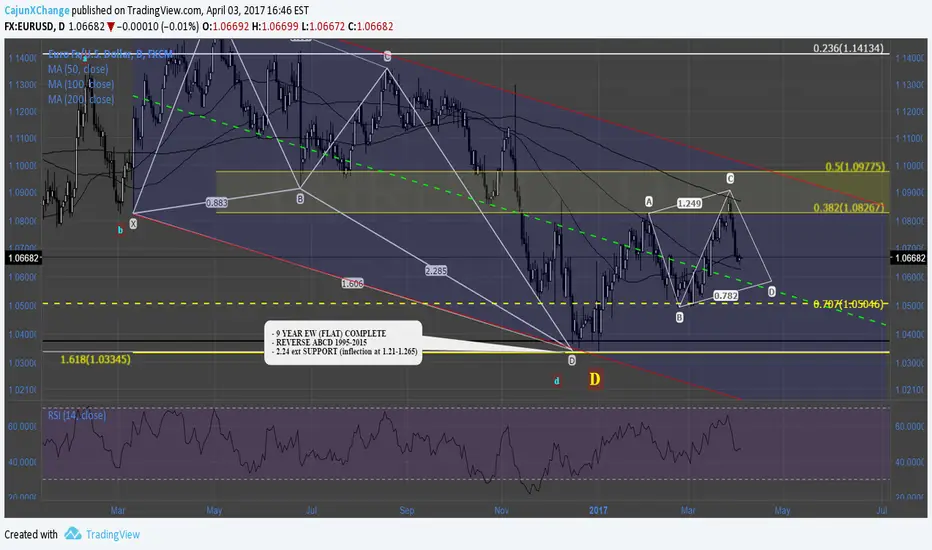
#Eurusd gartley 1st T, garfly 2nd T may see correction to 1.0645, which is my line in sand for bulls. 1st target is gartley, 1.08360; 2nd target is garfly at 1.0980, which will complete a bearish 50 Ive been preaching about. There is a major possibility of price blowing through 1.10 which will set the stage for 1.20.
link provided below.

EURUSD Wedge timeHey hey!
So far, we're on track. Attached find the yesterday's bounce-up-break-down idea.
Now we're going to check whether we should sell (60%) or buy (40%). Why?
The double top that was mentioned yesterday had been done perfectly, now the price is at an important key support level. In my opinion, the price will reach the grey line and then bounce back - the reason it's 40% buy only is because we have had a long going up and a bit of retracement is acceptable - or which is a bit more likely is to break down these levels and go further to 1.12 rough.
I'll be updating you as soon as a trade will be placed.
Tell me what you think in a comment.

XAUUSD - Short opportunityHi everyone,
This pair is getting ready to shoot itself back to te ground.
Bye.

EURUSD - Contradictions in one picture - Trading IdeaHey Everyone!
Yesterday, we were buying EURUSD with a good 1:3.2RR win.
Since then, my view has changed a bit. Let's look at this 1h picture.
Reasons to buy:
It's still going higher, making new highs and new lows (we call it an uptrend)
The trendline is still valid and acted beautifully when it came to hold the price
This retracement can be retest of the trendline, then we go up, up and away
If you look at daily chart, according to price action it can still hit the previous shadow of 9 nov.
Reasons to sell:
I have seen it many times, making new highs and lows and then, out of the blue it just broke down with candlesticks like that
On 1h and 4h we have a double top which is even more confirmation
Candlesticks on 1h shows loss of control by the bulls
All things considered, I will be monitoring this trading idea closely as this can be a bear trap as well - a moment when everything shows that it will go down but in the end it goes up - and I rather wait than jump in for no reason.

EUR/USD bullish reverse in actionHey Everyone!
I have taken EUR/USD long this morning as you can see it on the picture.
Strong bullish movement in the past month
The last 4-6 days show a clear strength of EURO
Daily Chart signals engulfing candlestick pattern
A strong bounce from an Hourly trendline was expected (not on the picture)
All in all, I believe it's a good trade and still has a valid point to enter.


$EURUSD | Bullish Targets Defined | Predictive/Forecasting ModelHello Traders,
There is a lot of action going on right now around Euro because of the French elections. Taking a purely technical look at EURUSD, the Predictive/Forecasting model has defined the following BULLISH targets.
Very High Probability - 1.10444
High Probability - 1.11140
Low/Medium Probability - 1.12039
Highlighted in faint grey is a background geometry that I'd pay attention to through the corner of my eye. However, it has not posed any significant pull on the price as of yet.
For those that are not familiar with the Predictive/Forecasting Model, it is the method taught by David Alcindor, known as "4xForecaster." I was fortunate enough to be one of the few students to take his course and learn the "magic" behind the very powerful model.
For historical reference, the Predictive/Forecasting Model was used during the American Elections as well. I have linked the ideas below.
Best,
Chartistry

Eur/Usd Fibonacci Channel Eur/Usd 30 Minute Chart with CCI and StocasticRSI. Channel looks strong and we have confluence with Fibonacci. Looking to see if we break channel and 0.236 Fib. If so I expect to see a new reversal channel form and a fall in the PA


EurUsd Weekly Bullish Break-out!!Last week the EurUsd clossed above the resistance and upper range! Stoch Rsi clearly shows a bullish cross over and Adx shows a bullish trend with trend strenght soon aproaching the very strong level.
The upcoming week theres a high chance we will see an attack and possible break of 1.10. If you look at my published ideas you also see that earlier I published a dollar index analysis which shows that the Dollar Index might break downwards from its range.
Some people will say the eurusd will close the gap. I say that if it was going to do that we already had seen it last week. The drop back below 1.09 on friday was very likely to be a correction from the gap and upwards trend since in the end of the day EurUsd went back towards 1.09 and close just 7 pips below it.
How to trade:
Buy the possible dips, use a 60 or 80 pip stop-loss. Monday is a banking holiday so that real action might start on tuesday

EU LONG?All Timeframes held ebove 200EMA, Broken monthly resistance, broken ascending trendline. restested resistance now looking like support, waiting for daily candle close.


EURUSD 5th wave setupEURUSD looks to be in the process of completing a
so called 5th Elliot Wave. For this its important that
it will break to current resistance. When this happens
this 5th wave might go to 1.09 and possible beyond if
the upper range breaks.
Stoch Rsi shows strong buying pressure and Adx shows
that bullish trend is stronger then the bearish, however
the red line that indicates trend strenght still needs to
climb a bit further. If this black line goes above 25 and
indicates a strong bullish trend then a break-out of the
bollinger bands is highely likely.
Buy at current market price with a small position and be
ready to add more, or buy the dips


#EURUSD deep crab Deep crab 1.077-750 which is .618 retrace and median line drawn from already mentioned reverse abcd pattern that was hit earlier