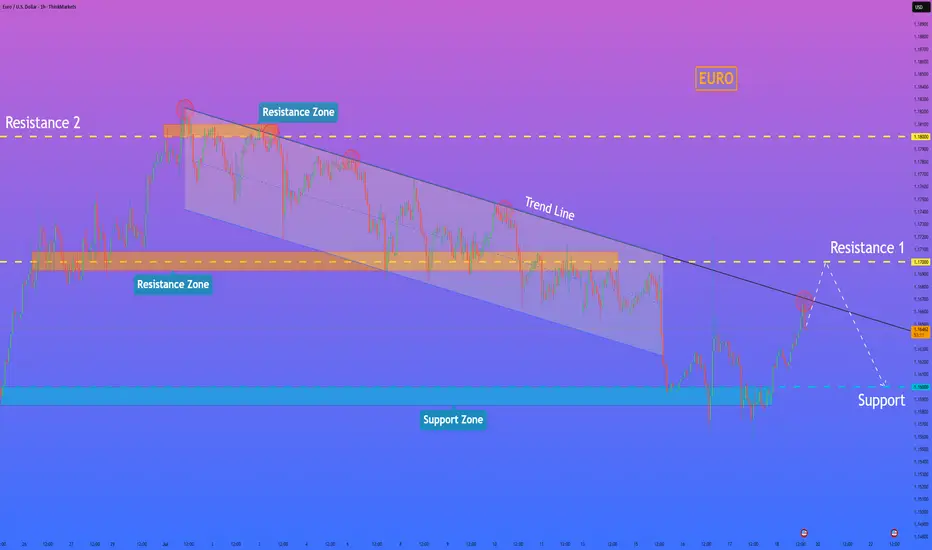
EURO - Price can continue to decline in falling channelHi guys, this is my overview for EURUSD, feel free to check it and write your feedback in comments👊
For a long time, the price was moving within a large ascending wedge, showing a gradual upward trend.
However, buyers failed to maintain momentum, and the price made a decisive breakout below the wedge's support line.
Following the breakout, the instrument established a new structure, a local falling channel, and has been trading within its boundaries since.
Currently, the price is in a corrective upward move, approaching the key resistance area of $1.1630 - $1.1660.
This zone is significant as it aligns with a previous support level and the upper boundary of the current falling channel.
I expect that the price will face rejection from this resistance area and will then continue its decline towards the channel's support line, targeting the $1.1465 level.
If this post is useful to you, you can support me with like/boost and advice in comments❤️
Disclaimer: As part of ThinkMarkets’ Influencer Program, I am sponsored to share and publish their charts in my analysis.
Euro

HelenP. I Euro will reach resistance level and then start fallHi folks today I'm prepared for you Euro analytics. For an extended period, the euro was trading within a clearly defined downward channel, consistently respecting its boundaries and moving under bearish pressure. Recently, however, the price staged an aggressive breakout from this structure, pushing above the upper trend line with a strong impulse. This move signaled a potential shift in momentum, as buyers appeared to take control and drive the price away from the major support zone near the 1.1600 level. Currently, following this upward breakout, the price is approaching a critical test at resistance 1. This area, centered around the 1.1700 level, is significant as it previously acted as a key pivot point and support inside the downward channel. The current price action is a classic scenario where old support is being retested as new resistance, which will determine the validity of the recent bullish move. Despite the recent breakout, I expect the upward momentum to fail as the price challenges the resistance zone 1 around 1.1700. I anticipate a rejection from this level, which would confirm the breakout as a false move and re-establish the dominant bearish trend. The primary target for the subsequent decline is the major support level at 1.1600. For this reason, my goal is set at the 1.1600 level. If you like my analytics you may support me with your like/comment ❤️
Disclaimer: As part of ThinkMarkets’ Influencer Program, I am sponsored to share and publish their charts in my analysis.
SHORT ON EUR/CADEUR/CAD has given us a nice CHOC (change of character) to the downside followed by a nice retest to supply.
I expect price to push up a little more into supply before dropping to the next support/demand level.
Looking to Catch 300-400 pips over the next few days.

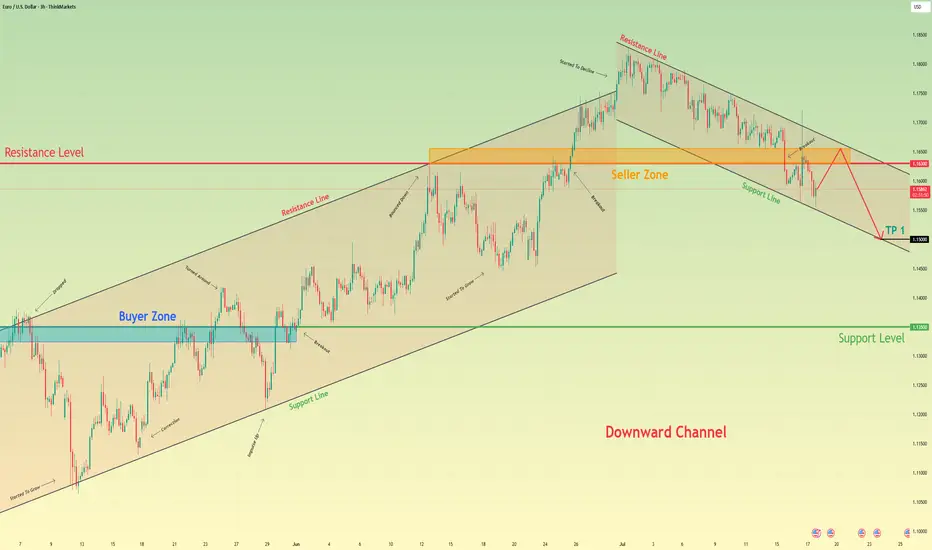
Euro may reach seller zone and then continue to fall in channelHello traders, I want share with you my opinion about Euro. The price pair has recently shifted its market structure, establishing a clear downward channel after breaking its previous uptrend. Before this breakdown, the price was consistently trading within an Upward Channel, repeatedly finding support in the buyer zone (1.1325–1.1350) and reversing upward. The bullish momentum eventually faded when the price failed to break the major horizontal resistance level at 1.1630. This failure triggered a strong bearish impulse, leading to a decisive breakout below the channel's support line and confirming a trend reversal. Currently, the price is making a corrective move up inside the newly formed downward channel, which appears to be a classic retest of the broken structure from below. I expect this upward move to stall as it approaches the heavy confluence of resistance formed by the channel's upper Resistance Line and the horizontal seller zone at 1.1630–1.1655. After testing this area, I anticipate a rejection and the beginning of a new bearish leg down. That's why I've set my TP at the 1.1500 level — it aligns perfectly with the support line of the current downward channel, making it a logical target for sellers. Please share this idea with your friends and click Boost 🚀
Disclaimer: As part of ThinkMarkets’ Influencer Program, I am sponsored to share and publish their charts in my analysis.
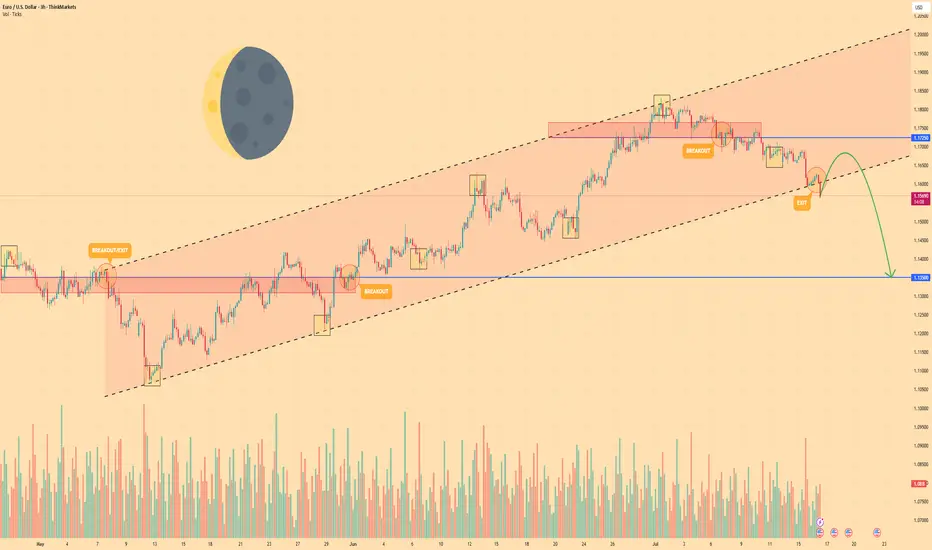
EURO - Price may drop to $1.1350 support level Hi guys, this is my overview for EURUSD, feel free to check it and write your feedback in comments👊
Euro began its journey by breaking into a rising channel off the swing low near $1.1080, establishing a clear uptrend.
Within this channel, price carved out steady support along the lower trendline, touching $1.1350 before buyers stepped.
Mid-channel, two breakout attempts at $1.1550 and $1.1725 highlighted bullish conviction, yet both retreated back below resistance.
Simultaneously, two exit signals appeared near the upper trendline around $1.1765, showing that upward momentum was losing steam at key inflection points.
Currently, EUR is holding just below the channel base after a minor bounce, consolidating as traders weigh the next move.
I foresee a brief climb toward near $1.1670 before a renewed bearish thrust drives price back down to test $1.1350 level.
If this post is useful to you, you can support me with like/boost and advice in comments❤️
Disclaimer: As part of ThinkMarkets’ Influencer Program, I am sponsored to share and publish their charts in my analysis.
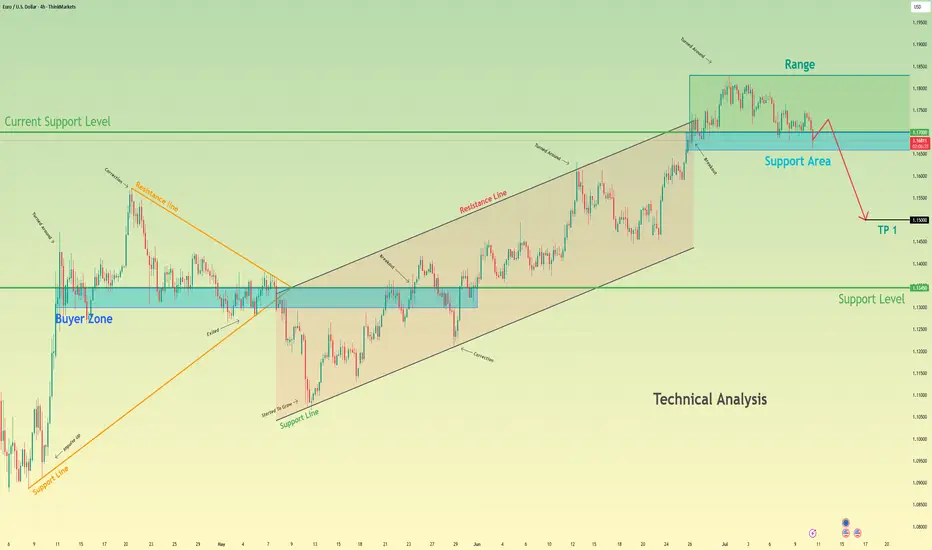
Euro may fall to support area and then start to growHello traders, I want share with you my opinion about Euro. The price previously moved inside a wedge formation, where it tested the buyer zone and showed a strong reaction from this area. After that, the pair broke out upward and started to trade inside an upward channel, building momentum and forming a clear bullish structure. Later, the price created a pennant pattern, often considered a continuation signal. But before continuing the upward trend, I expect the Euro to first exit from the pennant and decline toward the support area. This zone was previously resistantce, and now it may turn into a strong support. Now the price is trading near the pennant resistance, but I don’t expect a breakout right away. The market needs to correct before it resumes the uptrend. Once the price reaches the current support level or slightly lower, it may find demand again and bounce. That’s why I expect the Euro to retest the support zone and then grow further toward TP 1 - 1.1850 points. This target aligns with the upper border of the upward channel and would complete the continuation move after the pennant breakout. Given the previous structure, bullish momentum, and patterns on the chart, I remain bullish after the correction and expect the price to rise from the support zone. Please share this idea with your friends and click Boost 🚀
Disclaimer: As part of ThinkMarkets’ Influencer Program, I am sponsored to share and publish their charts in my analysis.

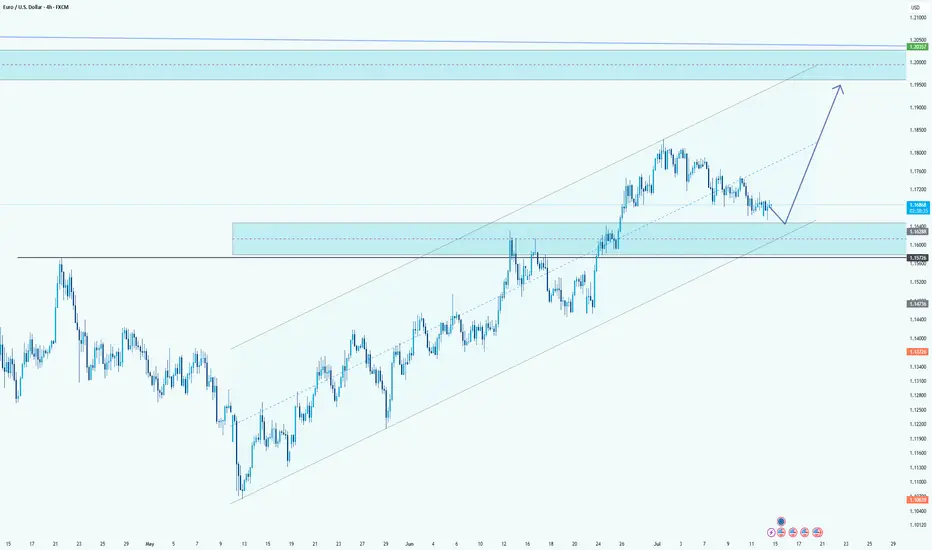
EUR/USD Retracement Into Demand ZoneHello guys!
EUR/USD is currently undergoing a healthy retracement after an extended bullish trend within the ascending channel. The price is now approaching a key demand zone, which aligns perfectly with the mid-line of the channel structure.
This zone previously acted as a strong resistance area and is now expected to serve as support, confirming a classic flip in market structure. The reaction around the 1.16288 - 1.15774 area will be crucial.
If buyers step in here, the bullish momentum is likely to resume with the next major target being the upper resistance zone near 1.20000 , as projected by the upward arrow. The overall structure remains bullish as long as the price holds above the channel support and doesn't close below the last demand zone.
EURUSD The 4H MA200 distinguishes bullish from bearish.The EURUSD pair has been trading within a (blue) 2-month Channel Up since the May 12 Low and it just broke below its 4H MA100 (green trend-line). The previous two Bearish Legs of this pattern bottomed (made a Higher Low) on or just above the 0.5 Fibonacci retracement level.
As a result, the price is very close to the most optimal buy level of this pattern and as long as it holds, we expect to start the new Bullish Leg and target the 1.5 Fibonacci extension (1.20000 our Target just below), which is in line with the previous two Bullish Legs.
If however the 4H MA200 (orange trend-line) breaks, we will take the loss on that long and go short as technically the price should seek the bottom of the (dotted) wider Channel Up. Our Target on that occasion will be 1.14000, right at the top of the High Volatility Zone.
-------------------------------------------------------------------------------
** Please LIKE 👍, FOLLOW ✅, SHARE 🙌 and COMMENT ✍ if you enjoy this idea! Also share your ideas and charts in the comments section below! This is best way to keep it relevant, support us, keep the content here free and allow the idea to reach as many people as possible. **
-------------------------------------------------------------------------------
Disclosure: I am part of Trade Nation's Influencer program and receive a monthly fee for using their TradingView charts in my analysis.
💸💸💸💸💸💸
👇 👇 👇 👇 👇 👇

EURO - Price will rise a little and then drop to $1.1500 pointsHi guys, this is my overview for EURUSD, feel free to check it and write your feedback in comments👊
Price earlier carved out a pennant pattern after a strong rally, with price oscillating between converging trendlines and indecision mounting near $1.1550 resistance.
After several weeks in consolidation, sellers finally broke down below the pennant base, sending price back toward the support area and trapping late buyers.
Buyers regrouped and launched a new advance, driving EUR into a well-defined rising channel.
During this channel run, two notable breakouts above interim highs were quickly followed by exits at the upper trendline.
Price now sits in a tight consolidation just under the rising channel’s ceiling near $1.1700, forming small corrective swings on lighter volume.
I expect one more shallow rally toward $1.1750 before sellers overwhelm buyers again, pushing Euro down through $1.1550 and toward the $1.1500 points.
If this post is useful to you, you can support me with like/boost and advice in comments❤️
Disclaimer: As part of ThinkMarkets’ Influencer Program, I am sponsored to share and publish their charts in my analysis.

EURGBP Perfect Channel Up giving one more buy opportunity.Last time we looked at the EURGBP pair (May 30, see chart below) we gave the most timely buy signal right at the bottom (Higher Lows trend-line) of the Bullish Megaphone, and the price is only a few candles away from the 0.87400 Target:
If we look at the price action from a 4H perspective we can see that it is a Channel Up that has been driving the pair upwards since the May 28 bottom and today's rebound is taking place after a direct hit on the 4H MA50 (blue trend-line).
This is the start of the new Bullish Leg. Since the previous two have increased by +1.90%, this rally has the potential to even exceed our 0.87400 Target marginally. Still, this is a perfect bullish set-up.
-------------------------------------------------------------------------------
** Please LIKE 👍, FOLLOW ✅, SHARE 🙌 and COMMENT ✍ if you enjoy this idea! Also share your ideas and charts in the comments section below! This is best way to keep it relevant, support us, keep the content here free and allow the idea to reach as many people as possible. **
-------------------------------------------------------------------------------
Disclosure: I am part of Trade Nation's Influencer program and receive a monthly fee for using their TradingView charts in my analysis.
💸💸💸💸💸💸
👇 👇 👇 👇 👇 👇

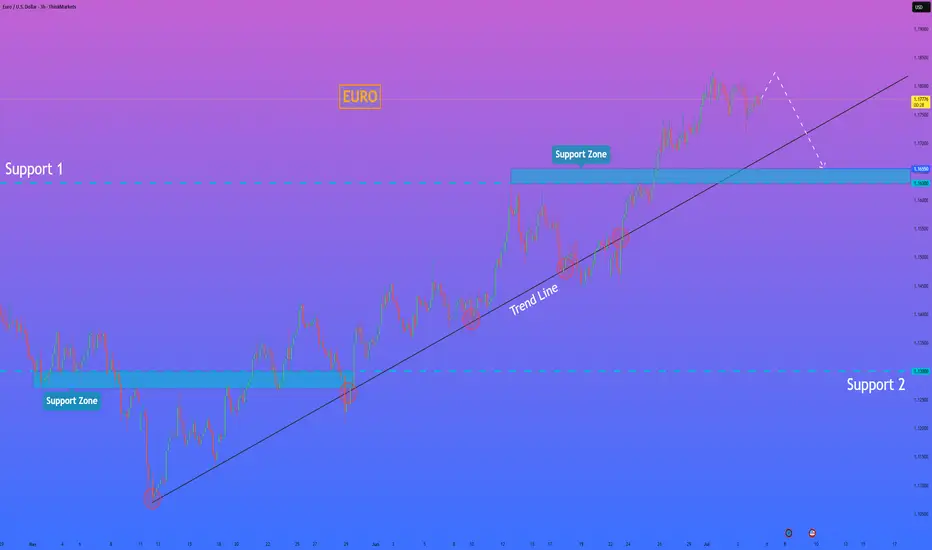
HelenP. I Euro will drop more, breaking the support levelHi folks today I'm prepared for you Euro analytics. After analyzing the current structure of the EURUSD chart, I noticed a strong break of the ascending trend line, which had been respected for a long period. The price has now returned to test the broken trend line from below, aligning with the resistance zone between 1.1665 and 1.1700 points. This area used to serve as solid support, but after the breakout, it turned into resistance. The retest from below could become the final confirmation before the pair continues its downward movement. Right now, EUR is trading just inside this resistance zone. There is a small chance the price might move slightly higher to touch the upper boundary of the zone, but overall, the pressure looks bearish. I expect that after a minor bounce, EUR will decline again, breaking below the local support at 1.1665. Once that happens, a larger impulse down could be triggered, targeting even 1.1525 points, which is my main goal for this setup. This bearish scenario is supported by the failed attempts to recover above the trend line and the fact that previous support has already flipped to resistance. If you like my analytics you may support me with your like/comment.❤️
Disclaimer: As part of ThinkMarkets’ Influencer Program, I am sponsored to share and publish their charts in my analysis.

EURO - Price will continue to grow inside rising channelHi guys, this is my overview for EURUSD, feel free to check it and write your feedback in comments👊
Recently, price entered to rising channel, where it soon reached the support level, which coincided with the support area.
After this movement, the price broke this level, but soon turned around and corrected the support line of the channel.
Next, EUR went back to $1.1365 level and broke it again, after which it made a retest and continued to move up.
In a short time, EUR rose to the resistance line of the channel, made a correction, and then grew to $1.1700 support level.
Price broke this level too and reached the resistance line of the channel, but not long ago corrected.
At the moment, I expect that the Euro can correct to the support line of the channel and then rise to $1.1900
If this post is useful to you, you can support me with like/boost and advice in comments❤️
Disclaimer: As part of ThinkMarkets’ Influencer Program, I am sponsored to share and publish their charts in my analysis.

Opportunities Arise from Dollar WeaknessSince the dollar peaked in 2022, it has declined by 24%.
Such a decline may not seem significant for a stock, it’s a different story when it comes to currencies, especially a reserve currency for USD. US purchasing power has dropped by a quarter, meaning they will now have to pay 24% more for imports from EU.
However, the decline in the USD also presents opportunities in other markets.
Mirco EUR/USD Futures
Ticker: M6E
Minimum fluctuation:
0.0001 per euro = $1.25
Disclaimer:
• What presented here is not a recommendation, please consult your licensed broker.
• Our mission is to create lateral thinking skills for every investor and trader, knowing when to take a calculated risk with market uncertainty and a bolder risk when opportunity arises.
CME Real-time Market Data help identify trading set-ups in real-time and express my market views. If you have futures in your trading portfolio, you can check out on CME Group data plans available that suit your trading needs www.tradingview.com

After breaking support level, Euro can continue to fallHello traders, I want share with you my opinion about Euro. After forming an ascending channel, the price steadily moved higher and reached a local range area near 1.1850 points. However, once it entered this zone, the momentum faded. The market started showing signs of distribution, and we saw multiple attempts to push higher being rejected. This range acted as a cap, preventing further growth. Now, the price has pulled back and is trading near the current support level at 1.1700, which also coincides with the support area. This zone has already been tested several times, and each bounce has been weaker than the previous one. That suggests growing pressure from sellers. Looking at the broader structure, the price exited the previous triangle formation with an upward move, but now that impulse has exhausted. The rising wedge is also broken. Based on the behavior at resistance and the weakness around the current support, I expect a breakdown from the range and further decline toward TP 1 at 1.1500 points. If bearish pressure continues, the price could eventually reach the major buyer zone around 1.1345 - 1.1300 points. Given the weakening momentum, retests of support, and lack of bullish continuation, I remain bearish and anticipate a continuation of the downtrend. Please share this idea with your friends and click Boost 🚀
Disclaimer: As part of ThinkMarkets’ Influencer Program, I am sponsored to share and publish their charts in my analysis.
Euro H4 | Multi-swing-low support at 38.2% Fibonacci retracementThe Euro (EUR/USD) is falling towards a multi-swing-low support and could potentially bounce off this level to climb higher.
Buy entry is at 1.1684 which is a multi-swing-low support that aligns with the 38.2% Fibonacci retracement.
Stop loss is at 1.1570 which is a level that lies underneath an overlap support and the 61.8% Fibonacci retracement.
Take profit is at 1.1807 which is a swing-high resistance.
High Risk Investment Warning
Trading Forex/CFDs on margin carries a high level of risk and may not be suitable for all investors. Leverage can work against you.
Stratos Markets Limited (tradu.com ):
CFDs are complex instruments and come with a high risk of losing money rapidly due to leverage. 63% of retail investor accounts lose money when trading CFDs with this provider. You should consider whether you understand how CFDs work and whether you can afford to take the high risk of losing your money.
Stratos Europe Ltd (tradu.com ):
CFDs are complex instruments and come with a high risk of losing money rapidly due to leverage. 63% of retail investor accounts lose money when trading CFDs with this provider. You should consider whether you understand how CFDs work and whether you can afford to take the high risk of losing your money.
Stratos Global LLC (tradu.com ):
Losses can exceed deposits.
Please be advised that the information presented on TradingView is provided to Tradu (‘Company’, ‘we’) by a third-party provider (‘TFA Global Pte Ltd’). Please be reminded that you are solely responsible for the trading decisions on your account. There is a very high degree of risk involved in trading. Any information and/or content is intended entirely for research, educational and informational purposes only and does not constitute investment or consultation advice or investment strategy. The information is not tailored to the investment needs of any specific person and therefore does not involve a consideration of any of the investment objectives, financial situation or needs of any viewer that may receive it. Kindly also note that past performance is not a reliable indicator of future results. Actual results may differ materially from those anticipated in forward-looking or past performance statements. We assume no liability as to the accuracy or completeness of any of the information and/or content provided herein and the Company cannot be held responsible for any omission, mistake nor for any loss or damage including without limitation to any loss of profit which may arise from reliance on any information supplied by TFA Global Pte Ltd.
The speaker(s) is neither an employee, agent nor representative of Tradu and is therefore acting independently. The opinions given are their own, constitute general market commentary, and do not constitute the opinion or advice of Tradu or any form of personal or investment advice. Tradu neither endorses nor guarantees offerings of third-party speakers, nor is Tradu responsible for the content, veracity or opinions of third-party speakers, presenters or participants.

Sell the EURO vs USD?Welcome back to the Mid-Week Analysis for Wed, July 8th.
In this video, we will analyze the following FX markets:
EURO and USD Index.
The USD is seeing some strength off the tariffs Trump is declaring... and extending the grace period again on. This dragging down the EURO a bit, as it is printing bearish candles for Mond and Tues.
Will Wed print another bearish candle? Are we heading for a full retracement in the EURUSD?
This could be the scenario forming that I eluded to in my Weekly Forecast video: Buy The Dips and Sell The Rips.
Enjoy!
May profits be upon you.
Leave any questions or comments in the comment section.
I appreciate any feedback from my viewers!
Like and/or subscribe if you want more accurate analysis.
Thank you so much!
Disclaimer:
I do not provide personal investment advice and I am not a qualified licensed investment advisor.
All information found here, including any ideas, opinions, views, predictions, forecasts, commentaries, suggestions, expressed or implied herein, are for informational, entertainment or educational purposes only and should not be construed as personal investment advice. While the information provided is believed to be accurate, it may include errors or inaccuracies.
I will not and cannot be held liable for any actions you take as a result of anything you read here.
Conduct your own due diligence, or consult a licensed financial advisor or broker before making any and all investment decisions. Any investments, trades, speculations, or decisions made on the basis of any information found on this channel, expressed or implied herein, are committed at your own risk, financial or otherwise.

EURO to see a MAJOR DECLINE as US$ RALLIES The chart posted is that of the Euro as you can see the targets based on fib relationship was just seen ! I have moved LONG DXY 96.70 and will remain Long dxy until I see an ALT otherwise the DXY should rally into OCT 10th best of trades WAVETIMER

EURUSD Bounce on the 4H MA100 eyes 1.2000.The EURUSD pair has been trading within a Channel Up pattern since the May 12 Low. Right now it is expanding its 3rd Bearish Leg of this structure, with the previous two reaching at least either the 4H MA100 (green trend-line) or the 0.5 Fibonacci retracement level before rebounding.
As a result, we expect a rebound soon around the 1.16500 level to start the new Bullish Leg. The last two peaked on the 1.5 Fibonacci extension, which gives us a clear Target at 1.2000.
Notice also that every time the 4H MACD formed a Bullish Cross below the 0.0 mark, it was a confirmed buy signal. Use that to your advantage.
-------------------------------------------------------------------------------
** Please LIKE 👍, FOLLOW ✅, SHARE 🙌 and COMMENT ✍ if you enjoy this idea! Also share your ideas and charts in the comments section below! This is best way to keep it relevant, support us, keep the content here free and allow the idea to reach as many people as possible. **
-------------------------------------------------------------------------------
Disclosure: I am part of Trade Nation's Influencer program and receive a monthly fee for using their TradingView charts in my analysis.
💸💸💸💸💸💸
👇 👇 👇 👇 👇 👇

EURO - Price can continue to grow inside rising channelHi guys, this is my overview for EURUSD, feel free to check it and write your feedback in comments👊
The price traded in a flat range between $1.1500 and $1.1750 for an extended period, testing both extremes multiple times with low volatility and indecision.
A breakout above $1.1750 initially looked promising but turned into a fakeout when sellers quickly pushed the price back below $1.1725, trapping aggressive longs.
After that shakeout, buyers regained control and propelled EUR into a rising channel, marked by higher highs and higher lows since the end of June.
Price has since respected the lower boundary of this rising channel near $1.1725–$1.1750, using it as reliable support for continued gains.
With two confirmed breakouts and the channel structure intact, bullish momentum suggests the pair can extend its move higher within the channel.
I expect Euro to continue climbing toward the next key resistance at $1.1980, where the upper channel line and structural supply zone converge.
If this post is useful to you, you can support me with like/boost and advice in comments❤️
Disclaimer: As part of ThinkMarkets’ Influencer Program, I am sponsored to share and publish their charts in my analysis.

Euro can rebound up from support area to 1.1860 pointsHello traders, I want share with you my opinion about Euro. In this chart, we can see how the price has been moving confidently inside an upward channel after breaking out of a wedge formation. Previously, price consolidated within a narrowing wedge pattern above the buyer zone and broke upward, showing strong bullish momentum. That breakout initiated the current uptrend and led to the formation of a new support area. Now, price is pulling back from the resistance line of the channel and approaching this support area, which also coincides with the support line of the channel. This confluence increases the probability of a bullish reaction in this region. The structure suggests that buyers may step in around this level, preventing a deeper retracement. If the pair bounces off the support zone, I expect a continuation of the uptrend toward the upper boundary of the channel. For that reason, I set my TP at 1.1860 points, almost aligning with the resistance line of the channel. Given the current price action, the bullish structure, and strong reaction levels, I remain bullish and anticipate a rebound followed by further growth toward my target. Please share this idea with your friends and click Boost 🚀
Disclaimer: As part of ThinkMarkets’ Influencer Program, I am sponsored to share and publish their charts in my analysis.

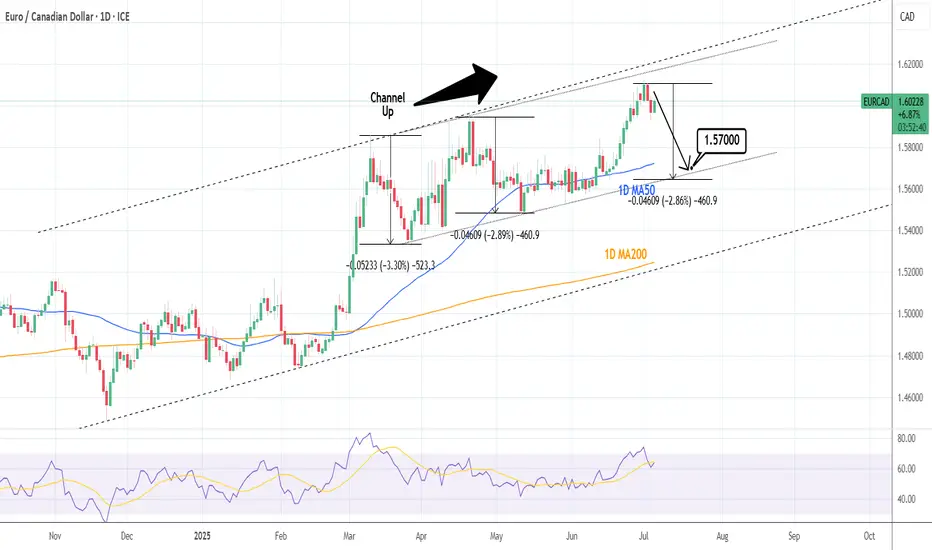
EURCAD: Sell signal on Double Channel Up Top.EURCAD is bullish on its 1D technical outlook (RSI = 63.955, MACD = 0.010, ADX = 41.562) having peaked on two Channel Up patterns at the same time. Technically it should now start the new bearish wave to test the bottom a little below the 1D MA50. Short, TP = 1.57000.
See how our prior idea has worked out:
## If you like our free content follow our profile to get more daily ideas. ##
## Comments and likes are greatly appreciated. ##
HelenP. I Euro may soon reverse and test support near $1.1655Hi folks today I'm prepared for you Euro analytics. If we look at the chart, EURUSD has been climbing steadily within an uptrend, bouncing multiple times from the trend line and making higher highs. However, despite the recent bullish structure, the pair is now showing signs of slowing momentum. The price is approaching a possible turning point near the top, and the latest candles show hesitation. Now the pair is trading near 1.1790 and still staying above the trend line, but I believe it may rise a bit more and then break down below the trend line. Once this structure is broken, I expect sellers to take control and push EURUSD toward the nearest support zone between 1.1655 and 1.1630 points. This zone acted as a key level in the past and may serve as the next area of interest for buyers. Given the extended movement and potential loss of bullish pressure, I remain bearish and expect EURUSD to move down to retest support. The level of 1.1655 is my current goal. If you like my analytics you may support me with your like/comment ❤️
Disclaimer: As part of ThinkMarkets’ Influencer Program, I am sponsored to share and publish their charts in my analysis.
EURO - After movement up, price will drop to support lineHi guys, this is my overview for EURUSD, feel free to check it and write your feedback in comments👊
Recently price started to grow inside a rising channel, where it some time traded below the support area and soon bounced up.
Price broke $1.1455 level and rose to the resistance line of the channel, after which it turned around and made correction movement.
Next, price some time traded near $1.1455 level and then bounced and continued to move up inside the channel.
In a short time Euro rose to $1.1700 level, which coincided with a support area, and some time trades between this level.
Then the price broke this level and continued to move up, until it almost reached the resistance line of the channel and started to fall.
Now, I think the Euro can rise a little and then continue to fall to $1.1610 support line of the channel, breaking $1.1700 level.
If this post is useful to you, you can support me with like/boost and advice in comments❤️
Disclaimer: As part of ThinkMarkets’ Influencer Program, I am sponsored to share and publish their charts in my analysis.
