Euro H4 | Potential bullish bounceThe Euro (EUR/USD) is falling towards a pullback support and could potentially bounce off this level to climb higher.
Buy entry is at 1.0800 which is a pullback support.
Stop loss is at 1.0757 which is a level that lies underneath a pullback support and the 61.8% Fibonacci retracement level.
Take profit is at 1.0866 which is a pullback resistance that aligns close to the 50.0% Fibonacci retracement level.
High Risk Investment Warning
Trading Forex/CFDs on margin carries a high level of risk and may not be suitable for all investors. Leverage can work against you.
Stratos Markets Limited (www.fxcm.com):
CFDs are complex instruments and come with a high risk of losing money rapidly due to leverage. 68% of retail investor accounts lose money when trading CFDs with this provider. You should consider whether you understand how CFDs work and whether you can afford to take the high risk of losing your money.
Stratos Europe Ltd, previously FXCM EU Ltd (www.fxcm.com):
CFDs are complex instruments and come with a high risk of losing money rapidly due to leverage. 73% of retail investor accounts lose money when trading CFDs with this provider. You should consider whether you understand how CFDs work and whether you can afford to take the high risk of losing your money.
Stratos Trading Pty. Limited (www.fxcm.com):
Trading FX/CFDs carries significant risks. FXCM AU (AFSL 309763), please read the Financial Services Guide, Product Disclosure Statement, Target Market Determination and Terms of Business at www.fxcm.com
Stratos Global LLC (www.fxcm.com):
Losses can exceed deposits.
Please be advised that the information presented on TradingView is provided to FXCM (‘Company’, ‘we’) by a third-party provider (‘TFA Global Pte Ltd’). Please be reminded that you are solely responsible for the trading decisions on your account. There is a very high degree of risk involved in trading. Any information and/or content is intended entirely for research, educational and informational purposes only and does not constitute investment or consultation advice or investment strategy. The information is not tailored to the investment needs of any specific person and therefore does not involve a consideration of any of the investment objectives, financial situation or needs of any viewer that may receive it. Kindly also note that past performance is not a reliable indicator of future results. Actual results may differ materially from those anticipated in forward-looking or past performance statements. We assume no liability as to the accuracy or completeness of any of the information and/or content provided herein and the Company cannot be held responsible for any omission, mistake nor for any loss or damage including without limitation to any loss of profit which may arise from reliance on any information supplied by TFA Global Pte Ltd.
The speaker(s) is neither an employee, agent nor representative of FXCM and is therefore acting independently. The opinions given are their own, constitute general market commentary, and do not constitute the opinion or advice of FXCM or any form of personal or investment advice. FXCM neither endorses nor guarantees offerings of third-party speakers, nor is FXCM responsible for the content, veracity or opinions of third-party speakers, presenters or participants.
Euro

Sign of overbought...Loss of momentum in EURCAD. Bear can make money after channel break.
Trade safe.
Good luck.

SHORT EURUSDEURUSD remains bearish on the daily timeframe and is currently in an ascending channel with a test at the upper channel, a failure to break above a major resistance area at 1.09-1.10 level, and a bearish daily engulfing candlestick pattern that would confirm its next movement.
The first target is to the lower channel at area 1.07 and if it breaks, the next target will be to the major support zone at area 1.05 and a break below will confirm a movement to the lower of the descending channel at near parity levels.

EURUSD Two clear sell entries.The EURUSD pair hit today its 4H MA200 (orange trend-line) for the first time since July 04 and immediately rebounded. As long as it holds, we expect a rebound to 1.0900 and then a rejection, as the long-term pattern is a Channel Up that has already priced its new Higher High (on July 17) and has started the new Bearish Leg.
If the 4H MA200 breaks first though, we will have a bearish break-out continuation confirmation. For both sell entries, our Target is 1.07300 (the 0.786 Fibonacci retracement level as on the June 14 Low).
-------------------------------------------------------------------------------
** Please LIKE 👍, FOLLOW ✅, SHARE 🙌 and COMMENT ✍ if you enjoy this idea! Also share your ideas and charts in the comments section below! This is best way to keep it relevant, support us, keep the content here free and allow the idea to reach as many people as possible. **
-------------------------------------------------------------------------------
💸💸💸💸💸💸
👇 👇 👇 👇 👇 👇

Euro can make small move up and then continue to fallHello traders, I want share with you my opinion about Euro. Looking at the chart, we can see how the price reached the resistance level, which coincided with the seller zone and at once rebounded down. Also, the price entered to triangle, where it at once made first a gap and then dropped until to support line, breaking the 1.0715 level. Next, the price some time traded between this level and later broke the 1.0715 level again and soon exited from the triangle, making a second gap also. After this movement, EUR started to grow inside the upward channel, where it in a short time reached the 1.0890 level and even broke it, making a third gap too. Next, the price reached the resistance line of the channel, after which turned around and dropped to the support line of the channel, breaking the resistance level one more time. Soon, the EUR exited from the channel and continued to decline, so, just now, I think that the Euro can make a small movement up and then continue to decline until to support level, but I set my TP near this level, at the 1.0740 points. Please share this idea with your friends and click Boost 🚀

EURJPY ShortFollowing the formation of two doji candlestick, which the latter did not close above the first one, I do anticipate that the price will continue with the bearish momentum, retracting to the weekly 0.2 fib level.
The entry position will be based on the outcome of the today's closing price as my proposal would be at 166.0 A detailed analysis using a shorter time frame will follow.

EURUSD 28/7/24This week in the EU, we are looking to meet a couple of key points. Overall, we are focusing on the price shifting back into the bearish higher timeframe trend. Currently, the price has been moving lower. We opened up a gap on the daily timeframe, indicating a likely drop. Since then, we have moved lower and created short-term liquidity lows, suggesting the price will sweep out these levels and continue its downward movement.
The key points we want to see met this week are as follows:
1. Price to sweep out one of our short-term highs and create a BOS (Break of Structure) downwards, giving us a clean sweep and break move.
2. We have an area of supply that we may tap into. If we reach this high, it would be ideal for short moves and selling positions.
3. If we tap into this supply and break higher, I will look for the daily high to be reached.
We are more inclined to see a sell move to follow the higher timeframe trend. The target for this short move is the demand zone marked in green and the liquidity low marked just above that zone. Ideally, this zone will fail, and the price will move lower. However, we may react at this zone and go higher. We will follow what the price shows us!
Follow your rules and stick to your plan!
Trade safe.

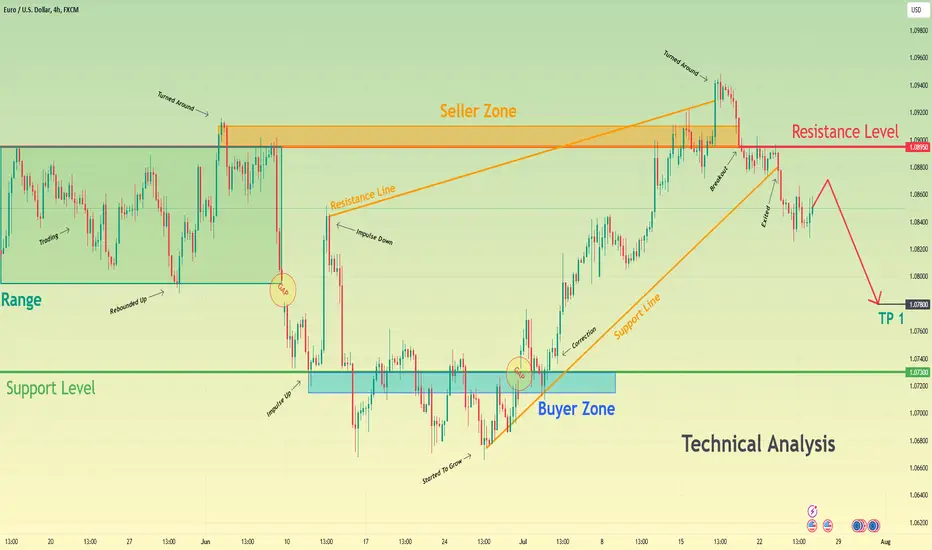
After exiting from wedge, Euro can continue to decline to 1.0780Hello traders, I want share with you my opinion about Euro. Observing the chart, we can see that the price some days ago entered to range, where it reached the top part, which coincided with the resistance level also and then started to decline. After the price dropped to almost the bottom part of the range, it turned around and rose until the seller zone, where it turned around and made a downward impulse to the support level, which coincided with the buyer zone, exiting from the range and making the first gap. After this, the Euro rebounded up from the 1.0730 level and entered to wedge, where it turned around and dropped from the resistance line to the support line, breaking the support level. Then price in a short time rose higher this level, breaking it and making a second gap, after which quickly rose to the resistance level. Next, the price broke this level and rose to the resistance line, after which EUR exited from the wedge, turned around, and dropped to the support line, breaking the 1.0895 level. Recently price also exited from the wedge and now continues to decline, so, in my opinion, the price can make a small movement up and then continue to fall. For this reason, I set my TP at 1.0780 points. Please share this idea with your friends and click Boost 🚀
EURCHF - Support Becomes ResistanceHello Traders !
The EURCHF broke the support level (0.96784 - 0.97000).
This key level becomes a new resistance level !
At the moment, the price formed a bearish double top pattern.
So, I predict a bearish move📉
____________
TARGET: 0.95865🎯

Euro H1 | Potential bearish breakoutThe Euro (EUR/USD) is falling towards a potential breakout level and could drop lower from here.
Sell entry is at 1.0828 which is a potential breakout level.
Stop loss is at 1.0860 which is a level that sits above a pullback resistance.
Take profit is at 1.0809 which is a pullback support that aligns close to the 127.2% Fibonacci extension level.
High Risk Investment Warning
Trading Forex/CFDs on margin carries a high level of risk and may not be suitable for all investors. Leverage can work against you.
Stratos Markets Limited (www.fxcm.com):
CFDs are complex instruments and come with a high risk of losing money rapidly due to leverage. 68% of retail investor accounts lose money when trading CFDs with this provider. You should consider whether you understand how CFDs work and whether you can afford to take the high risk of losing your money.
Stratos Europe Ltd, previously FXCM EU Ltd (www.fxcm.com):
CFDs are complex instruments and come with a high risk of losing money rapidly due to leverage. 73% of retail investor accounts lose money when trading CFDs with this provider. You should consider whether you understand how CFDs work and whether you can afford to take the high risk of losing your money.
Stratos Trading Pty. Limited (www.fxcm.com):
Trading FX/CFDs carries significant risks. FXCM AU (AFSL 309763), please read the Financial Services Guide, Product Disclosure Statement, Target Market Determination and Terms of Business at www.fxcm.com
Stratos Global LLC (www.fxcm.com):
Losses can exceed deposits.
Please be advised that the information presented on TradingView is provided to FXCM (‘Company’, ‘we’) by a third-party provider (‘TFA Global Pte Ltd’). Please be reminded that you are solely responsible for the trading decisions on your account. There is a very high degree of risk involved in trading. Any information and/or content is intended entirely for research, educational and informational purposes only and does not constitute investment or consultation advice or investment strategy. The information is not tailored to the investment needs of any specific person and therefore does not involve a consideration of any of the investment objectives, financial situation or needs of any viewer that may receive it. Kindly also note that past performance is not a reliable indicator of future results. Actual results may differ materially from those anticipated in forward-looking or past performance statements. We assume no liability as to the accuracy or completeness of any of the information and/or content provided herein and the Company cannot be held responsible for any omission, mistake nor for any loss or damage including without limitation to any loss of profit which may arise from reliance on any information supplied by TFA Global Pte Ltd.
The speaker(s) is neither an employee, agent nor representative of FXCM and is therefore acting independently. The opinions given are their own, constitute general market commentary, and do not constitute the opinion or advice of FXCM or any form of personal or investment advice. FXCM neither endorses nor guarantees offerings of third-party speakers, nor is FXCM responsible for the content, veracity or opinions of third-party speakers, presenters or participants.

EURNZD Loooong!Now that the price is retesting the 1.8 - 1.802 resistance zone, it might be converted to a support zone.
Entry position at 1.8085, target at 1.8325 and SL at 1.8

EURUSD Volatility ahead but bearish on a 1-month horizon.The EURUSD pair is pulling back as per our last week's trading plan (July 16, see chart below) and reached the bottom of the (dashed) Bullish Leg:
The long-term pattern remains a Channel Up but as mentioned last week, the current Bullish Leg is about to get exhausted. On the previous Bullish Leg it did on a Double Top. Regardless if that takes place or not eventually and creates volatility for the next 7 days, we expect a new Bearish Leg to start and lead to and end-of-August Higher Low. Our Target remains 1.07250.
On a side-note, the 1D RSI got rejected exactly before hitting the 70.00 overbought barrier, and the last 2 times that took place in 2024, it turned out to be the most optimal medium-term Sell Signal.
-------------------------------------------------------------------------------
** Please LIKE 👍, FOLLOW ✅, SHARE 🙌 and COMMENT ✍ if you enjoy this idea! Also share your ideas and charts in the comments section below! This is best way to keep it relevant, support us, keep the content here free and allow the idea to reach as many people as possible. **
-------------------------------------------------------------------------------
💸💸💸💸💸💸
👇 👇 👇 👇 👇 👇

EURJPY Looong!Following the breakout at the 0.5 fib level, as analysed in the previous post, it retested and the bullish momentum continued.
My entry point is at 171.9, target is at 174.4 and SL at 171.1
My R:R target is 1:3

Euro can break resistance level and continue rise in channelHello traders, I want share with you my opinion about Euro. Looking at the chart, we can see how the price a few moments ago rebounded from the support line and tried to grow, but failed and fell a little below. Then price in a short time rose to the resistance level, which coincided with the seller zone and resistance line, after which made a downward impulse to the support level, making a first gap. After this movement, the Euro rebounded from the support level, which coincided with the buyer zone and rose to the resistance line, but then it at once dropped lower than the 1.0725 level and reached the support line. Next, the price some time traded below the support level and later broke the resistance line, after which it turned around and fell back. Then EUR started to grow inside the upward channel, where it broke the 1.0725 level and formed another two gaps, after which broke the 1.0900 level and reached the resistance line of the channel. But recently Euro rebounded and fell below this level, breaking it again. For this reason, I think the price can break the resistance level and make a retest, after which continue to grow inside the upward channel. So, that's why I set my TP at 1.0980 points. Please share this idea with your friends and click Boost 🚀

Euro can start to decline from resistance line of upward channelHello traders, I want share with you my opinion about Euro. Observing the chart, we can see that the price started to grow inside the upward channel, where it at once declined to the support level, which coincided with the buyer zone and soon bounced up. Price in a short time rose to the current support level, which coincided with the resistance line of the channel with the support area, and then quickly fell to the support line of the upward channel. Then Euro reached the support area, after which turned around and made a downward impulse to the 1.0730 level, thereby exiting from the channel and forming a first gap. After this movement, the EUR tried to grow but failed and dropped lower than the 1.0730 level, thereby breaking it, but later price turned around and started to grow in another one upward channel. In this channel, the price soon broke the 1.0730 level and formed a second gap, after which made a retest and continued to move up. Later Euro rose to the current support level, broke it, making the last gap, and a not long time ago it rebounded up to the resistance line of the channel, where continues to trades very close to this day. So, I think the price can rebound down from the resistance line to the support line of the upward channel, breaking the support level. For this reason, I set my TP at 1.0835 points, which coincided with the support line of the channel. Please share this idea with your friends and click Boost 🚀

EURCAD Quick 3 Minute Trading Plans Pre CPICanada CPI will give the BOC a good indication on whether they are taking the right easing path.
Keen to cut, the EUR has gained strength recently continuing a mid term uptrend.
Levels remain higher, and can be noted for shorts. Exits lower.

AUDCHF - BEARISH RISING WEDGEHello Traders !
The EURCHF failed to create a new higher high
The price formed a rising wedge.
Currently, The support line is broken !
So, I predict a bearish move📉
____________
TARGET: 0.59780🎯

Euro H1 | Bullish uptrendThe Euro (EUR/USD) could fall towards a pullback support and potentially bounce off this level to climb higher.
Buy entry is at 1.0882 which is a pullback support.
Stop loss is at 1.0849 which is a level that lies underneath a pullback support and the 50.0% Fibonacci retracement level.
Take profit is at 1.0922 which is a pullback resistance.
High Risk Investment Warning
Trading Forex/CFDs on margin carries a high level of risk and may not be suitable for all investors. Leverage can work against you.
Stratos Markets Limited (www.fxcm.com):
CFDs are complex instruments and come with a high risk of losing money rapidly due to leverage. 68% of retail investor accounts lose money when trading CFDs with this provider. You should consider whether you understand how CFDs work and whether you can afford to take the high risk of losing your money.
Stratos Europe Ltd, previously FXCM EU Ltd (www.fxcm.com):
CFDs are complex instruments and come with a high risk of losing money rapidly due to leverage. 73% of retail investor accounts lose money when trading CFDs with this provider. You should consider whether you understand how CFDs work and whether you can afford to take the high risk of losing your money.
Stratos Trading Pty. Limited (www.fxcm.com):
Trading FX/CFDs carries significant risks. FXCM AU (AFSL 309763), please read the Financial Services Guide, Product Disclosure Statement, Target Market Determination and Terms of Business at www.fxcm.com
Stratos Global LLC (www.fxcm.com):
Losses can exceed deposits.
Please be advised that the information presented on TradingView is provided to FXCM (‘Company’, ‘we’) by a third-party provider (‘TFA Global Pte Ltd’). Please be reminded that you are solely responsible for the trading decisions on your account. There is a very high degree of risk involved in trading. Any information and/or content is intended entirely for research, educational and informational purposes only and does not constitute investment or consultation advice or investment strategy. The information is not tailored to the investment needs of any specific person and therefore does not involve a consideration of any of the investment objectives, financial situation or needs of any viewer that may receive it. Kindly also note that past performance is not a reliable indicator of future results. Actual results may differ materially from those anticipated in forward-looking or past performance statements. We assume no liability as to the accuracy or completeness of any of the information and/or content provided herein and the Company cannot be held responsible for any omission, mistake nor for any loss or damage including without limitation to any loss of profit which may arise from reliance on any information supplied by TFA Global Pte Ltd.
The speaker(s) is neither an employee, agent nor representative of FXCM and is therefore acting independently. The opinions given are their own, constitute general market commentary, and do not constitute the opinion or advice of FXCM or any form of personal or investment advice. FXCM neither endorses nor guarantees offerings of third-party speakers, nor is FXCM responsible for the content, veracity or opinions of third-party speakers, presenters or participants.

EURUSD Going for a Higher High rejection. Time the sell.The EURUSD pair has been trading within a Channel Up pattern and as we mentioned on our previous idea (July 08, see chart below), is aiming for a Higher High target at 1.09500:
Since last week, the price is getting closer to our Target and the top of the 3-month Channel Up. Based on the pattern's symmetry and the proportions between the Bullish/ Bearish Legs, once we reach 1.09500 we will reverse to a sell, targeting 1.07250 (bottom of Channel Up).
Technically, once the 4H RSI forms Higher Lows, the new bottom is formed.
-------------------------------------------------------------------------------
** Please LIKE 👍, FOLLOW ✅, SHARE 🙌 and COMMENT ✍ if you enjoy this idea! Also share your ideas and charts in the comments section below! This is best way to keep it relevant, support us, keep the content here free and allow the idea to reach as many people as possible. **
-------------------------------------------------------------------------------
💸💸💸💸💸💸
👇 👇 👇 👇 👇 👇

EURUSD - DailySimple trading - Consolidation
Let's take advantage of a potential Weekly swing!
Below is the weekly chart showing a potential zone for the price to bounce back and forth between the monthly highs and lows.
EURUSD has already poked above the previous week's high. wait for the price to pull back and test the PWH and we can sell confidently with strong bearish price rejection.
*These are my thoughts, not financial advice.

EURGBP Double ScenrioHello traders
Regarding the daily chart we are in a bearish channel, a upward reaction to the bottom of the chart was seen however 0.8490 was a strong zone that coincide with middle of channel and make prices lower!!
Mid term channel is bullish and we are around bottom of the channel, ready tp goes higher!
Regarding the current chart while the general trend is bearish we are bullish again! ready to jump up from bottom of the channel
Overall chance of rise is a little more
Bullish scenario will be activated after breaking the purple line
Bearish scenario will be activated after breaking the zone
Bulls powers: bottom of all three channel, reaction to the recent zone and bullish mid-term channel
Bears powers: short-term and long-term channels are bullish and we see a strong reaction to the long-term channel.

EURAUD Channel Down bottom = Buy opportunityThe EURAUD pair has been consolidating sideways for almost 3 weeks following the June 26 Low. Even though this is not near the bottom (Lower Lows trend-line) of the long-term (blue) Channel Down, the fact that it is being formed while the 1D RSI is on Higher Lows, indicates a Bullish Divergence.
The last such Divergence occurred on December 25 2023, when the pair formed the previous Lower Low (bottom). As a result, this is an opportunity to go long and target 1.64500 (+3.40% as the initial rise of the previous Bullish Leg).
-------------------------------------------------------------------------------
** Please LIKE 👍, FOLLOW ✅, SHARE 🙌 and COMMENT ✍ if you enjoy this idea! Also share your ideas and charts in the comments section below! This is best way to keep it relevant, support us, keep the content here free and allow the idea to reach as many people as possible. **
-------------------------------------------------------------------------------
💸💸💸💸💸💸
👇 👇 👇 👇 👇 👇

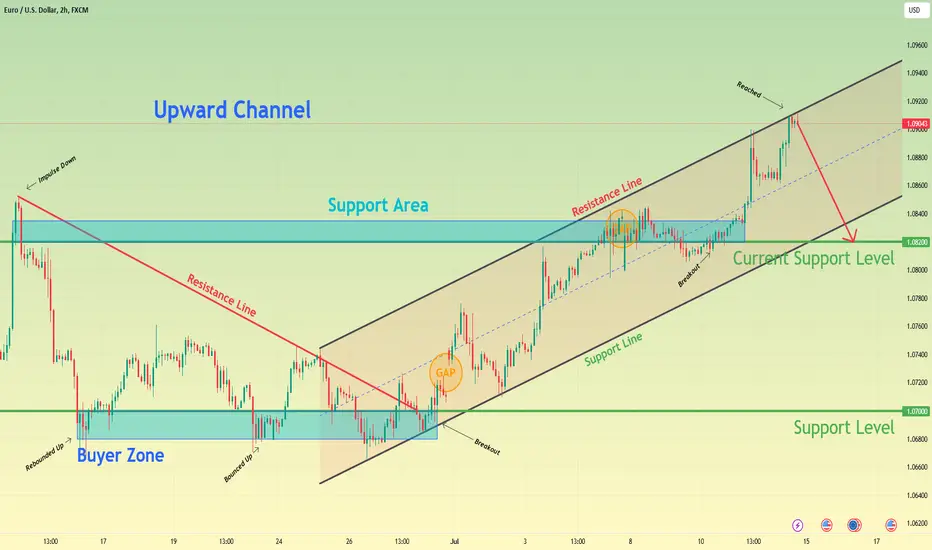
Euro can drop to support level, leaving upward channelHello traders, I want share with you my opinion about Euro. Looking at the chart, we can see how the price some days ago made impulse up to the resistance line, but soon turned around and dropped to the support level, which coincided with the buyer zone, breaking the 1.0820 level. After this movement, the price rebounded from the buyer zone and tried to grow, but soon turned around and fell back to the buyer zone. Then the price rose to the resistance line, but at once fell back, after which turned around and started to grow inside the upward channel, where it soon broke the resistance line with the 1.0700 level. In the channel, the price made two gaps and also later broke the 1.0820 level, which coincided with the support area. Price some time traded near this level and then rebounded up to the resistance line of the upward channel. At the moment, the Euro continues to trades near this line, so, in my opinion, the price can rebound from the resistance line of the channel and start to decline to the current support level, thereby exiting from the upward channel. For this reason, my TP is 1.0820 support level. Please share this idea with your friends and click Boost 🚀