Euro may rebound from support line of wegde and continue growHello traders, I want share with you my opinion about Euro. For a while, price was consolidating in a flat range, bouncing between support near 1.0735 and resistance close to 1.0950 points. The price showed multiple rejections from the buyer zone, indicating strong interest from bulls around that area. Eventually, this led to a breakout to the upside, accompanied by a sharp impulse movement. After the breakout, the pair formed a steady upward wedge pattern, where both support and resistance lines were respected. This pattern helped channel the bullish pressure, allowing the price to gradually push higher while also offering clear correction zones. One of those zones, the support area, is particularly important. Price bounced off this area again recently, signaling that buyers are still in control. The market is currently recovering from a local correction and showing early signs of continued growth, as visible from the bounce off the wedge's support line and the area around the current support level. Given this structure, the breakout from range, the formation of the wedge, and the consistent support reaction, I expect the Euro may to continue its movement upward. So, that's why I set my TP at 1.1550 points. Please share this idea with your friends and click Boost 🚀
Euro

EURO - Price can correct to support area and then bounce upHi guys, this is my overview for EURUSD, feel free to check it and write your feedback in comments👊
After consolidating in a broad range for several weeks, Euro made a strong breakout and entered an ascending channel.
The price respected this pattern twice, forming clear support and resistance touches, and confirming trend direction.
Most recently, the Euro surged and reached the upper boundary of the new rising channel, but quickly pulled back.
Currently, it’s testing the $1.1380 support area, which also aligns with the channel base, creating a confluence zone.
Given this context, I anticipate a bounce from this support and continuation of bullish structure toward $1.1670
This level represents the channel top and may act as the next key resistance zone.
If this post is useful to you, you can support me with like/boost and advice in comments❤️

Euro H4 | Pullback resistance at 50% Fibonacci retracementThe Euro (EUR/USD) is rising towards a pullback resistance and could potentially reverse off this level to drop lower.
Sell entry is at 1.1426 which is a pullback resistance that aligns close to the 50.0% Fibonacci retracement.
Stop loss is at 1.1583 which is a level that sits a swing-high resistance.
Take profit is at 1.1274 which is a swing-low support that aligns close to the 38.2% Fibonacci retracement.
High Risk Investment Warning
Trading Forex/CFDs on margin carries a high level of risk and may not be suitable for all investors. Leverage can work against you.
Stratos Markets Limited (tradu.com):
CFDs are complex instruments and come with a high risk of losing money rapidly due to leverage. 63% of retail investor accounts lose money when trading CFDs with this provider. You should consider whether you understand how CFDs work and whether you can afford to take the high risk of losing your money.
Stratos Europe Ltd (tradu.com):
CFDs are complex instruments and come with a high risk of losing money rapidly due to leverage. 63% of retail investor accounts lose money when trading CFDs with this provider. You should consider whether you understand how CFDs work and whether you can afford to take the high risk of losing your money.
Stratos Global LLC (tradu.com):
Losses can exceed deposits.
Please be advised that the information presented on TradingView is provided to Tradu (‘Company’, ‘we’) by a third-party provider (‘TFA Global Pte Ltd’). Please be reminded that you are solely responsible for the trading decisions on your account. There is a very high degree of risk involved in trading. Any information and/or content is intended entirely for research, educational and informational purposes only and does not constitute investment or consultation advice or investment strategy. The information is not tailored to the investment needs of any specific person and therefore does not involve a consideration of any of the investment objectives, financial situation or needs of any viewer that may receive it. Kindly also note that past performance is not a reliable indicator of future results. Actual results may differ materially from those anticipated in forward-looking or past performance statements. We assume no liability as to the accuracy or completeness of any of the information and/or content provided herein and the Company cannot be held responsible for any omission, mistake nor for any loss or damage including without limitation to any loss of profit which may arise from reliance on any information supplied by TFA Global Pte Ltd.
The speaker(s) is neither an employee, agent nor representative of Tradu and is therefore acting independently. The opinions given are their own, constitute general market commentary, and do not constitute the opinion or advice of Tradu or any form of personal or investment advice. Tradu neither endorses nor guarantees offerings of third-party speakers, nor is Tradu responsible for the content, veracity or opinions of third-party speakers, presenters or participants.

EURUSD - Understanding PriceIn this video I go through what has been happening with EURUSD in the past week, where price has reached, where it is likely going, what has happened yesterday and where we are possibly going to go to today. Pretty straight forward stuff using good ol' ICT concepts.
I hope you find this video insightful, because it's the truth of the markets.
Good luck and happy trading!
- R2F Trading

Euro can drop from top part of range and fall to support levelHello traders, I want share with you my opinion about Euro. Recently, price continued to grow inside a well-defined upward channel, maintaining a steady structure of higher highs and higher lows. The move started after a clear breakout from the buyer zone, which marked a strong bullish impulse and confirmed support near the 1.0735 level. After this breakout, the price gradually climbed, eventually entering a horizontal range, where it started to consolidate between local support and resistance. The current support level has held firm and now aligns with the lower boundary of the range as well as the support area. At the moment, the Euro is approaching the upper boundary of the range. Given the repeated reactions from this resistance zone, I expect the price to make one more push upward, retesting the top of the range, and then reverse downward toward the lower boundary, with TP1 set at 1.1270, where demand and structure are likely to react again. This short-term setup aligns with the current channel structure, the strength of the support area, and the repeated rejection from the range highs. Please share this idea with your friends and click Boost 🚀

+300/+500 pips EURJPY Swing Trade Setup H4 TF🏆 EURJPY Market Update H4 chart
📊 Technical Outlook
🔸trading in well defined range
🔸Short-term: BULLS final pump
🔸Mid-term: BEARS 158.00
🔸Status: REVERSAL from S/R
🔸163.50/165.00 heavy resistances
🔸158.00/156.00 key s/r zones below
🔸Price Target Bears: 158
🔸Price Target BULLS: 1140/1160
🔸strategy: SHORT SELL 163.50
🔸SL 75 pips TP1 +300 pips TP2 +500 pips
🔸swing trade setup for patient traders
📊 Forex Market Update (April 23, 2025)
🇪🇺 EUR/USD
📉 Price: ~1.1380
💪 Pressure from strong USD
🔻 Weak German PMI; ECB may cut rates
⚠️ Key Levels: Support 1.1300 | Resistance 1.1400
🇬🇧 GBP/USD
📉 Price: ~1.3300 (Down from 7-month high at 1.3424)
🇺🇸 USD rebound on Trump's comments
🏦 Market cautious on BoE policy
⚠️ Key Levels: Support 1.3280 | Resistance 1.3420
🇺🇸 DXY (US Dollar Index)
📈 Price: 99.18 (Recovering from recent low 97.92)
🗣️ Boosted by Trump reassurance on Fed leadership
⚠️ Remains pressured by trade tensions & Fed concerns
📌 Key Levels: Support 95, 90 | Resistance 101, 107
🔔 Market Volatility Alert: Watch for geopolitical updates & central bank news closely!

Trump back off and so does the EUROWith the recent news of Trump backing off of Tariff enforcement and his decision to not fire the FED chair, the the EURO waterfalls back down fast as the bears takeover! I'm holding off until I can find reliable support and looking at a price target around 1.26'ish.

EURUSD | Short‑Term Pullback Meets First Support ZoneI know a lot of you have been watching EURUSD closely. With recent developments, we could see a modest dip before the next leg up in the euro.
What’s Driving the Dollar
End of Market Indecision
As uncertainty fades, the dollar’s safe‑haven appeal eases. Investors feel more confident stepping into riskier assets.
U.S.–China Dialogue
News that the U.S. and China are ready to resume high‑level talks removes a huge overhang. Less trade‑war fear means less upward pressure on USD.
Solid Economic Data
Last week’s jobless claims and employment figures were far from recession‑level weakness. That supports the dollar in the near term.
Short‑Term Outlook
Putting these factors together, EURUSD may unwind some of its recent gains. Sellers could push price lower into the blue box, which marks our first support area.
Long‑Term Perspective
Even so, remember that President Trump’s ongoing policy surprises tend to rattle confidence in the dollar over time. Once this short‑term pullback is over, the euro stands to resume its broader uptrend.
How to Trade It
Wait for price to dip into the blue box
Look for lower‑time‑frame bullish breaks confirmed by CDV signals
Enter a long only when you see a clean structure shift and volume support
If price breaks below the blue box without a retest, stay out or reassess
This approach keeps risk tight and lets the market prove itself first. Many traders jump in too early. If you follow these steps, you’ll join the move with conviction rather than guesswork. I’ve built my track record by trading exactly this way—patiently and with clear confirmations. Stay tuned and let’s capture the next leg up together.
📌I keep my charts clean and simple because I believe clarity leads to better decisions.
📌My approach is built on years of experience and a solid track record. I don’t claim to know it all but I’m confident in my ability to spot high-probability setups.
📌If you would like to learn how to use the heatmap, cumulative volume delta and volume footprint techniques that I use below to determine very accurate demand regions, you can send me a private message. I help anyone who wants it completely free of charge.
🔑I have a long list of my proven technique below:
🎯 ZENUSDT.P: Patience & Profitability | %230 Reaction from the Sniper Entry
🐶 DOGEUSDT.P: Next Move
🎨 RENDERUSDT.P: Opportunity of the Month
💎 ETHUSDT.P: Where to Retrace
🟢 BNBUSDT.P: Potential Surge
📊 BTC Dominance: Reaction Zone
🌊 WAVESUSDT.P: Demand Zone Potential
🟣 UNIUSDT.P: Long-Term Trade
🔵 XRPUSDT.P: Entry Zones
🔗 LINKUSDT.P: Follow The River
📈 BTCUSDT.P: Two Key Demand Zones
🟩 POLUSDT: Bullish Momentum
🌟 PENDLEUSDT.P: Where Opportunity Meets Precision
🔥 BTCUSDT.P: Liquidation of Highly Leveraged Longs
🌊 SOLUSDT.P: SOL's Dip - Your Opportunity
🐸 1000PEPEUSDT.P: Prime Bounce Zone Unlocked
🚀 ETHUSDT.P: Set to Explode - Don't Miss This Game Changer
🤖 IQUSDT: Smart Plan
⚡️ PONDUSDT: A Trade Not Taken Is Better Than a Losing One
💼 STMXUSDT: 2 Buying Areas
🐢 TURBOUSDT: Buy Zones and Buyer Presence
🌍 ICPUSDT.P: Massive Upside Potential | Check the Trade Update For Seeing Results
🟠 IDEXUSDT: Spot Buy Area | %26 Profit if You Trade with MSB
📌 USUALUSDT: Buyers Are Active + %70 Profit in Total
🌟 FORTHUSDT: Sniper Entry +%26 Reaction
🐳 QKCUSDT: Sniper Entry +%57 Reaction
📊 BTC.D: Retest of Key Area Highly Likely
📊 XNOUSDT %80 Reaction with a Simple Blue Box!
📊 BELUSDT Amazing %120 Reaction!
I stopped adding to the list because it's kinda tiring to add 5-10 charts in every move but you can check my profile and see that it goes on..

EURUSD 3 TARGETS for selling 3 TOPS. The 5 year cheat-sheet!The EURUSD pair opened the week with a strong rally already due to the fundamentals surrounding the recent Tariff news. The 1W RSI is overbought at 74.00 and it hasn't been that high since January 22 2018. That was a long-term Top for EURUSD that initiated a 2-year downtrend until the March 2020 COVID crash and the start of massive rate hiking.
Even the last two times that the RSI came close to such overbought levels, the pair started a 6-month peak formation pattern with 3 Highs that offered solid short entries before the eventual larger downtrend. Those periods were January 30 2023 - July 17 2023 and August 31 2020 - May 24 2021.
Given that EURUSD is now trading within a long-term Channel Up (blue) and just formed a 1D MA50/ 1W MA50 Bullish Cross, we are closer to High (1) than not, since every time that is formed close to the standard +16.19% rise from the bottom.
For those successive Highs, our long-term sell targets will be 1.12500, 1.13250 and 1.12000 on the 0.382 Fibonacci retracement level respectively.
-------------------------------------------------------------------------------
** Please LIKE 👍, FOLLOW ✅, SHARE 🙌 and COMMENT ✍ if you enjoy this idea! Also share your ideas and charts in the comments section below! This is best way to keep it relevant, support us, keep the content here free and allow the idea to reach as many people as possible. **
-------------------------------------------------------------------------------
Disclosure: I am part of Trade Nation's Influencer program and receive a monthly fee for using their TradingView charts in my analysis.
💸💸💸💸💸💸
👇 👇 👇 👇 👇 👇

EURO - Price can fall to $1.1200 points, exiting from triangleHi guys, this is my overview for EURUSD, feel free to check it and write your feedback in comments👊
Price first broke out of a falling wedge pattern, kicking off a sharp rally that gained serious momentum.
The move ran into resistance at $1.1440, where price began stalling and transitioned into a triangle setup.
Since then, price has been wedged inside the triangle, testing highs but struggling to break convincingly.
The support trendline still holds, but each push upward is met with rejection near the resistance ceiling.
Momentum is fading, and with volume drying up, a downside move is becoming more likely from this zone.
I expect that the Euro can break lower from the triangle and fall to $1.1200 points in the upcoming sessions.
If this post is useful to you, you can support me with like/boost and advice in comments❤️

HelenP. I Euro can make correction movement to $1.1150 pointsHi folks today I'm prepared for you Euro analytics. After testing the upper boundary of the ascending channel, the price showed signs of slowing momentum. Earlier, the price steadily climbed within the upward channel, forming consistently higher lows while bouncing from the lower trend line and support zones. During its rally, the price also reclaimed the 1.0950 level, turning it into a solid support zone, and continued higher with minor consolidations along the way. Eventually, the pair reached the resistance trend line at the top of the channel, where sellers began to show activity. This zone aligned with previous local highs and acted as a point of reversal. Following the rejection from the top boundary, the Euro formed a local high and started to flatten, indicating reduced bullish pressure. Now the price is trading slightly below the resistance trend line and remains inside the upward channel. Given the current structure and the latest price action near the upper edge, I expect a downward movement from this zone. My current goal is the 1.1150 points, which aligns with the midline of the channel and a key technical level from recent consolidation. This bearish scenario is supported by the reaction from the upper boundary and the potential for correction within the channel range. If you like my analytics you may support me with your like/comment ❤️

Euro may correct to support area and then rebound upHello traders, I want share with you my opinion about Euro. Looking at the chart, we can see that the price started its growth from the buyer zone between 1.0730 - 1.0785 points, where the price found strong support near the lower boundary of the broadening wedge. After bouncing off that zone, Euro gained momentum and made an impulsive move upward, breaking through the resistance line and establishing a bullish trajectory. Once the pair overcame the 1.1265 level, which is now acting as current support, the price entered a period of consolidation inside the support area between 1.1310 - 1.1265 points. This zone is showing signs of strength again, with the price attempting to stabilize above it. The overall structure continues to respect the boundaries of the broadening wedge, with higher highs and higher lows confirming bullish control. At the moment, EUR is correcting slightly after reaching local highs and is approaching the support area again. A healthy pullback toward 1.1310 - 1.1265 would be in line with the pattern and could trigger the next bullish impulse. Given the ongoing upward structure, the strong support area, and the clear wedge formation, I expect Euro to continue growing toward the upper wedge boundary near 1.1555 points, which is my current TP1. Please share this idea with your friends and click Boost 🚀

EURO - Price can drop to $1.1200 points, exiting from pennantHi guys, this is my overview for EURUSD, feel free to check it and write your feedback in comments👊
Recently price traded inside a flat structure with weak movement and low volatility in a tight range.
Then the Euro made a breakout and formed a strong impulse, reaching resistance and creating a new local high.
After that, price entered a pennant and made a short correction, but then continued rising with momentum.
Later, it touched resistance again and started forming a triangle pattern with a tightening structure.
Now price is near the upper boundary of the triangle and trades above $1.1135 support without a clear breakout.
In my opinion, Euro can reverse from resistance and decline to $1.1200 in the next move, thereby exiting from pennant.
If this post is useful to you, you can support me with like/boost and advice in comments❤️

EUR/USD 3-Year Highs After 200-DMA SupportEUR/USD had pushed six consecutive days of losses after recoiling from Fiboancci resistance late last month. The 1.0943 level held two different resistance tests, with prices pulling back after the FOMC meeting saw Jerome Powell take a wait-and-see approach with regards to both inflation and possible rate cuts.
Normally, a backdrop like that would allow for a build of USD-strength, and we saw that show up as EUR/USD dropped down for a test of the 200-day moving average, but that's around when the weakness started to slow. Buyers responded in a big way and that led to a breakout and fresh three-year highs just a week later.
Notably, before those highs could print it was the same 1.0943 Fibonacci level that held support, and that has some relation to another key level that's so far held support for this week at 1.1275, which is the 61.8% retracement of the 2021-2022 major move.
At this point bulls have retained control of the pair and this week presented another couple of fundamental drivers that would seem to point at reversal, with a strong U.S. retail sales report, a Jerome Powell that sounded somewhat hawkish with inflation expectations around tariffs; and then the dovish ECB rate cut on Thursday. Despite all that - EUR/USD has held up fairly well and it's that deduction that illustrates bullish potential into next week.
For resistance - 1.1500 is huge. This was last in-play in early-2022 and it was resistance on multiple occasions before bears were able to take care of matters. So, chasing breakouts at the big figure could be challenging. Pullbacks could remain attractive and given the response to 1.1275, we can see where buyers had responded quickly to that. Of interest is the 1.1200 level that was hardened resistance in Q3 of last year, and then possibly even the 1.1100 level that held the highs earlier in April. For invalidation of trend, it's the 1.0900-1.0943 zone that I think remains of interest. - js

EUR/USD: Head, Shoulders, and a Whole Lotta Drama Oh, EUR/USD, you’re out here living your best life, hitting 1.14 on April 10, 2025, while the USD throws a tariff tantrum (Trump, you’re a mess 🤦♂️). A head and shoulders pattern is trying to gatecrash, with a left shoulder already set and the head still puffing up its ego. But the right shoulder? Nowhere in sight—drama TBD! 🎭
RSI’s giving “maybe chill” vibes after being overbought. 🥱 Central bank moves and trade talk chaos might clip your wings, and inflation fears aren’t helping. Will this H&S finish its glow-up, or are you heading for the stars? Traders, what’s your take—bearish breakup or EUR party? Drop your thoughts! ☕ #EURUSD #ForexDrama #TradingView

Euro may correct to support area and then continue to growHello traders, I want share with you my opinion about Euro. The price started its movement inside a tight upward channel, gradually rising from lower levels. After a steady climb, the Euro broke out of the channel with a strong impulse, entering a buyer zone between 1.0870 - 1.0910 points. This zone acted as a strong base, and from there, the pair accelerated upward, eventually reaching the upper boundary of a wide horizontal range. After multiple rejections near the range’s top, the pair finally made a breakout and exited above resistance, confirming the shift in momentum. The growth didn’t stop there - price continued its rally, reaching the current support area between 1.1320 - 1.1280 points, which now aligns with a strong horizontal level at 1.1280 points. This area was successfully retested and defended by buyers. Currently, the price is consolidating slightly above this support, forming a local correction after the recent impulse. As long as this structure holds and the support area remains intact, the bullish pressure is likely to resume. Given the breakout, the strong base from the buyer zone, and the bullish market structure, I expect the Euro to continue growing toward the 1.1550 level, which is marked as my current TP1. Please share this idea with your friends and click Boost 🚀

Euro H1 | Falling to a multi-swing-low supportThe Euro (EUR/USD) is falling towards a multi-swing-low support and could potentially bounce off this level to climb higher.
Buy entry is at 1.1270 which is a multi-swing-low support that aligns close to the 38.2% Fibonacci retracement.
Stop loss is at 1.1148 which is a level that lies underneath a swing-low support and the 50.0% Fibonacci retracement.
Take profit is at 1.1426 which is a multi-swing-high resistance.
High Risk Investment Warning
Trading Forex/CFDs on margin carries a high level of risk and may not be suitable for all investors. Leverage can work against you.
Stratos Markets Limited (tradu.com):
CFDs are complex instruments and come with a high risk of losing money rapidly due to leverage. 63% of retail investor accounts lose money when trading CFDs with this provider. You should consider whether you understand how CFDs work and whether you can afford to take the high risk of losing your money.
Stratos Europe Ltd (tradu.com):
CFDs are complex instruments and come with a high risk of losing money rapidly due to leverage. 63% of retail investor accounts lose money when trading CFDs with this provider. You should consider whether you understand how CFDs work and whether you can afford to take the high risk of losing your money.
Stratos Global LLC (tradu.com):
Losses can exceed deposits.
Please be advised that the information presented on TradingView is provided to Tradu (‘Company’, ‘we’) by a third-party provider (‘TFA Global Pte Ltd’). Please be reminded that you are solely responsible for the trading decisions on your account. There is a very high degree of risk involved in trading. Any information and/or content is intended entirely for research, educational and informational purposes only and does not constitute investment or consultation advice or investment strategy. The information is not tailored to the investment needs of any specific person and therefore does not involve a consideration of any of the investment objectives, financial situation or needs of any viewer that may receive it. Kindly also note that past performance is not a reliable indicator of future results. Actual results may differ materially from those anticipated in forward-looking or past performance statements. We assume no liability as to the accuracy or completeness of any of the information and/or content provided herein and the Company cannot be held responsible for any omission, mistake nor for any loss or damage including without limitation to any loss of profit which may arise from reliance on any information supplied by TFA Global Pte Ltd.
The speaker(s) is neither an employee, agent nor representative of Tradu and is therefore acting independently. The opinions given are their own, constitute general market commentary, and do not constitute the opinion or advice of Tradu or any form of personal or investment advice. Tradu neither endorses nor guarantees offerings of third-party speakers, nor is Tradu responsible for the content, veracity or opinions of third-party speakers, presenters or participants.

EUR/GBP – Trendline Break & Retest: Reversal Confirmed?Technical Outlook:
EUR/GBP has broken above the descending trendline and is now retesting it from above near 0.8540–0.8560. This zone is critical — holding it confirms a trend reversal. If successful, the next upside targets are 0.8625 and 0.8680. RSI remains above 50, and MACD continues to support bullish momentum.
Fundamentals:
Dovish expectations from the BoE weigh on the pound. The euro gains support from improving inflation outlook and capital inflows. Interest rate differentials now favor EUR.
Scenarios:
📈 Main: bounce from 0.8540–0.8560 → move to 0.8625 and 0.8680
📉 Alt: break below 0.8540 → retracement to 0.8500–0.8480

EURO - Price can rise a little more and then start to fallHi guys, this is my overview for EURUSD, feel free to check it and write your feedback in comments👊
Some time ago price moved inside a falling channel, slowly declining and bouncing from support to resistance.
Then EUR made a breakout, exited the channel, and started forming a rising wedge with clear bullish acceleration.
After a breakout, the price continued to grow and reached the upper boundary of the wedge pattern on the chart.
Recently Euro touched the resistance zone and showed a bounce from the local top near the wedge's upper edge.
Now it trades inside wedge formation and stays above support area near $1.1145 without strong momentum.
In my opinion, Euro can drop from current levels and reach $1.1150 zone as next support target soon.
If this post is useful to you, you can support me with like/boost and advice in comments❤️

EURJPY TO BREAK 2022 LOWThe ascending channel is the first sign that indicates that price have a high chance to break 2022 low. After price impulsively broke the channel price formed a continuation of which I expect an impulsive break to the downside.

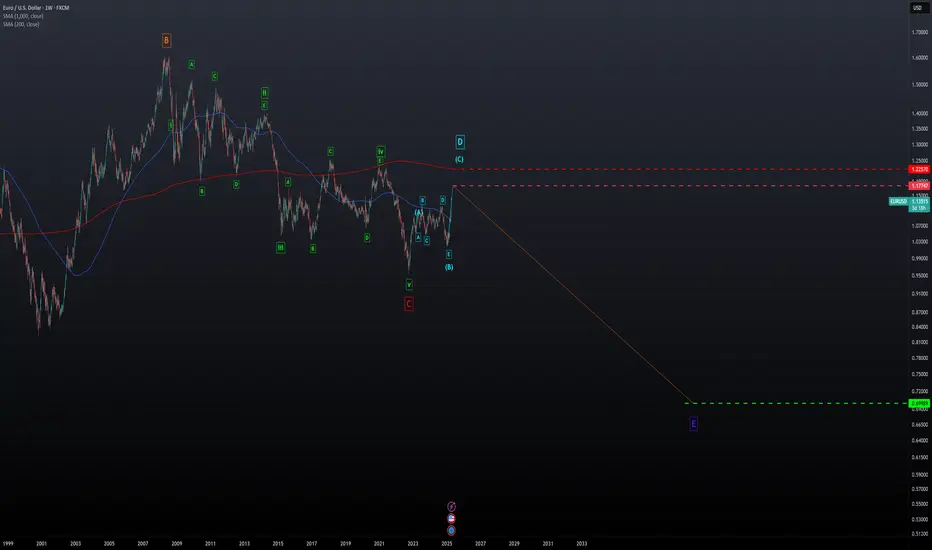
Euro Outlook: Final Push Before the Drop?According to AriasWave, the reason we haven’t seen the market roll over yet is because Wave D has been in play since 2022. I’m watching the 1.17747 level closely—once we hit that zone, I’m expecting a sharp reversal to the downside.
There’s also a chance we push up to 1.22570 to retest the 1000-period moving average on the weekly. Either way, the setup’s almost complete. My minimum downside target for the Euro is 0.70.
I believe a major economic slowdown is right around the corner. I’ll break it all down in today’s Market Update—covering the Euro, USD, Dow, S&P 500, and Bitcoin.
Stay tuned. And yeah—I’m back online after a weeklong ban. Let’s get to work.
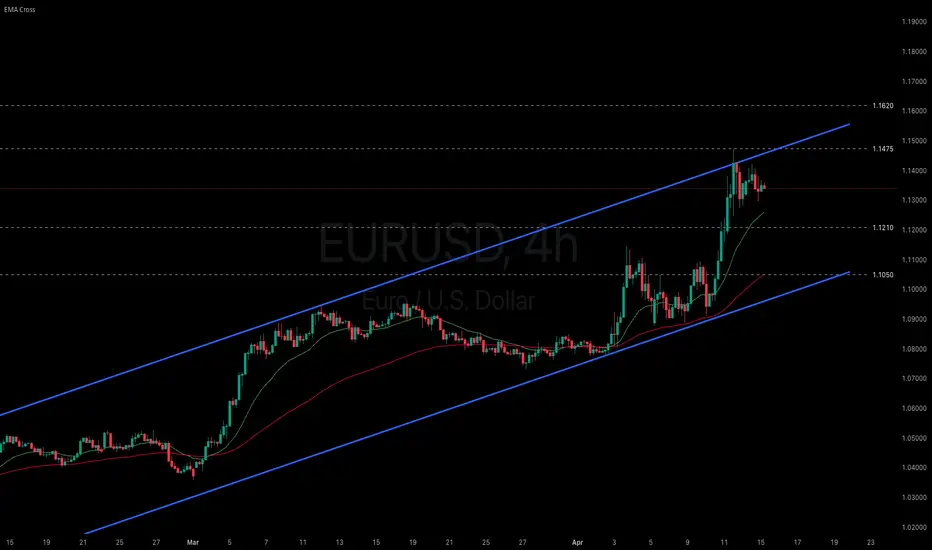
Will the persistent weak dollar help strengthen the euro?
The Trump administration announced a 90-day tariff reprieve and reciprocal exemptions on smartphones and semiconductors. However, President Trump denied that this constitutes a tariff exemption, stressing that duties on items such as semiconductors and pharmaceuticals will be reimposed.
Amid growing concerns over the impact of US tariff hikes on Eurozone growth, market sentiment has strengthened around the prospect of further ECB rate cuts. ECB President Christine Lagarde warned that the Trump administration’s aggressive tariff policy could destabilize European financial markets.
EURUSD has extended its sharp uptrend, testing the upper boundary of the ascending channel. The widening gap between both EMAs indicates a continued extension of bullish momentum. If EURUSD breaks above the channel’s upper bound, the price could advance toward the resistance at 1.1475. Conversely, if EURUSD falls below the support at 1.1210, the price may decline further toward 1.1050.
EURUSD Good sell opportunity on this short-term rejectionThe EURUSD pair got an initial rejection near its 2-month Higher Highs trend-line with the 4H RSI an a Bearish Divergence (Lower Highs) since April 03.
The last pull-back was -2.31% and made double contact with the 4H MA50 (blue trend-line) before rebounding. In fact all Higher Highs rejections hit at least he 4H MA50 before rebounding.
As a result, we see a strong short-term sell opportunity now, which even though could technically reach 1.12150 (-2.30% drop), it is advised to take profit once contact with the 4H MA50 is made.
-------------------------------------------------------------------------------
** Please LIKE 👍, FOLLOW ✅, SHARE 🙌 and COMMENT ✍ if you enjoy this idea! Also share your ideas and charts in the comments section below! This is best way to keep it relevant, support us, keep the content here free and allow the idea to reach as many people as possible. **
-------------------------------------------------------------------------------
Disclosure: I am part of Trade Nation's Influencer program and receive a monthly fee for using their TradingView charts in my analysis.
💸💸💸💸💸💸
👇 👇 👇 👇 👇 👇
