EURUSD Good sell opportunity on this short-term rejectionThe EURUSD pair got an initial rejection near its 2-month Higher Highs trend-line with the 4H RSI an a Bearish Divergence (Lower Highs) since April 03.
The last pull-back was -2.31% and made double contact with the 4H MA50 (blue trend-line) before rebounding. In fact all Higher Highs rejections hit at least he 4H MA50 before rebounding.
As a result, we see a strong short-term sell opportunity now, which even though could technically reach 1.12150 (-2.30% drop), it is advised to take profit once contact with the 4H MA50 is made.
-------------------------------------------------------------------------------
** Please LIKE 👍, FOLLOW ✅, SHARE 🙌 and COMMENT ✍ if you enjoy this idea! Also share your ideas and charts in the comments section below! This is best way to keep it relevant, support us, keep the content here free and allow the idea to reach as many people as possible. **
-------------------------------------------------------------------------------
Disclosure: I am part of Trade Nation's Influencer program and receive a monthly fee for using their TradingView charts in my analysis.
💸💸💸💸💸💸
👇 👇 👇 👇 👇 👇
Euro

ECB decision shadowed by tariff risk Markets will be closely watching the European Central Bank’s (ECB) interest rate decision on April 17, with expectations for a seventh consecutive rate cut.
Despite this expectation, the euro surged to a three-year high against the US dollar last week, as traders continued to pull away from US assets.
The dollar index has dropped 4% since President Trump’s “Liberation Day” tariff announcements on April 2, falling below the key 100 level too.
At this stage, market participants will be looking for any signals on how the ECB might respond to the potential spillover effects of President Trump’s tariff measures. While some guidance may emerge around already-announced policies, the risk of further unpredictability remains high.
Trump being Trump, it is perhaps unlikely we have seen the last of his volatility-inducing tariff announcements. This can weigh further on the dollar, eroding confidence in the world’s reserve currency.

HelenP. I Euro will decline to support zone, breaking trend lineHi folks today I'm prepared for you Euro analytics. After breaking out from a long consolidation phase, the Euro entered a strong upward trend supported by a clearly defined trend line. This breakout was backed by strong momentum, allowing the price to push above Support 1 and climb rapidly. However, after reaching the 1.1450 area, bullish strength started fading. The market printed a sharp rejection from the highs, and soon after, the price broke back below the trend line. This breakdown signals a shift in sentiment. The price is now approaching the previous support zone between 1.1160 and 1.1120 points, which acted as a key accumulation area during the bullish move. The reaction from this zone will be crucial, but considering the breakdown from the trend line and the aggressive rejection from the top, sellers now appear to be in control. Currently, EUR is trading below the broken trend line, and bearish pressure continues to build. Given the rejection from higher levels, structure break, and weak recovery attempts, I expect EURUSD to decline toward my current goal at 1.1160 points. If you like my analytics you may support me with your like/comment ❤️

EURO - Price can make correction and then continue to move upHi guys, this is my overview for EURUSD, feel free to check it and write your feedback in comments👊
Some days ago price broke resistance and started a strong upward impulse, exiting from a flat accumulation zone.
After this breakout, the Euro made a sharp rise and formed a rising wedge pattern.
Then price reached the upper boundary of a wedge and bounced down, testing the support line of the pattern.
Recently, it touched the support zone near the $1.0800 level and then bounced with recovery toward resistance.
Now price trades inside wedge, holding above support line and forming bullish continuation structure.
In my opinion, Euro can continue to grow and reach $1.1185 resistance line of the wedge soon.
If this post is useful to you, you can support me with like/boost and advice in comments❤️

FX Liquidity 'Worse Than Covid' Amid Tariff Shock. Long EUR/USD?Liquidity Seizes Up: Dealers Report Conditions 'Worse Than Covid' Amid Tariff Turmoil
The intricate plumbing of the global foreign exchange market, typically the world's deepest and most liquid financial arena, experienced a severe blockage in recent days, with dealers reporting liquidity conditions even more challenging than during the peak of the Covid-19 crisis in early 2020. Triggered by the sudden announcement of potential sweeping tariffs by former US President Donald Trump, the ability to execute large trades without significantly moving prices evaporated, creating treacherous conditions for market participants before a temporary pause on the tariff implementation offered a brief respite.
Reports indicate that available liquidity for a single transaction, or "clip," in major currency pairs plummeted to lows around $20 million. While this figure might still sound substantial, it represents a dramatic reduction from the norms in the multi-trillion dollar-a-day spot FX market, where clips of $50 million, $100 million, or even more could typically be absorbed with minimal market impact, especially in benchmark pairs like EUR/USD.
This liquidity drought occurred paradoxically alongside a spike in overall trading volumes. Both algorithmic trading systems and human traders on principal desks were highly active, reacting to the news flow and heightened volatility. However, this surge in activity masked a fundamental deterioration in market quality. High volume accompanied by low liquidity signifies frantic, often smaller, trades occurring across widening bid-ask spreads, with market makers unwilling or unable to provide firm quotes for substantial sizes. It's the market equivalent of a crowded room where everyone is shouting, but no one is willing to make a firm commitment.
Why 'Worse Than Covid'? Unpacking Dealer Sentiment
The comparison to the Covid-19 crisis is stark and revealing. The initial wave of the pandemic in March 2020 caused unprecedented volatility across all asset classes as the world grappled with lockdowns and economic shutdowns. FX liquidity certainly suffered then, with spreads widening dramatically. However, dealers suggest the current environment, driven by tariff uncertainty, felt different, and arguably worse, for several reasons:
1. Nature of the Shock: Covid-19, while devastating, was primarily a health crisis with economic consequences. Central banks globally responded with massive, coordinated liquidity injections and policy easing, providing a clear backstop (even if the initial shock was severe). The tariff announcement, however, represents a political and policy shock. Its potential impact is multifaceted – affecting inflation, growth, supply chains, corporate earnings, and international relations – and far harder to model. The policy path forward, including potential retaliation from other countries, is deeply uncertain.
2. Central Bank Reaction Function: During Covid, the playbook for central banks was relatively clear: provide liquidity and ease financial conditions. In response to potential tariffs, the central bank reaction is much less certain. Tariffs could be inflationary (raising import costs), potentially pushing central banks towards tighter policy, while simultaneously being negative for growth, which might argue for easing. This ambiguity makes it harder for markets to price in a predictable policy response, adding another layer of uncertainty that dampens risk appetite and liquidity provision.
3. Fundamental Uncertainty vs. Panic: While Covid induced panic, the underlying driver was identifiable. The tariff threat introduces deep uncertainty about the fundamental rules of global trade. This makes it exceptionally difficult for market makers, who provide liquidity, to price risk accurately. When risk becomes unquantifiable, the natural reaction is to withdraw, reduce quote sizes, and widen spreads significantly to avoid being caught on the wrong side of a large, unhedged position.
The Tariff Trigger: A Wrench in the Works
Donald Trump's proposal for a "reciprocal" or blanket tariff system, potentially starting at 10% on all imports with higher rates for specific countries, fundamentally challenges the existing global trade framework. The announcement immediately forced market participants to reassess:
• Inflation Outlook: Tariffs directly increase the cost of imported goods, potentially fueling inflation and impacting interest rate expectations.
• Economic Growth: Trade wars can disrupt supply chains, raise business costs, reduce export competitiveness (due to retaliation), and dampen consumer and business confidence, weighing on growth.
• Currency Valuations: Currencies of countries heavily reliant on exports to the US, or those potentially facing steep retaliatory tariffs, came under pressure. The US dollar itself experienced volatility as markets weighed the inflationary impact against the potential growth slowdown and risk-aversion flows.
This complex interplay of factors, combined with the political uncertainty surrounding the implementation and potential scope of such policies, created a perfect storm for volatility. Algorithmic systems, programmed based on historical correlations and data, struggled to navigate a potential regime shift driven by policy pronouncements. Human traders, facing heightened risk and uncertainty, became more cautious. Liquidity providers, facing the risk of being adversely selected (i.e., only trading when the market is about to move sharply against them), drastically reduced their exposure.
The Impact: Beyond the Trading Desks
The evaporation of liquidity has real-world consequences:
• Increased Transaction Costs: Corporates needing to hedge currency exposure for international trade face higher costs (wider spreads).
• Execution Risk: Asset managers rebalancing global portfolios find it harder and more expensive to execute large trades, potentially suffering significant slippage (the difference between the expected execution price and the actual price).
• Systemic Risk: In highly leveraged markets, poor liquidity can exacerbate sell-offs. Margin calls, as reportedly seen alongside the tariff news, can force leveraged players to liquidate positions rapidly into an illiquid market, potentially triggering a domino effect.
The temporary pause in the tariff implementation announced subsequently provided some relief, likely allowing liquidity to recover partially from the extreme lows. However, the underlying uncertainty hasn't disappeared. Until there is greater clarity on the future direction of US trade policy, the FX market is likely to remain susceptible to bouts of nervousness and reduced liquidity.
Should You Long EUR/USD Based on This? A Cautious No.
While the liquidity situation is dire and reflects significant market stress, using poor FX liquidity itself as a primary reason to take a directional view, such as longing EUR/USD, is generally flawed logic.
Here's why:
1. Liquidity is Not Direction: Market liquidity reflects the ease and cost of transacting, not necessarily the fundamental direction of an asset price. Poor liquidity is a symptom of high volatility, uncertainty, and risk aversion. While these factors can influence currency direction (e.g., risk aversion often benefits perceived safe-haven currencies), the liquidity state itself isn't the driver. Both buyers and sellers face the same poor liquidity.
2. Universal Impact: The reported liquidity crunch affected the global spot FX market. While specific pairs might have been hit harder at times, the underlying issue was broad-based risk aversion and dealer pullback, impacting EUR/USD, USD/JPY, GBP/USD, and others. It doesn't inherently favor the Euro over the Dollar.
3. Focus on Fundamentals and Sentiment: A decision to long EUR/USD should be based on a broader analysis of:
o Relative Monetary Policy: Expectations for the European Central Bank (ECB) versus the US Federal Reserve (Fed).
o Economic Outlook: Growth prospects in the Eurozone versus the United States.
o Risk Sentiment: Is the broader market mood risk-on (often favoring EUR) or risk-off (which can sometimes favor USD, though the tariff news complicated this)?
o Tariff Impact Analysis: How would the proposed tariffs, if implemented, differentially impact the Eurozone and US economies? Would potential EU retaliation harm the US more, or vice-versa?
4. Increased Trading Risk: Poor liquidity makes any trade riskier and more expensive. Spreads are wider, meaning entry and exit costs are higher. Slippage on stop-loss orders or take-profit orders is more likely. Executing large sizes is challenging. Therefore, even if you have a strong fundamental view to long EUR/USD, the current liquidity environment makes executing and managing that trade significantly more difficult and costly.
Conclusion
The recent seizure in FX liquidity, reportedly surpassing the severity seen during the Covid crisis onset, underscores the market's extreme sensitivity to geopolitical and policy uncertainty. The threat of sweeping tariffs injected a level of unpredictability that forced liquidity providers to retreat, even amidst high trading volumes. While the temporary pause offers breathing room, the fragility remains. For traders, this environment demands heightened caution, smaller position sizes, and wider stop-losses. Critically, basing directional trades like longing EUR/USD solely on the state of market liquidity is misguided. Such decisions must stem from a thorough analysis of economic fundamentals, policy outlooks, and risk sentiment, while acknowledging that poor liquidity significantly raises the cost and risk of executing any strategy.

EUR/JPY Continues to Oscillate Within a Broad Sideways RangeThe euro has appreciated more than 1.5% against the Japanese yen over the last two sessions, and the growing bullish momentum in EUR/JPY has been driven mainly by renewed confidence in the euro following the recent weakness in the U.S. dollar. Additionally, the yen has come under downward pressure due to a reduction in safe-haven demand, prompted by Trump’s recent comments suggesting a pause in most tariffs targeting dozens of countries previously threatened in recent weeks. As the trade situation begins to stabilize, bullish pressure on EUR/JPY could become increasingly relevant in the short term.
Broad Sideways Range:
Since early August, a key sideways channel has taken shape, with resistance near 164.879 and support at 156.576. The price has tested both levels on multiple occasions but has so far failed to break out of this long-standing range. For now, this remains the most important technical formation to watch in upcoming trading sessions.
MACD:
The MACD histogram has approached the zero line and could be setting up for a bullish crossover, which may signal that the moving average momentum is starting to shift in favor of buying pressure. As the histogram moves further away from the neutral level, bullish momentum may gain even more significance on the chart.
TRIX:
The TRIX indicator line continues to oscillate above the zero line, indicating a prevailing bullish impulse. If the line continues to rise, this could lead to a stronger bullish momentum developing in the short term.
Key Levels:
164.879 – Upper Range Resistance: This level marks the top of the broad sideways channel and remains the most important resistance in the short term. Price action near this area may continue to reinforce bullish sentiment and could pave the way for a short-term uptrend.
160.655 – Near Support: A mid-range barrier that aligns with the 100-period simple moving average. Continued price action near this level may reinforce the current neutral range, keeping the existing structure intact.
156.576 – Major Support: This level corresponds to the lowest prices in recent months. A clear breakdown below this level could trigger a relevant bearish breakout, opening the door to a new downward trend.
By Julian Pineda, CFA – Market Analyst

EURCHF: Strong bearish waveEURCHF is bearish on its 1D technical outlook (RSI = 32.579, MACD = -0.004, ADX = 41.175) being on a strong bearish wave inside its Channel Down. We estimate to complete a symmetric -8.33% decline from the top, as the previous wave did (TP = 0.91100).
See how our prior idea has worked out:
## If you like our free content follow our profile to get more daily ideas. ##
## Comments and likes are greatly appreciated. ##

EURUSD - NEW BREAKOUTHello Traders !
The EURUSD price broke the resistance level (1.09548 - 1.09150).
This key level becomes new support !
So, I expect a bullish move🚀
_______________
TARGET: 1.11580🎯

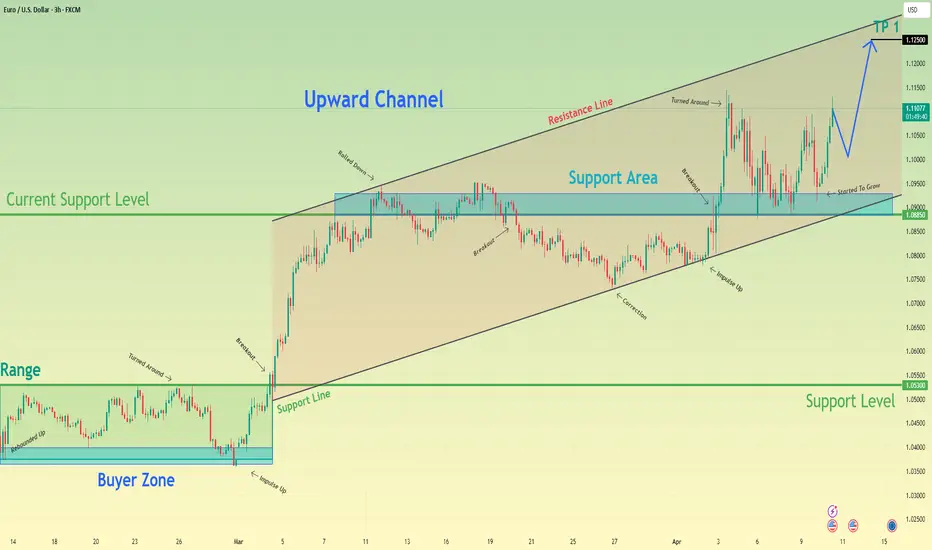
Euro may continue to move up inside upward channelHello traders, I want share with you my opinion about Euro. We can see how the pair spent a long time inside a wide range, repeatedly testing the buyer zone between 1.0365 - 1.0400 points. After multiple rebounds and false breakouts, Euro finally broke through the resistance and started forming a strong upward channel. The bullish structure was further confirmed when the price respected the support line of the channel and created a new higher low near 1.0885, which now acts as the current support level. This level also coincides with the bottom of the seller zone, which was recently flipped into support. Price reacted with a sharp impulse up, breaking the consolidation range and confirming continued bullish pressure. Now Euro is approaching the middle of the channel and gaining strength again. I expect the pair to make a slight pull-back to the support area, followed by a continuation of the upward trend toward TP1 - 1.1250 points, which aligns with the upper boundary of the channel. As long as EUR remains above 1.0885 points and respects the bullish structure, I’m looking for another leg higher. The chart structure supports the bullish case, and the upward momentum is clearly in play. Please share this idea with your friends and click Boost 🚀
Euro Steady as EU Retaliates on TariffsThe euro hovered around 1.0980 on Thursday, supported by rising trade tensions and renewed political stability in the Eurozone. Sentiment favored the currency after China raised tariffs on all U.S. goods to 84% from 34%, retaliating against Washington’s hike to 104% on Chinese imports. The European Commission also approved retaliatory tariffs on €21 billion worth of U.S. goods, including soybeans, motorcycles, and orange juice. The escalation pushed investors away from typical safe havens like the dollar and Treasuries. Political stability in Germany further supported the euro, as the CDU/CSU and SPD finalized a coalition, clearing the way for Friedrich Merz to become Chancellor next month. The ECB is also expected to cut rates by 25 basis points later this month.
Key resistance is at 1.1020, followed by 1.1100 and 1.1150. Support lies at 1.0880, then 1.0810 and 1.0730.

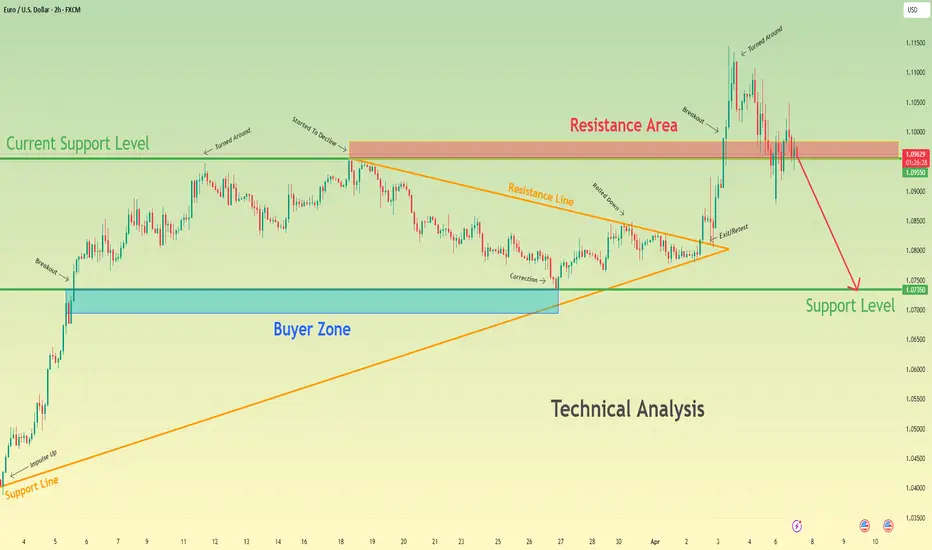
Euro will break current support level and drop to 1.0735 levelHello traders, I want share with you my opinion about Euro. Recently, the price completed a pennant pattern, which resulted in a breakout to the upside. This breakout, however, didn’t gain much ground - the movement quickly lost momentum inside the resistance area between 1.0955 - 1.0985 points, where Euro sharply turned around. The reversal from this zone wasn’t unexpected, considering this level had already acted as resistance earlier. What followed was a clean break below the current support level at 1.0955 points, which shifted the market structure back to bearish. Now the price is trading lower, and the bearish impulse looks set to continue. My expectation is a further decline toward the support level at 1.0735, which also aligns with the buyer zone between 1.0695 - 1.0735 points. This level may act as the next potential area of interest where buyers could attempt a defence. The invalidation of local support, weakness after the breakout, and strong supply reaction from resistance all point to a high probability of continuation down toward TP 1 - 1.0735 level. Please share this idea with your friends and click Boost 🚀
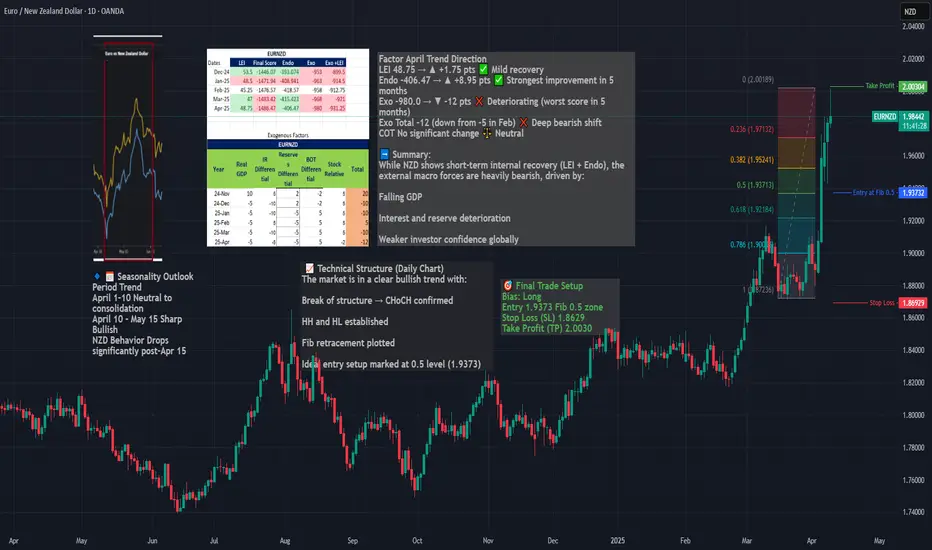
Long EURNZD – Seasonal, Fundamentals & Technical ConfluenceWe are entering a long position on EURNZD, capitalizing on a powerful confluence of:
Seasonal EUR strength + NZD weakness (April 10 – May 15)
A clear bullish market structure (CHoCH, HH/HL)
A clean Fibonacci retracement entry at 0.5
Strong macro divergence, with NZD exogenous conditions deteriorating
Macro & Seasonal Context
EUR enters a strong seasonal uptrend from April 10 to end of month
NZD shows seasonal weakness from April 15 onward
NZD’s exogenous model score worsened to -12 in April
While NZD LEI and endo improved, it remains structurally weak
Timing
Best execution: on pullback to 1.9373 zone, ideally between April 10–15, aligned with seasonal entry window.
EURCAD Buy signal on 2023 fractal.It's been too long since we last looked on the EURCAD pair (November 29 2024, see chart below) but it delivered nonetheless our 1.500 Target:
Thit time the price is consolidating after a strong February rally and posts a similar pattern to October 2022 - January 2023. The 1D RSI sequences between those fractals are identical and it is not technically unreasonable to expect again the bullish trend to be resumed and target the 1.382 Fibonacci extension at 1.62500.
-------------------------------------------------------------------------------
** Please LIKE 👍, FOLLOW ✅, SHARE 🙌 and COMMENT ✍ if you enjoy this idea! Also share your ideas and charts in the comments section below! This is best way to keep it relevant, support us, keep the content here free and allow the idea to reach as many people as possible. **
-------------------------------------------------------------------------------
💸💸💸💸💸💸
👇 👇 👇 👇 👇 👇

EURO - Price can bounce from resistance area to $1.0850 pointsHi guys, this is my overview for EURUSD, feel free to check it and write your feedback in comments👊
A not long time ago price moved inside a falling channel and showed weak activity with limited growth attempts.
Later Euro made a breakout, exited the channel, and started to form a new bullish structure near resistance.
After that, price made a sharp upward impulse, touching $1.1010 resistance and forming a pennant pattern.
Recently, it broke the lower border of pennant and tested $1.0990 level from below, then bounced down.
Now price trades under local resistance area and holds below broken trendline with weak upward attempts.
In my opinion, Euro can continue to decline and reach $1.0850 support level in the upcoming sessions.
If this post is useful to you, you can support me with like/boost and advice in comments❤️

EUR/AUD H1 | Heading into resistanceEUR/AUD is rising towards a pullback resistance and could potentially reverse off this level to drop lower.
Sell entry is at 1.8198 which is a pullback resistance that aligns with the 38.2% Fibonacci retracement.
Stop loss is at 1.8320 which is a level that sits above the 78.6% Fibonacci retracement and a swing-high resistance.
Take profit is at 1.7877 which is a swing-low support.
High Risk Investment Warning
Trading Forex/CFDs on margin carries a high level of risk and may not be suitable for all investors. Leverage can work against you.
Stratos Markets Limited (www.fxcm.com):
CFDs are complex instruments and come with a high risk of losing money rapidly due to leverage. 63% of retail investor accounts lose money when trading CFDs with this provider. You should consider whether you understand how CFDs work and whether you can afford to take the high risk of losing your money.
Stratos Europe Ltd (www.fxcm.com):
CFDs are complex instruments and come with a high risk of losing money rapidly due to leverage. 63% of retail investor accounts lose money when trading CFDs with this provider. You should consider whether you understand how CFDs work and whether you can afford to take the high risk of losing your money.
Stratos Trading Pty. Limited (www.fxcm.com):
Trading FX/CFDs carries significant risks. FXCM AU (AFSL 309763), please read the Financial Services Guide, Product Disclosure Statement, Target Market Determination and Terms of Business at www.fxcm.com
Stratos Global LLC (www.fxcm.com):
Losses can exceed deposits.
Please be advised that the information presented on TradingView is provided to FXCM (‘Company’, ‘we’) by a third-party provider (‘TFA Global Pte Ltd’). Please be reminded that you are solely responsible for the trading decisions on your account. There is a very high degree of risk involved in trading. Any information and/or content is intended entirely for research, educational and informational purposes only and does not constitute investment or consultation advice or investment strategy. The information is not tailored to the investment needs of any specific person and therefore does not involve a consideration of any of the investment objectives, financial situation or needs of any viewer that may receive it. Kindly also note that past performance is not a reliable indicator of future results. Actual results may differ materially from those anticipated in forward-looking or past performance statements. We assume no liability as to the accuracy or completeness of any of the information and/or content provided herein and the Company cannot be held responsible for any omission, mistake nor for any loss or damage including without limitation to any loss of profit which may arise from reliance on any information supplied by TFA Global Pte Ltd.
The speaker(s) is neither an employee, agent nor representative of FXCM and is therefore acting independently. The opinions given are their own, constitute general market commentary, and do not constitute the opinion or advice of FXCM or any form of personal or investment advice. FXCM neither endorses nor guarantees offerings of third-party speakers, nor is FXCM responsible for the content, veracity or opinions of third-party speakers, presenters or participants.

Fundamental Market Analysis for April 8, 2025 EURUSDAfter a tense week in which the US fully adopted a protectionist trade policy - despite lacking the necessary industrial infrastructure - tariffs on imports were imposed. The US now applies a general 10 per cent import tax on all goods from each country, as well as various ‘reciprocal’ tariffs calculated by dividing US imports by exports. After imposing a 34 per cent tariff on Chinese products, China responded with its own 34 per cent tariff on all goods imported from the US. Unable to find alternative solutions, the Trump administration threatened to impose an additional 50 per cent tariff on all Chinese goods, which is set to take effect on April 8.
US data takes centre stage again this week, with the release of Consumer Price Index (CPI) data on Thursday. On Friday, producer price index (PPI) data and the University of Michigan (UoM) consumer sentiment survey are expected.
Investors are raising bets that the Federal Reserve (Fed) will begin cutting interest rates to reduce recession risks. Markets are factoring in nearly 200 basis points of rate cuts through the end of 2025, despite the Fed issuing cautious policy statements indicating that trade uncertainty complicates any potential rate cut.
Trade recommendation: SELL 1.0950, SL 1.1030, TP 1.0830

Going Long on the EuroFX:EURUSD
The trend is up, has gapped down to support area and bounce back, still looking like it could continue higher.
Going in with a tight stop, looking to make a quick profit next week.
Good luck to you

EURUSD reached a 20-month Resistance. Potential for heavy sell.The EURUSD pair has almost hit the Lower Highs trend-line that started on the July 18 2023 High and immediately got rejected. The Resistance Zone that connects the last 3 major Highs within a 20-month span, follows the same pattern, especially with the 1D RSI Lower Highs peak formation.
Right now we are on the Lower High rejection, which on the previous three peaks hit initially the Support 1 level and then at least the Higher Lows trend-line (if not lower). As a result, we expect heavy selling to start on EURUSD, targeting 1.0730 and 1.0500 in succession.
-------------------------------------------------------------------------------
** Please LIKE 👍, FOLLOW ✅, SHARE 🙌 and COMMENT ✍ if you enjoy this idea! Also share your ideas and charts in the comments section below! This is best way to keep it relevant, support us, keep the content here free and allow the idea to reach as many people as possible. **
-------------------------------------------------------------------------------
Disclosure: I am part of Trade Nation's Influencer program and receive a monthly fee for using their TradingView charts in my analysis.
💸💸💸💸💸💸
👇 👇 👇 👇 👇 👇

+300 pips EURUSD swing trade setup SELL HIGH🏆 EURUSD Market Update
📊 Technical Outlook
🔸Short-term: BULLS 1150
🔸Mid-term: BEARS 0670
🔸Status: REVERSAL from S/R
🔸0660/0680 normal pullback
🔸BULLS will max out at 1150
🔸Price Target Bears: 0660/0680
🔸Price Target BULLS: 1140/1160
📊 Forex Market Update – April 7, 2025
🇪🇺 EUR/USD
🔹 Reclaims the 1.1000 level amid fresh USD weakness
🔹 Driven by EU-U.S. trade tensions & global recession fears
🔹 📈 Almost Completed a cup & handle formation
🇬🇧 GBP/USD
🔹 Holding gains above 1.2900 after rebounding from 1.2830
🔹 Supported by USD sell-off & BoE-Fed policy divergence
🔹 🛑 Risk-off sentiment & dip-buying helped push the pair higher

Blueprint for Becoming a Successful Forex Trader in 2025🚀 Blueprint to Becoming a Successful Forex Trader in 2025: Leveraging ICT, Automation, and Prop Funding
Here’s a detailed, actionable blueprint designed to position you for success by carefully navigating broker selection, adopting advanced trading strategies, obtaining prop funding, and integrating automation and AI technologies into your trading.
🏦 Broker Selection (Actionable Steps)
🔍 Choose brokers with true ECN/STP execution
⚡ Ensure brokers offer low spreads (0.0-0.2 pip average) and fast execution to maximize ICT precision entries.
🛡️ Prioritize brokers regulated by ASIC, FCA, or FSCA with verified Myfxbook execution reports.
📊 Confirm broker compatibility with MetaTrader 4 (MT4) to seamlessly integrate Expert Advisors (EAs).
💳 Check for flexible withdrawal/deposit methods and swift payouts (Crypto, Wise, Revolut).
🎯 Trading Strategy (ICT Concepts & Supply-Demand Zones)
🧠 Master ICT Concepts: Liquidity sweeps, Order Blocks (OB), Fair Value Gaps (FVG), Market Structure Breaks (MSB).
📍 Combine ICT with Supply-Demand: Identify institutional supply-demand zones aligning with ICT Order Blocks & liquidity areas.
📐 Execute High-Probability Setups: Trade only after liquidity grabs at key daily/weekly ICT points, avoiding retail traps.
📈 Time & Price Theory: Trade London Kill Zones and New York Open exclusively, exploiting predictable ICT volatility.
📆 Weekly Preparation: Annotate D1/H4 charts on weekends marking liquidity points, order blocks, and premium/discount zones clearly.
💰 Getting Prop Funding (Actionable Approach)
🥇 Target reputable prop firms (FTMO, MyForexFunds, The Funded Trader, 8cap, etc) with clear and attainable evaluation objectives.
📑 Use ICT trading style for evaluation: lower-frequency, high-probability trades with clearly defined risks.
🎯 Implement strict risk management rules: never exceed 1% risk per trade, aiming for steady account growth (5-10% monthly target).
📊 Monitor performance closely using provided analytics dashboards (e.g., FTMO Metrics App) and adapt accordingly.
📚 Diversify funded accounts across multiple firms, compounding total available trading capital while reducing firm-specific risk.
⚙️ Automating & Executing Trades (MT4 EA & Bots)
🛠️ Hire experienced MQL4 developers to code custom ICT-based MT4 Expert Advisors
🤖 Develop EAs specifically around ICT logic (Order Block detection, liquidity grabs, market structure shifts) and or supply/demand logic
🤖 use advanced algo based breakout EAs for automation
📌 Automate trade management: EAs should handle entry precision, partial exits, break-even stops, and trail stops.
📡 Set EAs on VPS Hosting (NY4, LD4) for optimal latency and consistent execution (ForexVPS, AccuWeb Hosting).
📈 Regularly perform forward-testing and optimization of EAs on demo accounts before live deployment (at least quarterly optimization).
📲 Integrating Advanced Bots and Technology in 2025
📊 Combine your MT4 EAs with third-party analytics platforms for detailed trade performance insights.
🔮 Incorporate AI-based forecasting tools to refine ICT setups and trade signals.
🔔 Use automated bots for real-time alerts on ICT-based setups via Telegram or Discord channels.
🧑💻 Maintain manual oversight for discretionary ICT decisions—use automation for entry efficiency, not blind reliance.
🔄 Continuously retrain and update your bot’s logic monthly using the most recent trade data, ensuring adaptive execution.
🗓️ Daily Routine for Success
🌅 Pre-session (30 mins): Review annotated charts, ICT concepts (liquidity, OB, FVG), and supply-demand levels.
💻 During trading session: Monitor EA execution, manually adjust positions based on real-time ICT setups.
📝 Post-session (15 mins): Journal trades meticulously in detail, noting ICT reasoning behind wins and losses.
📆 Weekly review: Assess overall ICT & EA performance—adjust EA parameters as needed to match evolving market conditions.
📚 Continuous learning: Keep updated on advanced ICT framework,
supply demand zone trading.
📌 Final Actionable Advice for 2025
🔍 Specialize intensely on ICT & supply-demand concepts rather than multiple strategies—depth over breadth.
🚩 Always adapt and evolve your trading algorithms to ICT methodology—market dynamics continually change.
🧘 Maintain emotional discipline and patience, relying on high-probability setups to steadily compound your account.
💡 Stay ahead by embracing technology: automation, AI-driven forecasting, and custom ICT tools will provide a significant edge in 2025.

HelenP. I Euro will rise a little and then drop to support levelHi folks today I'm prepared for you Euro analytics. After breaking the structure of the previous downtrend, Euro showed a powerful bullish impulse, which allowed the price to exit the downward channel and move confidently higher. This breakout was supported by the trend line, which began to act as dynamic support throughout the rise. The bullish movement reached a local high near the 1.11 area before losing momentum. Soon after reaching that high, the price began to decline, pulling back to the area of the trend line and testing the support zone between 1.0950 and 1.0970. This zone aligns with Support 1 at the 1.0950 level and was already tested multiple times in recent price action. Although the trend line provided some temporary support, the strength of buyers has clearly faded. Currently, EUR/USD is trading just above the trend line, but price action suggests pressure is shifting back to the downside. Given the rejection from higher levels and the repeated tests of support, I expect the pair to decline further toward the 1.0950 target — my current goal. If you like my analytics you may support me with your like/comment ❤️

Euro will rise a little more and then make correction to 1.0950Hello traders, I want share with you my opinion about Euro. Earlier, the price started to grow from the lower region near 1.0730, where it bounced off the buyer zone between 1.0690–1.0730 points and entered a strong upward movement. This impulse helped Euro break through previous resistances and approach the upper boundary of the support area, which lies between 1.0950–1.0990 points. After reaching a local high, the price formed a pennant pattern, consolidating within narrowing trend lines while respecting both the support and resistance structure. During this phase, the pair remained stable, building pressure before making the next move. Recently, EUR made a strong breakout to the upside, exiting the pennant and continuing its bullish rally. The price surged rapidly and now trades above the current support level at 1.0950, reaching fresh highs in this local trend. I expect the price to reverse soon from the current overbought region and begin a decline toward the support area, which now acts as a potential pullback zone. My target for this corrective movement is the 1.0950 level, which aligns perfectly with the current support level and the upper boundary of the support zone. Please share this idea with your friends and click Boost 🚀

SHORT ON EUR/USDEUR/USD has finally given a change of character to the downside and is currently pulling back into a supply area.
The dollar is gaining strength due to Tariffs and looks like it will rise.
I will be selling EUR/USD with a sell limit order looking to catch over 200-300 pips over the next few days.
