Market Analysis: EUR/USD Trims GainsMarket Analysis: EUR/USD Trims Gains
EUR/USD started a downside correction from the 1.1450 resistance.
Important Takeaways for EUR/USD Analysis Today
- The Euro struggled to clear the 1.1450 resistance and declined against the US Dollar.
- There was a break below a key bullish trend line with support at 1.1395 on the hourly chart of EUR/USD at FXOpen.
EUR/USD Technical Analysis
On the hourly chart of EUR/USD at FXOpen, the pair gained pace for a move above the 1.1300 zone, as mentioned in the previous analysis. The Euro tested the 1.1450 resistance and recently corrected gains against the US Dollar.
The pair dipped below 1.1400. There was a break below a key bullish trend line with support at 1.1395. It even traded below the 23.6% Fib retracement level of the upward move from the 1.1209 swing low to the 1.1454 high.
The pair is showing some bearish signs, and upside potential might remain limited. Immediate resistance is near the 50-hour simple moving average at 1.1395.
The next major resistance is near the 1.1450 zone. An upside break above the 1.1450 level might send the pair toward the 1.1500 resistance. Any more gains might open the doors for a move toward the 1.1550 level.
On the downside, immediate support on the EUR/USD chart is seen near the 50% Fib retracement level of the upward move from the 1.1209 swing low to the 1.1454 high at 1.1330. The next major support is near the 1.1300 level. A downside break below the 1.1300 support could send the pair toward the 1.1210 level.
This article represents the opinion of the Companies operating under the FXOpen brand only. It is not to be construed as an offer, solicitation, or recommendation with respect to products and services provided by the Companies operating under the FXOpen brand, nor is it to be considered financial advice.
Eurodollar

Stronger U.S. JOLTS Data Pressures EURUSD!!!EURUSD ( FX:EURUSD ) failed to break the Resistance zone($1.1487-$1.1424) and started to fall again , breaking the Support lines .
In terms of Elliott Wave theory , it seems that EURUSD has managed to complete the main wave X of the Double Three Correction(WXY) structure .
Just moments ago, the U.S. JOLTS Job Openings data was released.
-------------------------------
Actual: 7.39M
Forecast: 7.11M
Previous: 7.19M
The stronger-than-expected JOLTS figure at 7.39 million signals a resilient labor market. This reduces recession fears and increases the likelihood that the Federal Reserve may keep interest rates elevated for longer.
Bullish for the U.S. Dollar( TVC:DXY )
Bearish pressure could hit EURUSD, especially if it's approaching the key resistance zone.
-------------------------------
I expect EURUSD to start to fall again after the pullback to the Support lines and to fall to the targets I have specified on the chart.
Note: If EURUSD touches $1.14580(Stop Loss(SL)), we can expect a failure of the Resistance zone($1.1487-$1.1424).
Please respect each other's ideas and express them politely if you agree or disagree.
Euro/U.S. Dollar Analyze (EURUSD), 1-hour time frame.
Be sure to follow the updated ideas.
Do not forget to put a Stop loss for your positions (For every position you want to open).
Please follow your strategy and updates; this is just my Idea, and I will gladly see your ideas in this post.
Please do not forget the ✅' like '✅ button 🙏😊 & Share it with your friends; thanks, and Trade safe.

EUR/USD Rises to 4-Week HighEUR/USD Rises to 4-Week High
As shown on the EUR/USD chart today, the euro rose to a 4-week high against the US dollar this morning.
The euro's strength relative to the US dollar is supported by traders’ expectations ahead of the ECB's interest rate decision, scheduled for Thursday at 15:15 GMT+3.
This upcoming event is notable not only because the ECB is expected to cut rates from 2.40% to 2.15% (for the seventh consecutive time), but also due to the broader context shaped by ECB President Christine Lagarde’s recent remarks on the euro’s status as a reserve currency.
At the same time, the US dollar is weakening amid growing trade concerns—on Friday, the US President Donald Trump announced plans to double tariffs on steel and aluminum to 50%. He also accused China of breaching the recent trade truce.
Technical Analysis of the EUR/USD Chart
Seven days ago, when analysing the EUR/USD chart, we:
→ observed bullish sentiment;
→ highlighted the importance of the 1.1400 resistance level;
→ suggested that bears might attempt to strike back.
Since then, the price has pulled back from the mentioned level (as indicated by the arrow), but found support at the lower boundary of the ascending channel. The current bullish momentum could push EUR/USD towards the psychological level of 1.1500 during the week ahead.
This article represents the opinion of the Companies operating under the FXOpen brand only. It is not to be construed as an offer, solicitation, or recommendation with respect to products and services provided by the Companies operating under the FXOpen brand, nor is it to be considered financial advice.

Fundamental Market Analysis for June 2, 2025 EURUSDEUR/USD is recovering its recent losses recorded during the previous session, trading around 1.13700 on Monday during Asian hours. The pair is strengthening amid a weakening US dollar (USD) after the US Court of Appeals ruled on Thursday to allow US President Donald Trump's tariffs to take effect.
On Wednesday, a panel of three judges at the International Trade Court in Manhattan said Trump had exceeded his authority by imposing broad import tariffs and ruled the orders issued on April 2 illegal.
On Friday, President Trump said at a rally in Pennsylvania that he plans to double import tariffs on steel and aluminum to increase pressure on global steel producers and escalate the trade war. “We are going to impose a 25 percent increase. We are going to raise tariffs on steel imported into the United States from 25 percent to 50 percent, which will further strengthen the steel industry in the United States,” he said, according to Reuters.
On Saturday, the European Commission (EC) warned that Europe is ready to respond to President Trump's plan to double tariffs on imported steel and aluminum, which would escalate the trade war between the world's two largest economic powers.
Trading recommendation: BUY 1.13600, SL 1.13200, TP 1.14200

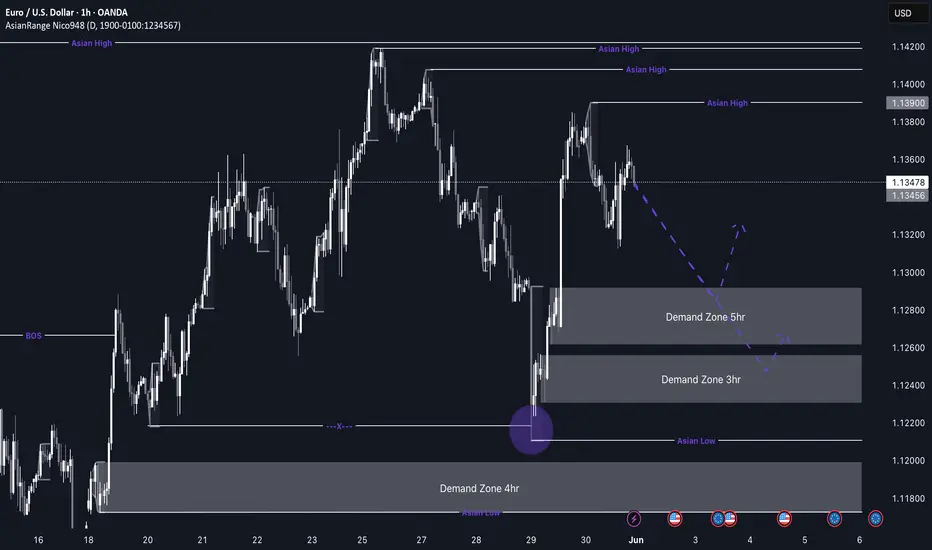
EUR/USD Potential longs to the upsideEU Weekly Outlook — Bullish Pro-Trend Setup in Focus
This week, my EU analysis is centered around the pro-trend movement to the upside. Price has recently broken structure and in doing so, has left behind clean demand zones on the 5H and 3H timeframes. I’ll be watching closely to see when price decides to mitigate these levels for a potential long setup.
Since price is still a bit far from these zones, short-term sells may be possible, but with no strong nearby supply, I’ll be staying patient and letting price action guide me. The key is to avoid marrying any one bias and remain adaptable.
Confluences for EU Buys:
- Strong bullish structure on higher timeframes
- Clean and unmitigated 5H and 3H demand zones
- Plenty of liquidity above, including Asia highs
- This is a pro-trend trade, aligning with market flow
- DXY analysis supports a bullish EU outlook
P.S. If price shifts and breaks structure to the downside, then we could consider short-term sell setups — but for now, I’m focused on the long opportunity forming from demand.
Have a great trading week and stay sharp! 🧠💹
EUR/USD Daily Chart Analysis For Week of May 30, 2025Technical Analysis and Outlook:
The Eurodollar has experienced significant volatility during this week's trading session. It reached a significant Mean Resistance level at 1.142 while also encountering Mean Support at a target of 1.122. Recent analyses suggest that the Euro is likely to revisit the critical target of 1.142, which includes Key Resistance at 1.151 and the completed Outer Currency Rally at 1.157. However, there is a potential for a downward correction from the current level, which could lead to prices retesting the Mean Support of 1.122. There is also a possibility for further declines, reaching the Outer Currency Dip at 1.108.

EUR/USD Drifts Lower as Dollar ReboundsEUR/USD is struggling to hold onto Thursday’s rebound from the 1.1200 region—its lowest in nearly 10 days—and trades with a slight bearish bias in Friday’s Asian session. The pair is hovering near the mid-1.1300s, down around 0.15% on the day.
The US Dollar regained some ground due to renewed safe-haven demand after a federal appeals court reinstated former President Trump’s broad trade tariffs, injecting fresh uncertainty into the markets. However, the dollar’s momentum remains limited by concerns over the US fiscal outlook and expectations of Fed rate cuts in 2025.
The euro finds partial support as Trump postponed tariffs on EU imports. Market focus now shifts to the upcoming US PCE inflation data, which may influence Fed policy expectations, followed by next Thursday’s ECB meeting for further direction.
Resistance is seen at 1.1400, with higher levels at 1.1460 and 1.1500. Support is located at 1.1300, followed by 1.1260 and 1.1210.

EUR/USD) breakout Analysis Read The ChaptianSMC trading point update
Technical analysis for EUR/USD (Euro/US Dollar) on a 3-hour timeframe presents a bearish outlook. Here's a breakdown of the key ideas and elements in the analysis:
---
1. Breakdown of Rising Channel
Ascending Channel: Price was moving upward within a clearly defined channel.
Breakout: The price broke below the ascending channel, indicating a potential trend reversal or correction.
---
2. Resistance Zone (Yellow Box)
Multiple Rejections: Red arrows mark points of rejection from the resistance area.
“Breakout” Label: Indicates this area was previously a support that turned into resistance after the price dropped below it.
---
3. EMA 200
The 200 EMA is plotted and the price is trading slightly above it, but very close.
A break and sustained movement below the 200 EMA would typically support a bearish trend continuation.
---
4. Bearish Projection
Downward Zigzag Path: Implies an expected short-term correction followed by further decline.
Target Points:
First target: 1.11307
Second, more extended target: 1.10639
---
5. RSI (Relative Strength Index)
Current Value: Around 38.84, which is near the oversold region (30).
Bearish Momentum: RSI is trending downwards, suggesting strengthening bearish momentum.
---
6. Fundamental Events
Multiple icons at the bottom (e.g., flags, calendar) indicate upcoming economic events/news which could influence volatility and confirm or invalidate the move.
Mr SMC Trading point
---
Conclusion:
This analysis suggests a bearish short- to medium-term outlook for EUR/USD, especially if price confirms a break below the 200 EMA. The resistance zone (around 1.133–1.135) is now seen as a supply zone, and the targets are around 1.113 and 1.106.
---
Suggestions/Considerations:
Watch the 200 EMA: A solid break below it would reinforce the bearish bias.
Monitor Fundamentals: U.S. and Eurozone economic news could heavily impact price action.
RSI Oversold Caution: If RSI dips further, a bounce might occur before full target completion.
Pales support boost 🚀 analysis follow)

Fundamental Market Analysis for May 28, 2025 EURUSDThe EUR/USD pair retreated below 1.1400 for the second consecutive day, helped by a recovery in the US Dollar (USD) following the release of a positive consumer confidence report.
Risk appetite increased as market participants digested the news that US President Donald Trump said that trade talks between the United States (US) and the European Union (EU) have gained momentum following his threats to impose 50 percent tariffs last Friday. Although he backtracked on his words, allowing some room for negotiations, it remains to be seen if the two sides will reach an agreement before July 9.
The convincing US consumer confidence data for May released by the Conference Board (CB) put pressure on EUR/USD. The US Dollar Index (DXY), which tracks the value of the US currency against the other six currencies, rose more than 0.62% to 99.54.
The ECB's Gediminas Simkus said he sees scope for an “interest rate cut in June”. Robert Holzmann, a member of Austria's central bank and a member of the ECB, told the Financial Times (FT) that he sees no reason to cut rates at the June and July policy meetings.
Trade recommendation: SELL 1.1265, SL 1.1365, TP 1.1065

Euro Nears $1.14 as Dollar is PressuredEUR/USD climbed to $1.1395, approaching a one-month high as the dollar softened amid mounting U.S. fiscal concerns and uncertainty over Trump’s tax-and-spending bill. Risk sentiment improved after Trump delayed a planned 50% tariff on EU goods, easing fears of a transatlantic trade clash. The euro also gained from ECB President Lagarde’s remarks that it could strengthen as a global currency if EU institutions were reinforced.
Resistance is at 1.1425, with additional levels at 1.1460 and 1.1580. Support begins at 1.1260, followed by 1.1100 and 1.1050.

EUR/USD pro trend idea from 1.13000EUR/USD Weekly Outlook – Pro Trend Setup in Focus
My outlook for EUR/USD this week aligns closely with my GBP/USD analysis, as both pairs tend to move in a similar direction. For EU specifically, price is currently much closer to a valid demand zone, making the pro-trend continuation idea more likely in the short term.
After the recent break of structure to the upside, price left behind a well-defined 16H demand zone, which could serve as the base for another bullish rally. There’s also a significant buildup of liquidity above and no major nearby supply zone, so for now, I’ll be focusing solely on pro-trend long setups.
If price doesn’t retrace as deep as the 16H demand zone and continues pushing higher, I’ll be on the lookout for a new demand zone to form that we can then trade from.
Confluences for EU Buys:
- Price is nearing the 16H demand zone that caused the most recent break of structure
- Strong bullish momentum on the higher timeframes
- Clean liquidity above that remains untapped
- DXY continues to move bearish, aligning with a bullish EU outlook
P.S. I’ll be watching for an initial pullback during the Asia session to see how price interacts with the 16H demand. Stay alert and trade smart — let the market come to your zones.
Have a great trading week, everyone! 🔍📈

EUR/USD Daily Chart Analysis For Week of May 23, 2025Technical Analysis and Outlook:
The Eurodollar has demonstrated significant strength during this week's trading session, attaining a notable Inner Currency Rally at 1.129 and encountering Mean Resistance at 1.137. Recent analyses indicate that the Euro will likely progress towards the forthcoming target levels, specifically the Mean Resistance at 1.142 and the Key Resistance at 1.151. A retest of the completed Outer Currency Rally at 1.157 may facilitate this advancement. However, a potential downward pullback could emerge from the current price range, particularly in proximity to the Mean Resistance level of 1.137, with a possibility of declining to the Mean Support at 1.127.

EUR/USD Rebounds, Eurozone Data EyedEUR/USD climbed to around 1.1310 during Friday’s Asian session, rebounding as U.S. Treasury yields declined, the 30-year yield slipped from its 19-month high of 5.15%, weighing on the dollar. The recovery follows the House passing Trump’s fiscal bill, which revived deficit worries. Earlier, strong U.S. PMI figures (Composite: 52.1, Manufacturing & Services: 52.3) had briefly strengthened the dollar.
Fed Governor Waller hinted at possible rate cuts if tariffs stabilize, while Trump renewed threats of higher tariffs on the EU. On the European front, ECB officials expect inflation to return to near 2% by end-2025, though growth remains subdued. Eurozone PMIs showed services at 48.9 and manufacturing at 49.4. Focus now shifts to Germany’s GDP release.
Resistance is at 1.1390, with higher levels at 1.1460 and 1.1580. First support lies at 1.1260, followed by 1.1100 and 1.1050.

Euro Extends Rally Ahead of PMI DataEUR/USD trades near 1.1340 during Asian hours, close to two-week highs, extending gains for a fourth session ahead of Eurozone PMI data expected to show improved growth for May.
The U.S. dollar remains under pressure as markets await Thursday’s S&P Global PMI. Moody’s downgraded the U.S. credit rating to Aa1, matching earlier cuts by Fitch and S&P, citing rising debt, projected to reach 134% of GDP by 2035, and a nearly 9% deficit.
Trump’s tax-cut plan cleared the House Rules Committee, but the DXY still trades lower near 99.50.
The key resistance is located at 1.1390, and the first support stands at 1.1260.

EUR/USD Regains PaceEUR/USD Regains Pace
EUR/USD started a decent upward move above the 1.1225 resistance.
Important Takeaways for EUR/USD Analysis Today
- The Euro found support and started a recovery wave above the 1.1250 resistance zone.
- There is a connecting bullish trend line forming with support at 1.1280 on the hourly chart of EUR/USD at FXOpen.
EUR/USD Technical Analysis
On the hourly chart of EUR/USD at FXOpen, the pair started a fresh increase from the 1.1135 zone. The Euro climbed above the 1.1200 resistance zone against the US Dollar.
The pair even settled above the 1.1225 resistance and the 50-hour simple moving average. Finally, it tested the 1.1340 resistance. A high is formed near 1.1339 and the pair is now consolidating gains above the 23.6% Fib retracement level of the upward move from the 1.1223 swing low to the 1.1339 high.
Immediate support is near the 1.1310 level. The next major support is at 1.1280. There is also a connecting bullish trend line forming with support at 1.1280 and the 50% Fib retracement level of the upward move from the 1.1223 swing low to the 1.1339 high.
If there is a downside break below 1.1280, the pair could drop toward the 1.1225 support. The main support on the EUR/USD chart is near 1.1135, below which the pair could start a major decline.
On the upside, the pair is now facing resistance near 1.1340. The next major resistance is near the 1.1420 level. An upside break above 1.1420 could set the pace for another increase. In the stated case, the pair might rise toward 1.1550.
This article represents the opinion of the Companies operating under the FXOpen brand only. It is not to be construed as an offer, solicitation, or recommendation with respect to products and services provided by the Companies operating under the FXOpen brand, nor is it to be considered financial advice.

US Credit Downgrade and Brexit Progress Lift EuroThe euro approached the $1.13 mark on Tuesday, extending its rebound from the one-month low recorded on May 12. The rally followed a broad-based weakening in the US dollar after Moody’s downgraded the US credit rating from Aaa to Aa1, citing mounting government debt and widening fiscal deficits. The downgrade sparked investor concerns about long-term US economic stability and pressured dollar-denominated assets.
The EU and UK finalized a provisional agreement addressing key post-Brexit issues such as defense, fisheries, youth mobility, and security cooperation. The deal may pave the way for UK companies to participate in major EU defense projects, marking a potential turning point in EU-UK relations.
The European Central Bank is expected to initiate a rate cut in June, with additional easing possible later in the year. Despite these expectations, the euro has held firm, buoyed by both geopolitical developments and dollar weakness.
EUR/USD now faces resistance at 1.1260, with further upside barriers at 1.1460 and 1.1580. Support lies at 1.1040, followed by 1.1000 and 1.0960.
Symmetrical Triangle Breakout: EUR/USD Eyes Higher Levels..!📊 EUR/USD Technical Analysis – Breakout Watch..! 💥
🕰 Timeframe: 4H | 📅 Date: May 20, 2025
By: @Kartik\_Elkunchwar
The EUR/USD pair is showing an **interesting structure** with strong breakout potential. Here's the breakdown:
🔍 Chart Pattern Observed: Symmetrical Triangle
After a strong uptrend since late March, price consolidated into a symmetrical triangle, marked by lower highs and higher lows.
This formation typically indicates indecision in the market, but it often precedes a strong breakout.
📈 Uptrend Intact
The dotted line labeled UP-TREND shows that the bullish momentum is still present, with price respecting the rising support line over time.
This trendline has acted as a reliable dynamic support, reinforcing the bullish bias.
🔔 Recent Price Action
Price recently broke out above the upper trendline of the triangle, closing around **1.1275**.
This breakout is accompanied by a surge in momentum and could signal the resumption of the bullish trend.
📌 Key Levels to Watch
Resistance Zone: 1.1300 – If price breaks and sustains above this level, we could see a rally toward **1.1400–1.1450**.
Support Zone: 1.1200 and 1.1100 – In case of a false breakout or retest, these levels may act as buying opportunities.
🧠 Conclusion
The EUR/USD pair is giving a **potential long setup** after consolidating for weeks. A confirmed breakout above the triangle indicates **buyers may be gaining control**. Watch for a **retest and bounce** for higher conviction entries.
📉 What’s your take on EUR/USD? Bullish or Bearish..?
Drop your analysis in the comments! 💬

EUR/USD) breakout trand line analysis Read The ChaptianSMC trading point update
Technical analysis 1-hour EUR/USD (Euro vs US Dollar) chart using Smart Money Concepts (SMC) and technical confluence. Here's the idea behind the analysis:
---
1. Bearish Rejection Setup
Strong resistance zone around 1.12176–1.12500 has been tested multiple times and held.
Bearish rejection is shown with a black circle indicating a breakdown from previous support turned resistance (support flip).
Price failed to stay above the key structure, indicating bearish intent.
---
2. Break of Structure
The support level near 1.11600 has been broken, marked by the black circle.
This is a clear change in structure, implying a likely shift from bullish to bearish.
---
3. Price Action Forecast
The chart expects a minor pullback (retest) into the broken support zone (now resistance).
Followed by a continuation move to the downside, targeting the support level at 1.10668.
Projection shows a ~100 pip drop from current levels.
---
4. EMA & RSI
EMA 200 is trending downward and acting as dynamic resistance.
RSI (14) is under 50 and sloping down, suggesting bearish momentum is building.
Mr SMC Trading point
---
Conclusion
This is a bearish continuation setup based on structure break, failed bullish momentum, and confirmation via indicators. The analyst expects EUR/USD to reject the 1.116 area again and drop toward the 1.10668 target.
Pelas support boost 🚀 analysis follow)

EURUSD Near Top Of Channel — Correction Imminent!!!EURUSD ( FX:EURUSD ) is trading in the Resistance zone($1.1310-$1.1162) , near the upper line of the descending channel and the Monthly Pivot Point .
In terms of Elliott wave theory , it seems that EURUSD has completed five main impulse waves , and with the break of the Uptrend lines , we should expect corrective waves . Most likely, EURUSD is completing microwave 4 , and we should expect the next decline and the formation of microwave 5 .
I expect EURUSD to fall to at least $1.1073 , and the next targets are marked on the chart.
Note: If EURUSD touches $1.1330 , we should expect further gains.
Please respect each other's ideas and express them politely if you agree or disagree.
Euro/U.S. Dollar Analyze (EURUSD), 4-hour time frame.
Be sure to follow the updated ideas.
Do not forget to put a Stop loss for your positions (For every position you want to open).
Please follow your strategy and updates; this is just my Idea, and I will gladly see your ideas in this post.
Please do not forget the ✅' like '✅ button 🙏😊 & Share it with your friends; thanks, and Trade safe.

EUR/USD Daily Chart Analysis For Week of May 16, 2025Technical Analysis and Outlook:
During the current trading session, the Eurodollar has exhibited notable signs of weakness, ultimately reaching a critical Outer Currency Dip at 1.111, facilitated by Mean Support at 1.119. Following this decline, the market experienced a pronounced rebound. Recent analysis indicates that the Euro will likely close with a retest of the completed Outer Currency Dip at 1.111, while it may progress towards the next Outer Currency Dip at 1.095. It is essential to highlight that upward "dead-cat" rebounds may arise within the current price range, particularly around the Mean Resistance level of 1.125, and could potentially approach an Inner Currency Rally at 1.129.

Fundamental Market Analysis for May 15, 2025 EURUSDEUR/USD is holding near 1.12000 in Thursday's Asian session, recovering the day's losses as the euro (EUR) gains momentum ahead of the preliminary Eurozone gross domestic product (GDP) report for Q1 2025 to be released later in the day.
The euro is being bolstered by growing confidence in its role as a reserve currency. Analysts at Capital Economics noted that the single currency is now in its strongest position in years and is closing the gap with the US dollar (USD) in global reserves. This shift is partly due to the policies of US President Donald Trump, which are seen as undermining the traditional appeal of the USD as a “safe-haven currency”. Further boosting the euro's reserve status was Germany's move to loosen fiscal restraints to boost defense and government spending, sparking additional demand for the currency.
Meanwhile, European Central Bank (ECB) officials continue to emphasize the need for further interest rate cuts amid growing confidence that U.S. tariff measures will not significantly boost inflation in the eurozone. While interest rate cuts usually have a negative impact on the euro, the currency has so far remained resilient.
EUR/USD is also finding support from a softer US Dollar as markets remain cautious amid continued, albeit slightly diminished, trade uncertainty. Attention now turns to upcoming US data releases, including retail sales and the Producer Price Index (PPI).
Adding to the broader context, speculation is growing that Washington may favor a weaker dollar to boost its trade competitiveness. The Trump administration has argued that an overvalued dollar puts U.S. exporters at a disadvantage against competitors with weaker currencies.
Trading recommendation: BUY 1.11900, SL 1.11400, TP 1.12600

Eur/Gbp May/12 elliott Wave Hello eveyone...
i was wrong last time..
so 5th wave compelted and we are in C wave so i'm looking for buy in the end of c wave...

Fundamental Market Analysis for May 12, 2025 EURUSDEUR/USD is retreating from the gains made in the previous session, trading near 1.12400 in Monday's Asian session. The Euro (EUR) has been under pressure since European Central Bank (ECB) official Olli Rehn said last week that the ECB may consider cutting interest rates at its next meeting, provided that upcoming forecasts confirm a continued trend of disinflation and slowing economic growth.
Despite this, EUR/USD found some support thanks to optimism surrounding the trade talks between the US and China that took place in Geneva. Both sides reported “substantial progress” after two days of talks aimed at de-escalating the ongoing trade dispute. Chinese Vice Premier He Lifeng called the talks an “important first step” in stabilizing bilateral relations, while U.S. Treasury Secretary Scott Bessent echoed his sentiment, noting significant progress.
Markets are now awaiting Washington's response to the European Commission's proposed countermeasures against U.S. tariffs. On Thursday, the Commission launched a public consultation that outlined potential tariffs on up to 95 billion euros worth of imports from the U.S. if trade talks break down.
Meanwhile, the U.S. economic outlook remains uncertain. Federal Reserve (Fed) officials have noted the risk of stagflation, and Fed Chairman Michael Barr has warned that higher tariffs could disrupt supply chains, leading to higher inflation, lower growth and higher unemployment. Investors remain cautious as further escalation of trade tensions could pose serious problems for the US economy.
Trading recommendation: BUY 1.12300, SL 1.11900, TP 1.13000
