FNTP: EUR/JPY, 118.20 is the level (long/short)"From Noob To Pro"-series: We're reaching a key support line, depending on what the price does it will go down a few levels (breaks). When it bounces, it will go up to to 123 over a few days.
Europe

DAX and other European indices (Points and Figures): Fake out?So "they" want everyone to turn bullish (whether artificially or not) or be stopped out. The weak buyers are being washed away, shorts must be covered or the shorters will burn their feet if that's not already the case. Retail investors are still very bearish overall, but what is observed in Europe and in the official financial news show that money is flocking to European equities, among other things (even real estate is "booming" again). Indices are compelled to go higher, but the exhaustion seems to be nearing. Summer could be very frustrating. Volume seems to be impressive, but for such small moves (green XXX) at the time I am writing this post, this appears to be not. Volume is accumulating, we see final explosive moves, this could signal the beginning of the end of a bull market. But it will still grind up. It's better to buy pullbacks with tight stop loss orders, or wait until it goes way up if people want to short. However, we don't know yet when this will truly end. I would expect spikes and fake out. Reversal days could be extremely tricky.

BUY EURUSD FOR A 250 PIP BULL MOVEI like this fundamental situation surrounding the euro.
We have inflation inching up and talk is ramping up about rate hikes in the ecb.
On the other hand we have this conflict in the US politics that is weighing on the dollar.
In the last 2 days we made a simple corrective move from the 1.09 swing high.
A perfect situation in my view to buy this dip looking for the continuation to happen.
Technically we have a triangle breakout and now retest of the breakout spot.
Also take a look at the bold green line. Bulls were able to conquer it back and now we are also retesting it.
Blessings..


Is Non-farm Payrolls and the ECB are the keys to Market Moves?EURUSD Daily Technical Analysis - Is Non-farm Payrolls and the ECB are the keys to Market Direction?
Will US Dollar taking control the EURO Markets on NFP day?
Hints: FOMC members to prepare the market for a rate hike on March 15 2017

EURAUD NOW IS THE TIME FOR A MOVE HIGHERAs per my previous EurUsd analysis. I am now looking for longs across the EUR board because the fundamental situation lightened up, and in my view a turnaround for the days to come is in the making.
I have been watching EurAud for quite a while and i like this oversold setup here.
I bought at 1.3705 with a relativley tight stop for the volatile euraud at 1.3650.
I am targeting 1.39 and if the momentum is strong maybe 1.40
Its a little bit of an aggressive entry if you like a more conservative approach you can wait for lower prices around 1.3680 and enter, risking less pips. In any case use proper risk/money management and dont risk much on one trade.
One more suggestion: If you look at the lower timeframes maybe something like this will form a consolidativ phase in the asian session, that gives you more confidence that the market will continue tomorrow in the London session.
Blessings to you all

USD INDEX BEARS MIGHT TAKE OVER SOONIf we break higher tonight on the FED Minutes it will probably be some kind of stop hunt above the recent high. I dont think it will be a sustainable move above 101.80, except something really major happens, that turns the sentiment on the USD completly around and makes it super bullish then look for buys above 101.80.
But right now i am not seeing this scenario unfold. So i am prefering to look for the short side of this trade.
Blessings to you all.

EURUSD LOOKING FOR THE NEXT IMPULSE HIGHEREurUsd is on my watchlist for a bull swing higher towards recent highs and maybe a little bit more.
I prefer to wait and not to jump in while the market is moving aggressivley lower like now.
Lower timeframes (15min, 10min, 5min) can give clues when the downmove is slowing, or a change of direction is happening. So be patient and dont rush into a position.
Price is secondary, i see people buying from 0600 looking for that move higher and losing, but fact is that price is secondary, markets only start to go higher when the sell pressure is over, and order flows are dried out, you have to be selective when trading.
In other words, when there is no one more willing to sell the market will turn.
Now where is that ? No one knows for sure all you get are clues from the price action... thats why you should always be calculating a fail scenario and have a decent risk approach.
Blessings to you all.

AEX - Breakout- LongThe price has broke the resistance of the bullish flag pattern. The trend will probably continue.
First target is 0.618. The 0.618 fib. extension is also in line with the resistancezone 505~510.

TEXTBOOK BUY SETUP ON EURJPYChart is really clean and technically beautiful to play.
The 120.00 level is pivotal and very important, i am looking to play this level and the flag from the buy side.
As you can see on the chart, bears were not able to make a decisive move below 120, the bulls countered pretty good, showing a strong hand.
Look in the lower timeframes for a entry according to your strategy.
I will place my stop in the beginning below the 119.33 low and will trail it higher if the market goes my way, and target a move to the upside of the shown structure.
Blessings to you all.

Euro looking uneasy. Brexit and Grexit jitters maybe?The Euro is looking very nervous. If we fail to go over the 1.0819 handle it could spell a selloff for the Euro. I personally think we are going down because the Dollar is looking like it wants to show strength across the board, but there is still a case for a test of the highs. Next week will definitely provide some perspective.

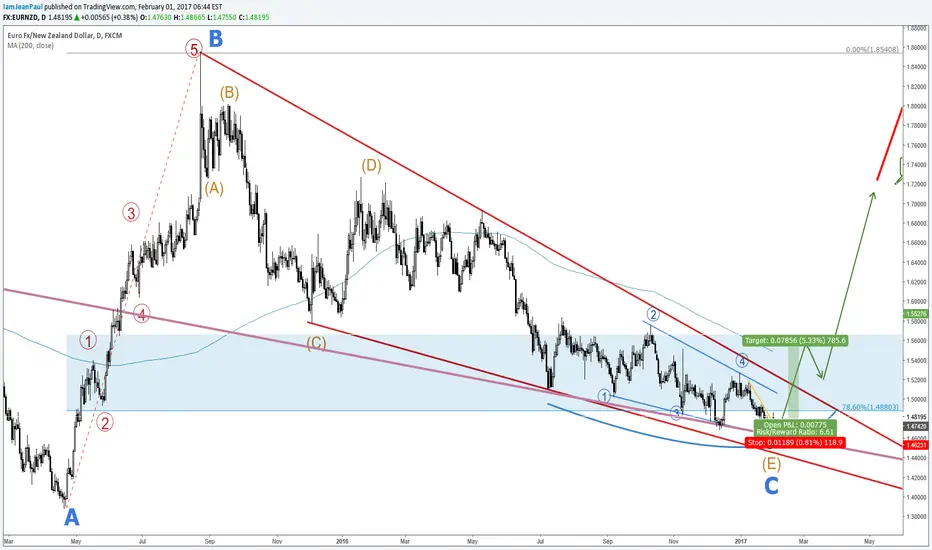
EURNZD HUGE BULL RUN IS COMINGPerfect setup. The multimonth correction is in my opinion over. Look at this tasty ending diagonal, if it plays out, there is some big pips to be made.
We have a dynamic impulse after the NZ-Unemployment report. It came in very weak.
Market made a false breakout to the downside, and now it broke the golden trendline.
Watch for a potential flag, or corrective pattern toward 1.4700/1.4730 and enter with a stop at 1.4620.
Target something big higher, my first target is the 1.55 area, and then 1.72.
This position has a nice Risk:Reward ratio.
Keep an eye on the fundamental development. Eurozone CPI, and NZ CPI are important drivers.
Please use wise moneymanagement and risk control.
Blessings to you all.
TECHNICALS | EUR DistributionThe Euro looks to be trading back towards the midpoint of its distribution... I'm not bullish as a result of the risks posed by European elections this year, however, I am of the opinion it trades higher over the next month where I will likely look to short it higher. Given it is in said distribution I will be monitoring it closely with my mean-reversion model, looking to fade extremes.

USDSEK CORRECTION MIGHT BE OVER SOONWaiting for the breakout of the green upper trendline.
A beautiful trade might be setting up.
I am not going to buy as long as we are below 8.90, because further move lower is possible. I want a clear impulsive breakout of the golden zone, and then i will buy the correction with a stop at 8.80 targeting 9.20 and 9.30.
Also keep an eye on USDNOK and USDPLN, they are looking similar ready for a leg higher.
Blessings to you all.

Rising Wedge - Shorting the EuroVolume is going down, while the price is going up. The RSI hasn't been able to even touch oversold and is stuck in a range, while the price is going up. Clear divergence on both and it is bearish.
To me this Euro price action has been a healthy pullback and I am expecting this wedge to break to the downside. When it completes with good volume, I'd be shorting the market. Right now, I can't see a clear entry or exit points, but a break below 1.065 would be very bearish to me.
Some important news are coming out on Thursday and Friday out of the US and I would like to see how they play out.

EURGBP BEARISH MOMENTUMAfter some big news and bearish momentum for the euro pound, we can clearly see a triagle being formed on the H1-H4 charts. Giving us the good opportunity to short this market. To place an easy sell stop below lows, and wait for the breakout.
With a decent 1.5 risk reward, this trade is a good bullet.
Hope you guys have a good week.


RBS potential to reach 99$ price areaFor your long swing account. You will have many opportunities to add more to the trade so still once reaching 1:1-or-more ratio remember to consider taking profits to remove your risk.


Bullish Europe IEVI spy an inverse H&S pattern. Bullish on Europe. Technicals look good. Check out my blog for more information. klendathucapitalist.com
klendathucapitalist.com

WHEN WILL THE BLEEDING STOP ON EURUSD?More downside is imminent on eurusd, with the next possible buy zone in the 1.01 area. However, eurusd has evidently broken monthly trendiness that were being respected since the 1980s. I am anticipating more downside in the long term for erased and am not sure when the bleeding will end. Will have to closely observe price action for long term buy opportunities, but for now it remains a short

EUFN: European financials are in danger hereI think we can get a retracement in the financial sector, and Europe is in worse shape than the US in general. It wouldn't surprise me to have some negative news pop out, surrounding Italy's referendum, Deutsche Bank, Italian Banks, UK banks, Brexit, etc. Quite a few potential catalysts for volatility, so, if we see this ETF break the linear regression channel support, we will probably see a rapid selloff.
Keep your eyes open, it might be safer to stand aside, and book succesful long trades, or maybe even take a couple strategic shorts.
Good luck,
Ivan Labrie.
