EURUSD – Smart Money Short Setup During NFP Friday | ICT Concept
EURUSD is trading inside a well-defined bearish structure after multiple internal liquidity sweeps during the London and Asia sessions.
As we enter the New York Killzone, price has returned to a bearish OB near the NY Midnight Open, with clear signs of exhaustion.
The pair failed to break above the Thursday OB zone, and the 15M chart shows consecutive MSS and BOS patterns, indicating supply is in control.
🧠 Trade Idea (Execution Plan):
Sell Limit: 1.14183
SL: 1.14422
TP1: 1.13877
TP2: 1.13608
TP3: 1.13351
📌 Confluence:
Bearish OB
NY Midnight Open rejection
MSS on LTF
RSI/Williams %R Overbought
📉 Structure: Bearish
🕒 Session: New York (NFP Volatility Expected)
💡 Context: USD is likely to strengthen after deep retracement into DXY OB, targeting 100.5–100.7
If price invalidates 1.14422 with bullish displacement, setup becomes void.
Patience is key during high-impact news – let Smart Money show their hand.
Eurousdanalysis

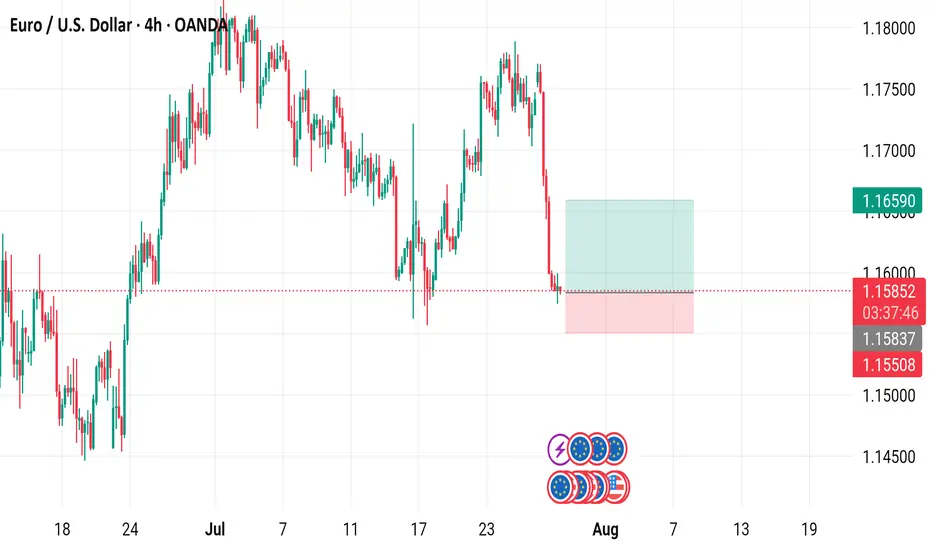
EUR/USD 4-Hour Chart Analysis4-hour performance of the Euro/U.S. Dollar (EUR/USD) currency pair, showing a recent decline from a high of 1.15853 to 1.15845, with a -0.04% change. Key levels include a "Buy" signal at 1.5 and a "Sell" signal at 1.15838. The chart highlights a significant drop with a shaded support zone around 1.16590 to 1.15845, indicating potential trading opportunities or resistance levels as of July 29, 2025.
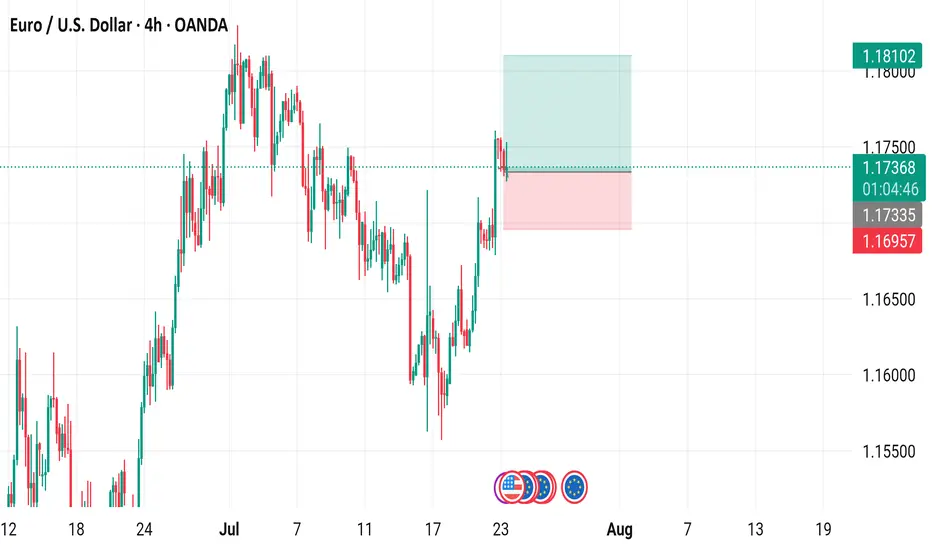
EUR/USD 4-Hour Candlestick Chart (OANDA)4-hour candlestick pattern for the Euro/US Dollar (EUR/USD) currency pair on the OANDA platform, covering the period from mid-July to mid-August 2025. The current price is 1.17358, reflecting a 0.16% decrease (-0.00186). Key levels include a sell signal at 1.17350 and a buy signal at 1.17366, with a highlighted resistance zone around 1.18102 and support near 1.16957. The chart includes technical indicators and price movements over the specified timeframe.
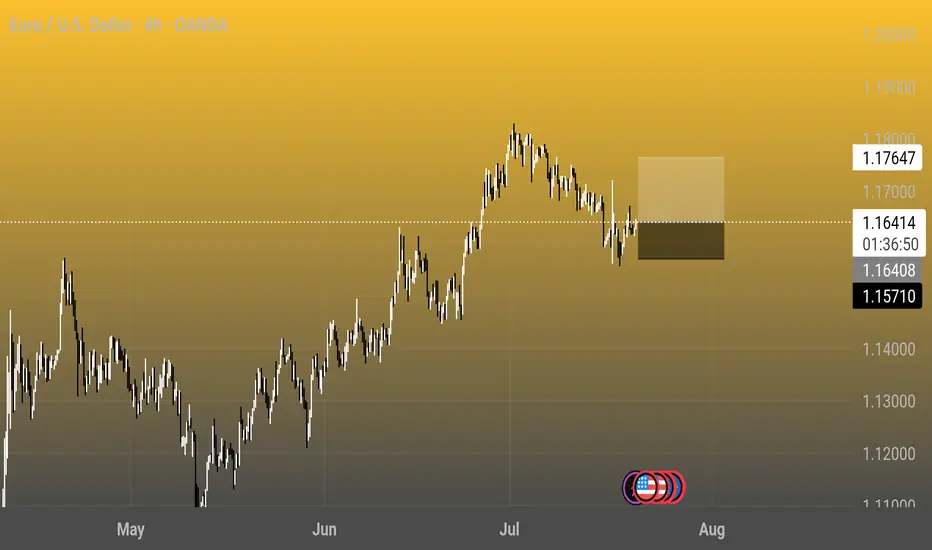
Euro / U.S. Dollar 4h Chart - OANDA4-hour candlestick chart showing the exchange rate between the Euro (EUR) and the U.S. Dollar (USD) from May to August 2025. The current rate is 1.16416, with a 0.14% increase (+0.00161). The chart highlights a peak around late June to early July, followed by a decline, with notable support and resistance levels marked at 1.17647 and 1.16416, respectively.
EUR/USD 4-Hour Chart - OANDA4-hour performance of the Euro/US Dollar (EUR/USD) currency pair on the OANDA platform as of July 17, 2025. The current exchange rate is 1.16408, showing a slight decline of 0.01%. Key levels include a buy signal at 1.16417 and a sell signal at 1.16399, with recent price action ranging between 1.1452 and 1.17245. The chart includes candlestick patterns and shaded areas indicating potential resistance and support zones.

EUR/USD) bearish chochy Trend Read The captionSMC trading point update
Technical analysis of EUR/USD (Euro vs. U.S. Dollar) on the 4-hour timeframe. Here’s the breakdown
---
Technical Breakdown:
1. Market Structure Shift (CHOCH):
The chart highlights a Change of Character (CHOCH), signaling a bearish reversal after a previous uptrend.
This is confirmed by lower highs and lower lows forming after the CHOCH point.
2. New Resistance Zone:
The previous support (yellow box) has now turned into a new resistance level around 1.16400–1.16700.
Price has rejected this area after the breakdown, validating the resistance flip.
3. 200 EMA Breakdown:
Price is now trading below the 200 EMA (1.15928), which reinforces bearish sentiment.
The EMA may act as dynamic resistance on any pullbacks.
4. Target Zone:
The projected target is the key support zone around 1.14582, where price consolidated before the last major bullish move.
This level has historical significance and aligns with a clean support demand zone.
5. RSI Indicator:
RSI is not yet oversold, sitting in a neutral-to-bearish range, indicating further downside potential.
Mr SMC Trading point
---
Trade Idea Summary:
Bias: Bearish
Entry Zone: On breakdown and rejection from the new resistance area (~1.16400–1.16700)
Target Zone: 1.14582 (key support)
Invalidation: A break and close above the resistance zone
Confluence: CHOCH confirmation + support-turned-resistance + 200 EMA breakdown
---
Please support boost 🚀 this analysis)

Euro/U.S. Dollar (EUR/USD) 4-Hour Chart - OANDA4-hour performance of the EUR/USD currency pair. The chart shows a recent upward trend peaking around 1.16241, followed by a sharp decline to approximately 1.15452. Key levels include a high of 1.17245 and a support level around 1.16478, with a highlighted area indicating a potential consolidation or reversal zone.

EUR/USD 4-Hour Chart (OANDA)4-hour performance of the Euro/US Dollar (EUR/USD) currency pair on the OANDA platform as of July 10, 2025. The current exchange rate is 1.16920, reflecting a 0.25% decrease (-0.00298). The chart includes a candlestick representation with a highlighted resistance zone between 1.1692 and 1.17477, and a support zone around 1.16523. Buy and sell signals are marked at 1.16927 and 1.16912, respectively, with a spread of 1.5 pips.

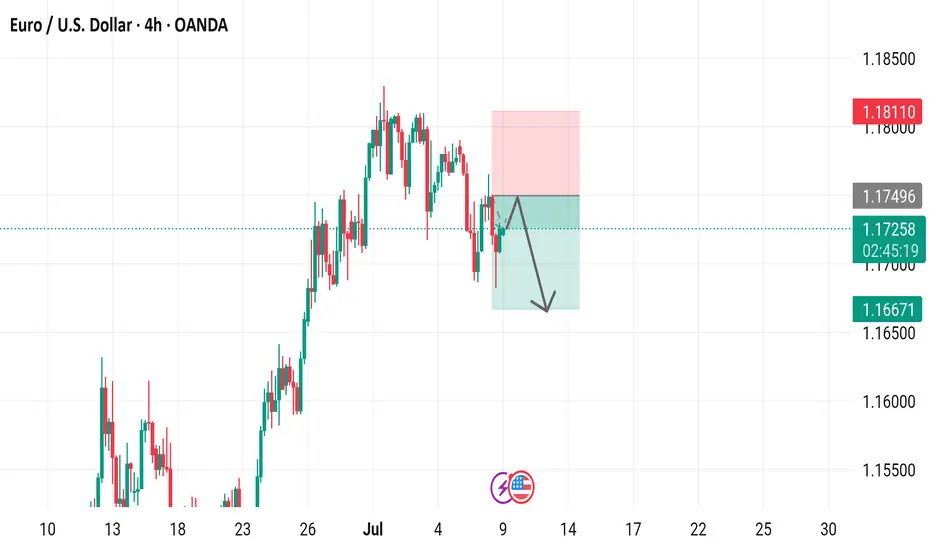
EUR/USD 4-Hour Chart Analysis4-hour candlestick chart for the Euro/U.S. Dollar (EUR/USD) currency pair on the OANDA platform. The chart shows a recent upward trend followed by a consolidation phase, with key technical levels and trading signals indicated. The presence of "SELL" and "BUY" signals suggests active trading opportunities. The downward arrow within the shaded area hints at a potential bearish move. This chart is likely used by traders to analyze short-term price movements and make informed decisions.
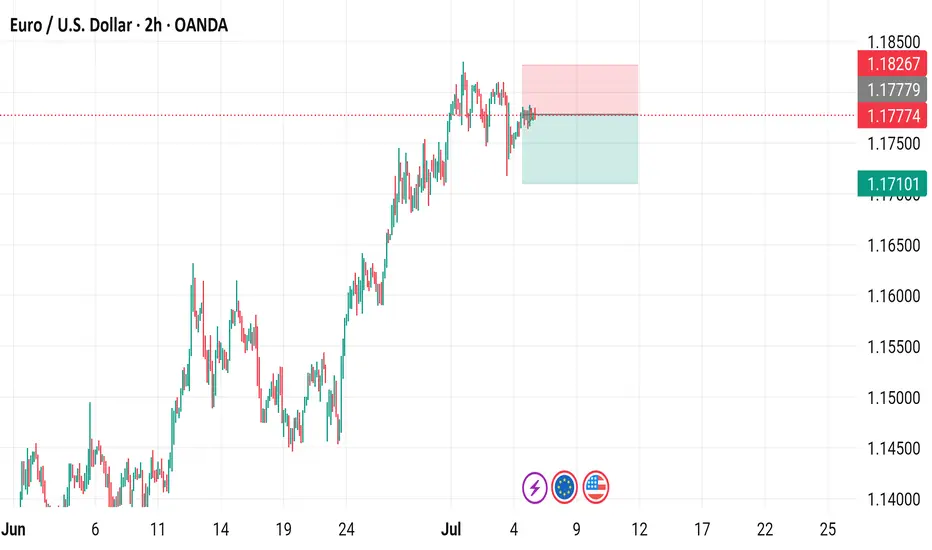
EUR/USD 2-Hour Chart - OANDA2-hour performance of the Euro/U.S. Dollar (EUR/USD) currency pair on the OANDA platform as of July 08, 2025. The current exchange rate is 1.17365, reflecting a 0.24% increase (+0.00279). The chart includes a recent sharp decline highlighted in a shaded area, with buy and sell signals at 1.17375 and 1.17357 respectively. Key price levels are marked, ranging from 1.1500 to 1.1850, with a focus on the recent market movement.

Euro / U.S. Dollar - 2h Chart (OANDA)2-hour candlestick chart of the EUR/USD currency pair from OANDA, showing the exchange rate trend from late June to July 07, 2025. The current rate is 1.17774, with a 0.00200 (0.17%) increase. The chart highlights a recent trading range between 1.17774 (sell) and 1.17824 (buy), with a notable upward movement in the past few hours.
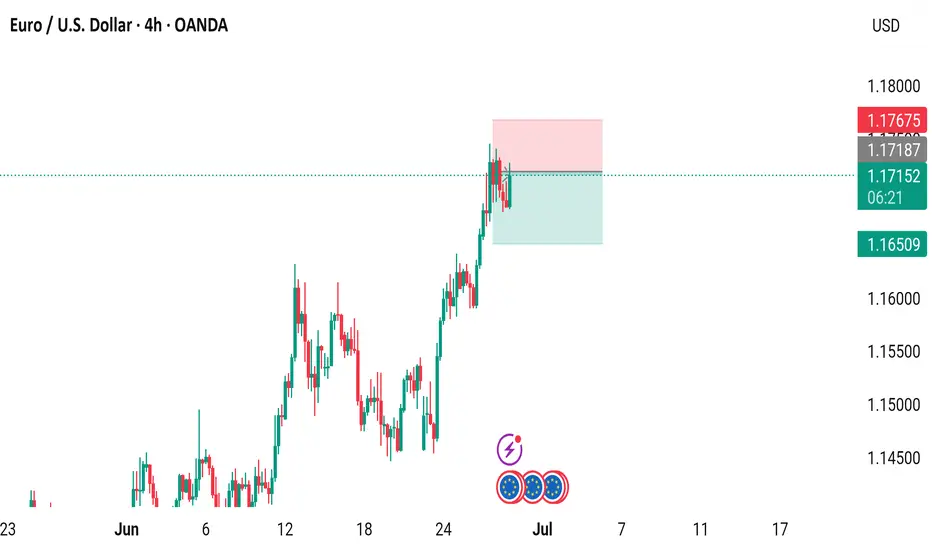
EUR/USD 4-Hour Chart (OANDA)4-hour performance of the Euro/US Dollar (EUR/USD) currency pair, sourced from OANDA. The current exchange rate is 1.17152, reflecting a 0.12% increase (+0.00136). The graph shows a recent upward trend, with a highlighted resistance zone around 1.17187, where the price has approached but not consistently broken through. The timeframe spans from late June to early July 2025, with key price levels marked on the right side ranging from 1.14500 to 1.18000 USD.
EUR/USD 4-Hour Chart (OANDA)4-hour price movement of the Euro/U.S. Dollar (EUR/USD) currency pair from OANDA, covering the period from June 19 to July 11, 2025. The current exchange rate is 1.16787, reflecting a 0.16% increase (+0.00189). The chart highlights a recent upward trend, with a notable price range between 1.15990 and 1.17335, and includes candlestick patterns and a highlighted resistance zone.

EUR/USD) back to bearish Trand Read The captionSMC trading point update
Technical analysis of EUR/USD pair on the 2-hour timeframe. Here's a breakdown of the idea behind the analysis:
---
Trading Idea Summary: EUR/USD Bearish Reversal Setup
1. Rejection at Resistance Zone
Resistance Level (~1.1600): Price has tested this level twice (red arrows) and faced strong rejection, suggesting it’s a firm supply zone.
This double top near resistance signals potential downside pressure.
2. Bearish Market Structure
Price action shows a break in short-term bullish momentum.
Bearish trend arrows and structure indicate expected continuation to the downside.
3. EMA Resistance
The 200 EMA (blue line) at 1.14356 is above the key support zone, acting as dynamic resistance, reinforcing the bearish outlook.
4. Target Levels
First Target: 1.13694 (Key Support Level)
Previous structure zone with strong historical price reaction.
Final Target: 1.12025 (Major Support Zone)
Larger demand area where buyers previously stepped in.
Mr SMC Trading point
---
Conclusion
This analysis suggests a potential short setup with confirmations from:
Repeated resistance rejection
Bearish price structure and trend arrows
EMA as added confluence
Clear downside targets: 1.13694, then 1.12025
> Bearish bias remains valid unless price reclaims and closes above the resistance zone (~1.1600).
pelas support boost 🚀 this analysis)

EUR/USD) Bearish breakout analysis Read The ChaptianSMC trading point update
Technical analysis of EUR/USD on the 1-hour timeframe, likely projecting a short-term downward move. Here’s a breakdown of the technical analysis and the trade idea:
---
Key Elements in the Chart:
1. Bearish Rejection from Resistance:
Price was rejected twice near the 1.14400 resistance zone (highlighted in yellow).
The red arrows mark double rejection at this level, suggesting strong selling pressure.
2. Break of Rising Channel:
Price was previously moving inside a rising channel.
Recent price action shows a clear breakdown below the lower trendline, indicating trend reversal.
3. 200 EMA (Exponential Moving Average):
EMA is around 1.13188 and price is below it, reinforcing bearish momentum.
EMA also acted as dynamic resistance after the channel breakdown.
4. Target Zone – Support Area:
The yellow support zone around 1.10911 is the target point.
This was a previous area of price consolidation and demand.
5. RSI (Relative Strength Index):
RSI is near 51, hovering around the neutral zone.
Not strongly bearish yet, but room remains to drop toward oversold if the downtrend continues.
---
Trade Idea Summary:
Bias: Bearish
Scenario:
Price has broken a key structure and is retesting the breakdown.
Expect continuation toward the 1.10900 support zone.
Entry Zone:
Near current price (~1.13400–1.13500), ideally on a retest of the EMA or broken trendline.
Target:
1.10911 (highlighted support level).
Stop-Loss (Invalidation):
A break and close back above the resistance zone (~1.14000–1.14200).
Mr SMC Trading point
---
Conclusion:
This is a high-probability bearish setup following a structure break, retest, and double top rejection. It targets a move back down toward a previously strong support level, with a favorable risk-to-reward ratio.
Pales support boost 🚀 analysis follow)

EUR/USD) breakout Analysis Read The ChaptianSMC trading point update
Technical analysis for EUR/USD (Euro/US Dollar) on a 3-hour timeframe presents a bearish outlook. Here's a breakdown of the key ideas and elements in the analysis:
---
1. Breakdown of Rising Channel
Ascending Channel: Price was moving upward within a clearly defined channel.
Breakout: The price broke below the ascending channel, indicating a potential trend reversal or correction.
---
2. Resistance Zone (Yellow Box)
Multiple Rejections: Red arrows mark points of rejection from the resistance area.
“Breakout” Label: Indicates this area was previously a support that turned into resistance after the price dropped below it.
---
3. EMA 200
The 200 EMA is plotted and the price is trading slightly above it, but very close.
A break and sustained movement below the 200 EMA would typically support a bearish trend continuation.
---
4. Bearish Projection
Downward Zigzag Path: Implies an expected short-term correction followed by further decline.
Target Points:
First target: 1.11307
Second, more extended target: 1.10639
---
5. RSI (Relative Strength Index)
Current Value: Around 38.84, which is near the oversold region (30).
Bearish Momentum: RSI is trending downwards, suggesting strengthening bearish momentum.
---
6. Fundamental Events
Multiple icons at the bottom (e.g., flags, calendar) indicate upcoming economic events/news which could influence volatility and confirm or invalidate the move.
Mr SMC Trading point
---
Conclusion:
This analysis suggests a bearish short- to medium-term outlook for EUR/USD, especially if price confirms a break below the 200 EMA. The resistance zone (around 1.133–1.135) is now seen as a supply zone, and the targets are around 1.113 and 1.106.
---
Suggestions/Considerations:
Watch the 200 EMA: A solid break below it would reinforce the bearish bias.
Monitor Fundamentals: U.S. and Eurozone economic news could heavily impact price action.
RSI Oversold Caution: If RSI dips further, a bounce might occur before full target completion.
Pales support boost 🚀 analysis follow)

EUR/USD) breakout trand line analysis Read The ChaptianSMC trading point update
Technical analysis 1-hour EUR/USD (Euro vs US Dollar) chart using Smart Money Concepts (SMC) and technical confluence. Here's the idea behind the analysis:
---
1. Bearish Rejection Setup
Strong resistance zone around 1.12176–1.12500 has been tested multiple times and held.
Bearish rejection is shown with a black circle indicating a breakdown from previous support turned resistance (support flip).
Price failed to stay above the key structure, indicating bearish intent.
---
2. Break of Structure
The support level near 1.11600 has been broken, marked by the black circle.
This is a clear change in structure, implying a likely shift from bullish to bearish.
---
3. Price Action Forecast
The chart expects a minor pullback (retest) into the broken support zone (now resistance).
Followed by a continuation move to the downside, targeting the support level at 1.10668.
Projection shows a ~100 pip drop from current levels.
---
4. EMA & RSI
EMA 200 is trending downward and acting as dynamic resistance.
RSI (14) is under 50 and sloping down, suggesting bearish momentum is building.
Mr SMC Trading point
---
Conclusion
This is a bearish continuation setup based on structure break, failed bullish momentum, and confirmation via indicators. The analyst expects EUR/USD to reject the 1.116 area again and drop toward the 1.10668 target.
Pelas support boost 🚀 analysis follow)

EUR/USD) Big Support level Analysis Read The ChaptianSMC Trading point update
Technical analysis of EUR/USD on the 1-hour timeframe. The idea centers around a potential reversal from a major support zone, aiming for higher resistance targets. Here's a detailed breakdown:
---
1. Big Support Level
A strong horizontal support zone is highlighted around 1.1275–1.1290.
Price is currently reacting off this level, suggesting a potential bullish reversal.
2. EMA 200 as Resistance
The 200-period EMA (~1.1346) is above current price, possibly acting as a dynamic resistance.
A break and hold above it could confirm bullish momentum.
3. Resistance Levels & Target Points
The first target is the 1.14367 resistance level, a clear supply zone.
The second target point is around 1.15622, aligned with a previous major high and strong resistance zone.
4. RSI Indicator
RSI is at 44.02, indicating neutral to slightly oversold conditions—this supports a potential bullish move, especially from support.
5. Forecast Path
The chart projects a likely pullback and breakout pattern:
Rebound from the support zone.
Break through EMA 200 and minor resistance.
Rally toward first and second targets.
Mr SMC Trading point
---
Summary of the Idea:
This is a trend-reversal-to-continuation setup, with EUR/USD expected to rise from a key support area toward 1.14367, and potentially 1.15622, provided price holds above the support and breaks the EMA 200.
Pales support boost 🚀 analysis follow)

EUR/USD) resistance level rejected) Analysis Read The ChaptianSMC Trading point update
updated chart provides a more refined bearish outlook for EUR/USD. Here's the idea behind this analysis:
---
Market Structure Overview:
Resistance Level: ~1.14292
Mid Support Zone: ~1.13500
Major Support (Target Point): ~1.12658
Current Price: 1.13787
---
Indicators:
EMA 200 (1.12174): Price is above the 200 EMA, indicating an overall bullish bias, but that may be weakening.
RSI (14): Around 54.37, slightly bullish but neutral—no strong momentum.
---
Trading Idea:
1. Short-Term Bullish Move:
Price is expected to rise to test the resistance level around 1.14292.
2. Bearish Reversal at Resistance:
From there, a rejection is anticipated, leading to a drop back to the mid support (~1.13500).
3. Break Below Mid Support:
If the price fails to hold the mid support zone, a breakdown is likely to continue toward the target point at 1.12658, which aligns with the previous big support level.
Mr SMC Trading point
---
Strategy Suggestion:
Sell Setup 1: At resistance (~1.14292), with confirmation like bearish candles or divergence on RSI.
Sell Setup 2: On breakdown and retest of the 1.13500 support zone.
Take Profit: Target at 1.12658.
Stop Loss: Above 1.14300 or above the most recent swing high.
---
Pales support boost 🚀 analysis follow)

EUR /USD) resistance level rejected support level Read The ChaptSMC Trading point update
analysis of the EUR/USD currency pair on a 1-hour timeframe, and it presents a potential bearish setup. Here's a breakdown of the idea:
Key Elements:
Resistance Zone (around 1.14182):
The price is currently approaching a marked resistance area. The analysis suggests this could be a turning point where price may reverse.
Projected Movement (Black Arrows):
The chart predicts a double top formation or a rejection from the resistance level, followed by a strong move downward.
Target Point:
The drop is expected to reach the key support zone around 1.10942, aligning with a previous structure and a potential liquidity zone.
EMA 200 (around 1.10389):
Price remains well above the 200 EMA, suggesting the trend is still bullish overall, but the setup targets a potential correction or short-term reversal.
RSI Indicator (~60):
RSI is above 60 but not overbought yet. This supports the idea that there's room for one more push up into resistance before a drop.
Mr SMC Trading point
Summary of the Idea:
1. Watch for price reaction around 1.14182.
2. If there's a clear rejection or double top, a short position may be considered.
3. Target area is around 1.10942.
4. The setup assumes a corrective move in a broader bullish trend.
plase support boost 🚀 analysis follow)

EUR /USD) bearish trand analysis Read The ChaptianSMC Trading point update
This chart presents a technical analysis of the EUR/USD pair on a 1-hour timeframe. Here's the breakdown and idea behind the analysis:
Chart Analysis Summary:
1. Trend Structure:
The price was in a downtrend, moving within a descending channel.
Recently, the price has rejected the upper boundary of the channel (noted as "down reject").
There's a 200 EMA (Exponential Moving Average) acting as dynamic support around the 1.09086 level.
Mr SMC Trading point
2. Support Zone:
A strong demand zone (highlighted in yellow) is visible near the 1.08183 area.
This zone aligns with previous structure support and a potential reversal point.
3. RSI Indicator:
RSI is around 49, showing a neutral to slightly bearish momentum.
No overbought/oversold signals yet, suggesting room for further downside before a reversal.
4. Projection Idea:
The analyst expects a possible short-term drop into the yellow support zone (target: 1.08183).
After reaching the target, a bullish reversal is anticipated, aiming for a breakout above the downtrend with a rally towards the 1.10500+ zone.
Trading Idea:
Short-Term Bearish Move: Sell toward 1.08183 if price confirms rejection of the trendline or 200 EMA.
Medium-Term Bullish Reversal: Watch for bullish confirmation (e.g., engulfing candle, RSI divergence) at the 1.08183 zone to go long toward higher highs.
Pales support boost 🚀 analysis follow)

EURUSD Bearish Correction Resistance Rejection Support TargeTTrading point update
This chart provides a technical analysis of EUR/USD on the 3-hour timeframe with key insights:
Analysis & Expectations
1. Overbought Condition & Rejection
Price reached a strong resistance zone (highlighted in yellow) around 1.11425 - 1.10751, leading to a sharp rejection.
The RSI is in the overbought zone (~68.43) and showing a downward slope, indicating a potential bearish correction.
Mr SMC Trading point
2. Expected Bearish Correction
A potential drop is expected toward the support level around 1.08501 - 1.07925, aligning with past price action.
The 200 EMA (1.07757) also serves as a significant support level, reinforcing a possible retracement.
3. Target Levels
Short-term Bearish Target: 1.08501 (Support level)
Key Support Zone: 1.07925 - 1.07757 (Near 200 EMA)
Conclusion
The analysis suggests a bearish retracement after the strong bullish move. Traders may look for short opportunities targeting the support level and 200 EMA while watching for confirmation signals before entering.
Pales support boost 🚀 analysis follow)

EUROUSD TRADING POINT UPDATE > READ THE CHAPTIAN Buddy'S dear friend
SMC Trading Signals Update 🗾🗺️ Euro USD Traders SMC-Trading Point update you on New technical analysis setup for Euro USD ) Euro USD Technical patterns support level pullback up trend 📈🚀 1.08254 strong 🪨 support level target 🎯 point Resistance level 1.09580 good luck 💯💯
Key Resistance level 1.09580
Key Support 1.08254
Mr SMC Trading point
Palee support boost 🚀 analysis follow)
