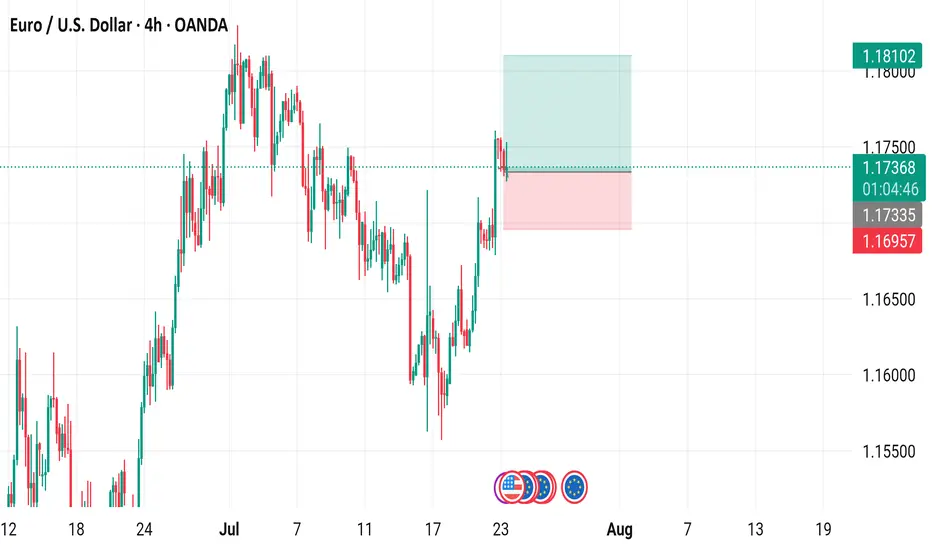
EUR/USD 4-Hour Candlestick Chart (OANDA)4-hour candlestick pattern for the Euro/US Dollar (EUR/USD) currency pair on the OANDA platform, covering the period from mid-July to mid-August 2025. The current price is 1.17358, reflecting a 0.16% decrease (-0.00186). Key levels include a sell signal at 1.17350 and a buy signal at 1.17366, with a highlighted resistance zone around 1.18102 and support near 1.16957. The chart includes technical indicators and price movements over the specified timeframe.
Eurousdforecast
"EUR/USD Technical Blueprint: Bullish Continuation EUR/USD Technical Blueprint: Bullish Continuation Patterns and Strategic Price Zones Explained
🔹 Market Structure & Trend
The chart shows a clear shift from a ranging phase into a bullish breakout:
Price previously consolidated in a broad horizontal channel, with a strong demand zone (support) established between 1.16000 – 1.16600.
Following a deep liquidity grab on July 17-18, the price bounced sharply from support, creating higher highs and higher lows – a classic bullish structure.
Current momentum shows bullish continuation, as the price broke above local resistance around 1.16645 and is now forming a potential bull flag or bullish pennant pattern.
🟢 Bullish Momentum Confirmation
Price is currently retesting the broken resistance (now acting as support at 1.16645).
If the support holds and bullish momentum continues, the measured move target projects a price move toward 1.17331, the next significant resistance level.
This is also supported by increased volume activity in the breakout zone, as seen on the VPVR.
📊 Key Technical Levels
Level Type Description
1.16000 Major Support Historical demand zone + liquidity grab
1.16645 Support Zone Previous resistance, now retest area
1.16926 Current Price Bullish consolidation forming
1.17331 Resistance Bullish target based on breakout projection
1.17700+ Extension Potential continuation level if momentum persists
🧠 Volume & Volatility Insight
Bollinger Bands are expanding post-breakout, indicating increasing volatility and a potential trend continuation.
VPVR shows a high-volume node around 1.166, confirming it as a strong demand zone.
🔎 Outlook & Strategy
✅ Bullish Bias
As long as the price remains above 1.16645, buying dips could be a favorable strategy.
A break above 1.17000 with strong volume could open a path toward 1.1733 and higher.
❌ Invalidation Level
A strong close below 1.16600 would invalidate the bullish setup and could return price to the lower support around 1.16000.
📌 Conclusion
EUR/USD is displaying strong bullish momentum after breaking a key resistance level and forming a solid support base. A breakout above 1.17000 may lead to a continuation toward 1.17331 and potentially higher. This setup favors bullish positioning with tight risk management.

EUR/USD) bearish chochy Trend Read The captionSMC trading point update
Technical analysis of EUR/USD (Euro vs. U.S. Dollar) on the 4-hour timeframe. Here’s the breakdown
---
Technical Breakdown:
1. Market Structure Shift (CHOCH):
The chart highlights a Change of Character (CHOCH), signaling a bearish reversal after a previous uptrend.
This is confirmed by lower highs and lower lows forming after the CHOCH point.
2. New Resistance Zone:
The previous support (yellow box) has now turned into a new resistance level around 1.16400–1.16700.
Price has rejected this area after the breakdown, validating the resistance flip.
3. 200 EMA Breakdown:
Price is now trading below the 200 EMA (1.15928), which reinforces bearish sentiment.
The EMA may act as dynamic resistance on any pullbacks.
4. Target Zone:
The projected target is the key support zone around 1.14582, where price consolidated before the last major bullish move.
This level has historical significance and aligns with a clean support demand zone.
5. RSI Indicator:
RSI is not yet oversold, sitting in a neutral-to-bearish range, indicating further downside potential.
Mr SMC Trading point
---
Trade Idea Summary:
Bias: Bearish
Entry Zone: On breakdown and rejection from the new resistance area (~1.16400–1.16700)
Target Zone: 1.14582 (key support)
Invalidation: A break and close above the resistance zone
Confluence: CHOCH confirmation + support-turned-resistance + 200 EMA breakdown
---
Please support boost 🚀 this analysis)

EUR/USD) Bearish breakout analysis Read The ChaptianSMC trading point update
Technical analysis of EUR/USD on the 1-hour timeframe, likely projecting a short-term downward move. Here’s a breakdown of the technical analysis and the trade idea:
---
Key Elements in the Chart:
1. Bearish Rejection from Resistance:
Price was rejected twice near the 1.14400 resistance zone (highlighted in yellow).
The red arrows mark double rejection at this level, suggesting strong selling pressure.
2. Break of Rising Channel:
Price was previously moving inside a rising channel.
Recent price action shows a clear breakdown below the lower trendline, indicating trend reversal.
3. 200 EMA (Exponential Moving Average):
EMA is around 1.13188 and price is below it, reinforcing bearish momentum.
EMA also acted as dynamic resistance after the channel breakdown.
4. Target Zone – Support Area:
The yellow support zone around 1.10911 is the target point.
This was a previous area of price consolidation and demand.
5. RSI (Relative Strength Index):
RSI is near 51, hovering around the neutral zone.
Not strongly bearish yet, but room remains to drop toward oversold if the downtrend continues.
---
Trade Idea Summary:
Bias: Bearish
Scenario:
Price has broken a key structure and is retesting the breakdown.
Expect continuation toward the 1.10900 support zone.
Entry Zone:
Near current price (~1.13400–1.13500), ideally on a retest of the EMA or broken trendline.
Target:
1.10911 (highlighted support level).
Stop-Loss (Invalidation):
A break and close back above the resistance zone (~1.14000–1.14200).
Mr SMC Trading point
---
Conclusion:
This is a high-probability bearish setup following a structure break, retest, and double top rejection. It targets a move back down toward a previously strong support level, with a favorable risk-to-reward ratio.
Pales support boost 🚀 analysis follow)

EUR/USD) breakout Analysis Read The ChaptianSMC trading point update
Technical analysis for EUR/USD (Euro/US Dollar) on a 3-hour timeframe presents a bearish outlook. Here's a breakdown of the key ideas and elements in the analysis:
---
1. Breakdown of Rising Channel
Ascending Channel: Price was moving upward within a clearly defined channel.
Breakout: The price broke below the ascending channel, indicating a potential trend reversal or correction.
---
2. Resistance Zone (Yellow Box)
Multiple Rejections: Red arrows mark points of rejection from the resistance area.
“Breakout” Label: Indicates this area was previously a support that turned into resistance after the price dropped below it.
---
3. EMA 200
The 200 EMA is plotted and the price is trading slightly above it, but very close.
A break and sustained movement below the 200 EMA would typically support a bearish trend continuation.
---
4. Bearish Projection
Downward Zigzag Path: Implies an expected short-term correction followed by further decline.
Target Points:
First target: 1.11307
Second, more extended target: 1.10639
---
5. RSI (Relative Strength Index)
Current Value: Around 38.84, which is near the oversold region (30).
Bearish Momentum: RSI is trending downwards, suggesting strengthening bearish momentum.
---
6. Fundamental Events
Multiple icons at the bottom (e.g., flags, calendar) indicate upcoming economic events/news which could influence volatility and confirm or invalidate the move.
Mr SMC Trading point
---
Conclusion:
This analysis suggests a bearish short- to medium-term outlook for EUR/USD, especially if price confirms a break below the 200 EMA. The resistance zone (around 1.133–1.135) is now seen as a supply zone, and the targets are around 1.113 and 1.106.
---
Suggestions/Considerations:
Watch the 200 EMA: A solid break below it would reinforce the bearish bias.
Monitor Fundamentals: U.S. and Eurozone economic news could heavily impact price action.
RSI Oversold Caution: If RSI dips further, a bounce might occur before full target completion.
Pales support boost 🚀 analysis follow)

EUR/USD) Big Support level Analysis Read The ChaptianSMC Trading point update
Technical analysis of EUR/USD on the 1-hour timeframe. The idea centers around a potential reversal from a major support zone, aiming for higher resistance targets. Here's a detailed breakdown:
---
1. Big Support Level
A strong horizontal support zone is highlighted around 1.1275–1.1290.
Price is currently reacting off this level, suggesting a potential bullish reversal.
2. EMA 200 as Resistance
The 200-period EMA (~1.1346) is above current price, possibly acting as a dynamic resistance.
A break and hold above it could confirm bullish momentum.
3. Resistance Levels & Target Points
The first target is the 1.14367 resistance level, a clear supply zone.
The second target point is around 1.15622, aligned with a previous major high and strong resistance zone.
4. RSI Indicator
RSI is at 44.02, indicating neutral to slightly oversold conditions—this supports a potential bullish move, especially from support.
5. Forecast Path
The chart projects a likely pullback and breakout pattern:
Rebound from the support zone.
Break through EMA 200 and minor resistance.
Rally toward first and second targets.
Mr SMC Trading point
---
Summary of the Idea:
This is a trend-reversal-to-continuation setup, with EUR/USD expected to rise from a key support area toward 1.14367, and potentially 1.15622, provided price holds above the support and breaks the EMA 200.
Pales support boost 🚀 analysis follow)

EUR/USD) resistance level rejected) Analysis Read The ChaptianSMC Trading point update
updated chart provides a more refined bearish outlook for EUR/USD. Here's the idea behind this analysis:
---
Market Structure Overview:
Resistance Level: ~1.14292
Mid Support Zone: ~1.13500
Major Support (Target Point): ~1.12658
Current Price: 1.13787
---
Indicators:
EMA 200 (1.12174): Price is above the 200 EMA, indicating an overall bullish bias, but that may be weakening.
RSI (14): Around 54.37, slightly bullish but neutral—no strong momentum.
---
Trading Idea:
1. Short-Term Bullish Move:
Price is expected to rise to test the resistance level around 1.14292.
2. Bearish Reversal at Resistance:
From there, a rejection is anticipated, leading to a drop back to the mid support (~1.13500).
3. Break Below Mid Support:
If the price fails to hold the mid support zone, a breakdown is likely to continue toward the target point at 1.12658, which aligns with the previous big support level.
Mr SMC Trading point
---
Strategy Suggestion:
Sell Setup 1: At resistance (~1.14292), with confirmation like bearish candles or divergence on RSI.
Sell Setup 2: On breakdown and retest of the 1.13500 support zone.
Take Profit: Target at 1.12658.
Stop Loss: Above 1.14300 or above the most recent swing high.
---
Pales support boost 🚀 analysis follow)

EUR /USD) bearish trand analysis Read The ChaptianSMC Trading point update
This chart presents a technical analysis of the EUR/USD pair on a 1-hour timeframe. Here's the breakdown and idea behind the analysis:
Chart Analysis Summary:
1. Trend Structure:
The price was in a downtrend, moving within a descending channel.
Recently, the price has rejected the upper boundary of the channel (noted as "down reject").
There's a 200 EMA (Exponential Moving Average) acting as dynamic support around the 1.09086 level.
Mr SMC Trading point
2. Support Zone:
A strong demand zone (highlighted in yellow) is visible near the 1.08183 area.
This zone aligns with previous structure support and a potential reversal point.
3. RSI Indicator:
RSI is around 49, showing a neutral to slightly bearish momentum.
No overbought/oversold signals yet, suggesting room for further downside before a reversal.
4. Projection Idea:
The analyst expects a possible short-term drop into the yellow support zone (target: 1.08183).
After reaching the target, a bullish reversal is anticipated, aiming for a breakout above the downtrend with a rally towards the 1.10500+ zone.
Trading Idea:
Short-Term Bearish Move: Sell toward 1.08183 if price confirms rejection of the trendline or 200 EMA.
Medium-Term Bullish Reversal: Watch for bullish confirmation (e.g., engulfing candle, RSI divergence) at the 1.08183 zone to go long toward higher highs.
Pales support boost 🚀 analysis follow)

EUROUSD TRADING POINT UPDATE > READ THE CHAPTIAN Buddy'S dear friend
SMC Trading Signals Update 🗾🗺️ Euro USD Traders SMC-Trading Point update you on New technical analysis setup for Euro USD ) Euro USD Technical patterns support level pullback up trend 📈🚀 1.08254 strong 🪨 support level target 🎯 point Resistance level 1.09580 good luck 💯💯
Key Resistance level 1.09580
Key Support 1.08254
Mr SMC Trading point
Palee support boost 🚀 analysis follow)

EUR/USD: Ascending Triangle Formation Points to Liftoff!● The EUR/USD pair tried to climb above 1.0530 but got pushed back, slipping lower.
● However, the charts are hinting at a potential breakout with an Ascending Triangle pattern forming.
● If the pair can finally break through 1.0530, it could spark a rally toward 1.0600.
● Stay tuned; the next move could be explosive! 🚀

EUR/USD Buys from 1.09400 back upEU's market structure is currently very similar to other setups I'm watching. After a bearish run over the past week, I expect price to slow down as it approaches the key 7-hour demand zone I’ve marked out. Once price sweeps the liquidity at the equal highs (EQHs), I’ll be watching for accumulation on the lower time frames (LTF) before a potential mitigation of the 7-hour demand zone.
If price doesn’t reach this demand and instead pushes up to mitigate a supply zone like the 15-hour or 5-hour above, I’ll shift my focus to selling in line with the bearish trend. For now, I’m waiting to see how the market behaves at the open to decide on the next move.
Confluences for EU Buys:
- The 7-hour demand zone has triggered a CHOCH to the upside.
- There are major imbalances and liquidity above that need to be filled.
- For price to retrace to the supply zone, it will need to move upward.
- The US Dollar Index (DXY) is sitting in a strong supply zone, which could trigger a dollar drop and support bullish momentum for EU.
Note: If price breaks through the demand zone, it will also break more significant structure to the downside, confirming a long-term bearish outlook for EU.

EURUSDT - change trend. Large Wyckoff reversal model.Large Wyckoff reversal model.
- Price is trying to break the trend line
- Price is forming a triangle
- The price made a false break of the lower boundary of the sidewall
- 12-month timeframe shows fractal reversal with three bars
if you like the idea, please "Like" it. This is the best "Thanks!" for the author 😊 P.S. Always do your own analysis before a trade. Put a stop loss. Fix profits in installments. Withdraw profits in fiat and please yourself and your friends.

Prepare to sell EUR within next 2 monthsTechnical Analysis:
- In weekly, EURUSD is doing wave ((4)) in black
- In short term, EURUSD is doing wave 2 in red
- H1 right side is turning down
- H4 right side is up
- Weekly right side is down
Technical Information:
- If you're a Swing Trader, you can sell wave ((4)) in red around 1.16
- If you're a Position Trader, you must wait for wave ((5)) in black around 0.93 to buy

eurousd monthly shark pattern hi . i think the price is forming a bullish shark pattern in monthly time frame
you can search about this pattern in google
Fibonacci point 0.886 is in line with the long-term price trend line
I expect this point to stop the price from falling
This is just a theory
And it is not an investment offer

EUROUSD DAILY TIMEFRAMESNIPER STARATEGY
EUROUSD daily timeframe
I want to show you this strategy have huge potential to forecast anything on the chart
believers will be rewarded with huge profits

Euro/Usd : Likely to continue in the same 100 pip range Speculative sentiment index is around 25% hence our advise is to find only long scalp entries in smaller time frames . Price likely to continue in the 100 pip range (1.2130-1.2250) with a minor support around 1.2100 ( EMA 50 area) . Breaking 1.2250-70 range top will push the price towards the major resistance around 1.2370.
Trend : Range
Signal : Long Scalp in 1.2130-1.2250 range

Euro/Usd : 1.1975 handle test is likely (GDP/Tapering Talks)SSI: 45%
Trend : Range
Signal : Sell @ 1.2230-1.2275
Stop Loss : 1.2290
Target : 1.1975

Euro/Usd : 100 pip daily range likely to continue Stop hunt spikes near 1.2250-1.2310 handle is possible since the speculative sentiment index is around 20% and price is consolidating in a 100 pip rage. Upside breakout is unlikely with lack of catalysts- data numbers and holiday. An eventual test to 1.1975-1.2050 area in possible before any further gain.
Trend : Range
Signal : Short Scalp 1.2250-1.2310
Stop Loss : 1.2360
Target : 1.2150-1.2050


EURUSD Wants to hit 1.198 areaCcontinuing with fiber, it seems likes to seeking price gaps after touching the target:)

EU forecastEU daily chart demonstrates a growth channel since march 2020. The candles bottoms got up. As you see the alternating behavior in this channel. I see this downward movement is not only a bearish trend but also is natural. Now the support zone 1.1875.1885 can play an elevation role for EU. So If this support breaks down, we lose this channel and face a deeper pullback. Totally I predict the trend should rise for this pair. Now I recommend to wait for daily candle to be closed.
This is not a financial advice. Just take it for training.

eurusd long Hello. Quick analysis of eurusd, to continue the bullish trend. I am interested in your opinions. All the best

EURO Has Completed Bullish Setup Against US Dollar On Long TermAfter successful BAT A very big bullish Shark pattern:
Hi folks, hope you are doing good. In my previous article on September 2019 I predicted that soon the balance between Euro and US dollar in the Forex market will be changed. As euro had formed a complete bullish Shark pattern against the US dollar pair.
Before this Shark pattern we can also examine that from December 2015 to Feb 2016 the euro completed bullish BAT patter and started is very big bullish rally from the potential reversal zone of this BAT. The rally started from Jan 2016 and ended on Feb 2018.
This time the bullish rally can be stronger than the previous one because this Shark pattern is more bigger than the previous bullish BAT as it was started from December 2016 and completed in March 2019. And this month we can see that the price line of euro has taken bullish divergence and hit the sell zone that I defined as per Fibonacci sequence of bullish Shark pattern. But after hitting the sell zone the priceline again dropped down in the potential reversal zone.
Why priceline moved down in PRZ level again?
Now the question is that what was the reason that stopped the priceline to completely enter in the sell zone to start a bullish rally. To know this we need to switch to the week chart. And here we can see that the there are four simple moving averages working as resistance. The 25, 50, 100 and 200 simple moving averages and the priceline is not able to cross up or break out even a single of them and moved down.
A formation of falling wedge:
On the same weekly chart we can also observe that the price line is moving within a falling wedge since November 2017. We can see two more touches by the candlesticks at the resistance of the wedge and after these two recent touches the resistance of the falling wedge is more confirmed. Now at this time the candlesticks are hitting at the support of the Wedge. I have also so placed the volume profile on the complete price action moving within this wedge and as result we can see that the trader’s interest is very low below $1.10 and the point of control of the volume profile is at $1.14. This time the price line is moving in the area where the traders interest is very low therefore there are strong chances that the euro will take the bullish divergence from the support of falling wedge and move up at least up to the point of control of this volume profile.
Oscillators and indicators:
If we see some indicators and oscillators then we can see that relative strength index (RSI) has already visited the oversold zone therefore I am expecting that it will not enter in oversold zone again. The moving average convergence divergence (MACD) is strong bearish and the stochastic is in bear cross. Once we will have bull cross from stochastic and MACD will be turned weak bearish from strong bearish then we can expect that the priceline will make another attempt to break out the resistance of the wedge.
And once the resistance of the wedge will be broken out then we can expect a very powerful bullish rally that can totally change the market balance between Euro and US dollar.
Note: This idea is education purpose only and not intended to be investment advise, please seek a duly licensed professional and do you own research before any investment.
