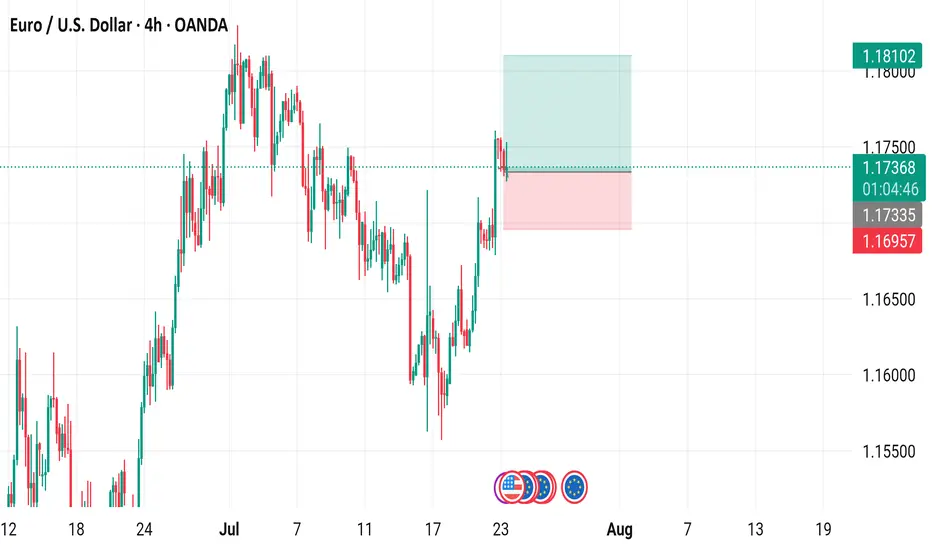
EUR/USD 4-Hour Candlestick Chart (OANDA)4-hour candlestick pattern for the Euro/US Dollar (EUR/USD) currency pair on the OANDA platform, covering the period from mid-July to mid-August 2025. The current price is 1.17358, reflecting a 0.16% decrease (-0.00186). Key levels include a sell signal at 1.17350 and a buy signal at 1.17366, with a highlighted resistance zone around 1.18102 and support near 1.16957. The chart includes technical indicators and price movements over the specified timeframe.
Eurousdsetup
"EUR/USD Technical Blueprint: Bullish Continuation EUR/USD Technical Blueprint: Bullish Continuation Patterns and Strategic Price Zones Explained
🔹 Market Structure & Trend
The chart shows a clear shift from a ranging phase into a bullish breakout:
Price previously consolidated in a broad horizontal channel, with a strong demand zone (support) established between 1.16000 – 1.16600.
Following a deep liquidity grab on July 17-18, the price bounced sharply from support, creating higher highs and higher lows – a classic bullish structure.
Current momentum shows bullish continuation, as the price broke above local resistance around 1.16645 and is now forming a potential bull flag or bullish pennant pattern.
🟢 Bullish Momentum Confirmation
Price is currently retesting the broken resistance (now acting as support at 1.16645).
If the support holds and bullish momentum continues, the measured move target projects a price move toward 1.17331, the next significant resistance level.
This is also supported by increased volume activity in the breakout zone, as seen on the VPVR.
📊 Key Technical Levels
Level Type Description
1.16000 Major Support Historical demand zone + liquidity grab
1.16645 Support Zone Previous resistance, now retest area
1.16926 Current Price Bullish consolidation forming
1.17331 Resistance Bullish target based on breakout projection
1.17700+ Extension Potential continuation level if momentum persists
🧠 Volume & Volatility Insight
Bollinger Bands are expanding post-breakout, indicating increasing volatility and a potential trend continuation.
VPVR shows a high-volume node around 1.166, confirming it as a strong demand zone.
🔎 Outlook & Strategy
✅ Bullish Bias
As long as the price remains above 1.16645, buying dips could be a favorable strategy.
A break above 1.17000 with strong volume could open a path toward 1.1733 and higher.
❌ Invalidation Level
A strong close below 1.16600 would invalidate the bullish setup and could return price to the lower support around 1.16000.
📌 Conclusion
EUR/USD is displaying strong bullish momentum after breaking a key resistance level and forming a solid support base. A breakout above 1.17000 may lead to a continuation toward 1.17331 and potentially higher. This setup favors bullish positioning with tight risk management.

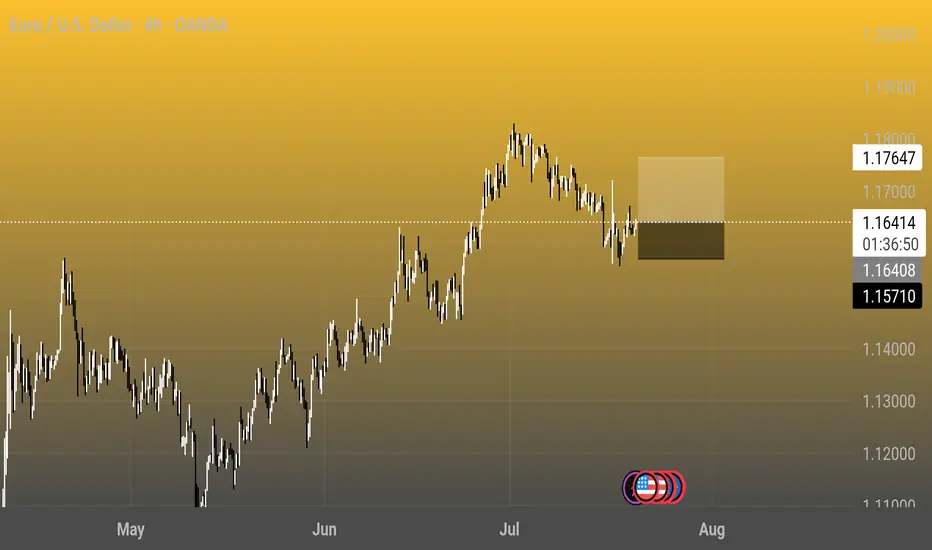
Euro / U.S. Dollar 4h Chart - OANDA4-hour candlestick chart showing the exchange rate between the Euro (EUR) and the U.S. Dollar (USD) from May to August 2025. The current rate is 1.16416, with a 0.14% increase (+0.00161). The chart highlights a peak around late June to early July, followed by a decline, with notable support and resistance levels marked at 1.17647 and 1.16416, respectively.
EUR/USD 4-Hour Chart - OANDA4-hour performance of the Euro/US Dollar (EUR/USD) currency pair on the OANDA platform as of July 17, 2025. The current exchange rate is 1.16408, showing a slight decline of 0.01%. Key levels include a buy signal at 1.16417 and a sell signal at 1.16399, with recent price action ranging between 1.1452 and 1.17245. The chart includes candlestick patterns and shaded areas indicating potential resistance and support zones.

EUR/USD 4-Hour Chart (OANDA)4-hour performance of the Euro/US Dollar (EUR/USD) currency pair on the OANDA platform as of July 10, 2025. The current exchange rate is 1.16920, reflecting a 0.25% decrease (-0.00298). The chart includes a candlestick representation with a highlighted resistance zone between 1.1692 and 1.17477, and a support zone around 1.16523. Buy and sell signals are marked at 1.16927 and 1.16912, respectively, with a spread of 1.5 pips.

EUR/USD 2-Hour Chart (OANDA)2-hour performance of the Euro/U.S. Dollar (EUR/USD) currency pair on the OANDA platform as of July 10, 2025. The current exchange rate is 1.17225, reflecting a slight decrease of 0.03% (-0.00032). The chart includes buy (1.17234) and sell (1.17216) prices, with a highlighted resistance zone and recent price movements over the past month, showing fluctuations between 1.16500 and 1.18000.

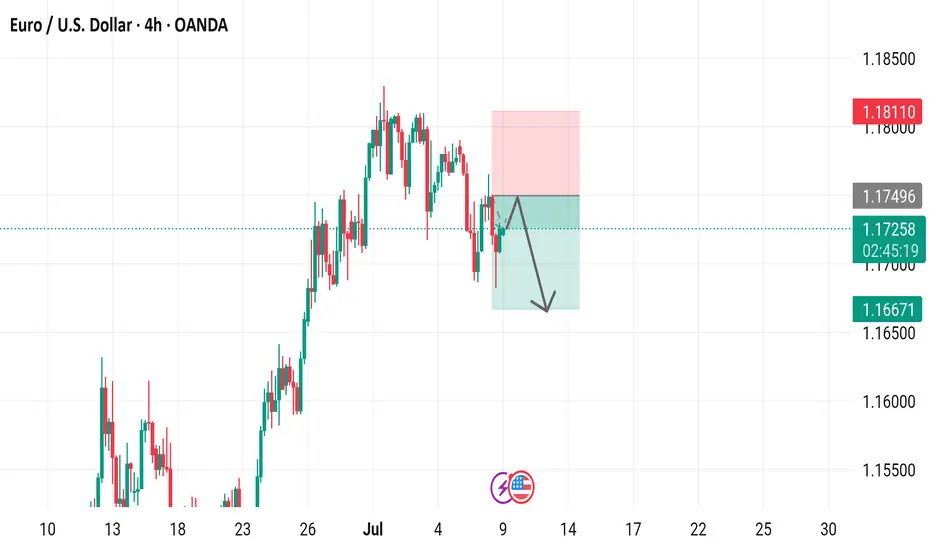
EUR/USD 4-Hour Chart Analysis4-hour candlestick chart for the Euro/U.S. Dollar (EUR/USD) currency pair on the OANDA platform. The chart shows a recent upward trend followed by a consolidation phase, with key technical levels and trading signals indicated. The presence of "SELL" and "BUY" signals suggests active trading opportunities. The downward arrow within the shaded area hints at a potential bearish move. This chart is likely used by traders to analyze short-term price movements and make informed decisions.
EUROUSD 4H LONG (ALL Targets DONE)This position worked perfectly.
Now it is important to wait for the correction structure, as it was indicated in the previous update post:
Considering the current formations on the 1D TF, the probability of price growth to the current maximum increases multiple times. Locally, I expect to see a price correction (a rollback next week) and preferably with a depiction of a bullish imbalance. After which, you can work long for a whole month until 1.12758

Prepare to sell EUR within next 2 monthsTechnical Analysis:
- In weekly, EURUSD is doing wave ((4)) in black
- In short term, EURUSD is doing wave 2 in red
- H1 right side is turning down
- H4 right side is up
- Weekly right side is down
Technical Information:
- If you're a Swing Trader, you can sell wave ((4)) in red around 1.16
- If you're a Position Trader, you must wait for wave ((5)) in black around 0.93 to buy

eurusd is forming Shark Pattern ..eurusd is forming Shark Pattern
not a financial advice just for learning purpose..

Eurusd long running 3%Currently in eu long running 3%, Risk is of the table. Partials Taken. We are making higher highs and higher lows on the 1hr time frame, however we had a 1HR bos. I looked for a confirmation entry on the lower time frame in the 4hr buy range discount area. Protected my capital nice and quickly aiming for 50% of my trade @ 3%. 2 from 2 trades today. No loss. Trading day is over. I will the other half of this trade play out. Price action could still come down lower as there is liquidity to the left and imbalance below.
Check out my trade earlier.
Trade safe !! Have an awesome week!

Euro/Usd : Likely to continue in the same 100 pip range Speculative sentiment index is around 25% hence our advise is to find only long scalp entries in smaller time frames . Price likely to continue in the 100 pip range (1.2130-1.2250) with a minor support around 1.2100 ( EMA 50 area) . Breaking 1.2250-70 range top will push the price towards the major resistance around 1.2370.
Trend : Range
Signal : Long Scalp in 1.2130-1.2250 range

EUR/USD AnalysisHello traders, here is the analysis from our team. EUR/USD .
Let us know in the comment section below if you have any questions.😉
OANDA:EURUSD

EUROUSD IDEAPrice action has once again proved that it works with news. Before the NFP news, price was near the dynamic support of the trendline and as the news broke, there was a sharp rejection to the upside which is normally expected when price meets a support. Drawing my harmonic pattern, i expect price to break through the upper trend line as the overall trend of EU has been downward for a while now. once cannot necessarily be sure of what the Market makers will do but i will be setting my various TP at the different resistance levels i have while using a trailing stop loss and proper risk management system.
