Silver Breakout, Tech Resistance & TRY Rotation 📊🔥 Silver Breakout, Tech Resistance & TRY Rotation – Structure Meets Reality 🌍📉
Hey traders, FXPROFESSOR here 👨🏫
Today’s charts show how technical structure and real-world capital behavior can tell one powerful story. We’re watching Silver surge, Tech stall, and the Turkish Lira react to local capital flows — all aligning with clean market levels.
Let’s break it down:
🔍 Silver (XAG/USD)
Price exploded into $39.30, reaching the top of a well-defined ascending channel.
Now stalling — pullbacks toward $35.38 or even $32.17 would be natural.
🧠 Structurally strong, fundamentally backed by industrial demand, inflation hedging, and tight supply dynamics. Just not a good timing to 'ape it' today.
📉 US Tech 100 (USTEC)
Testing resistance around 23,434.
RSI and OBV show signs of exhaustion, suggesting potential pause or pullback.
In a stretched macro environment, tech is vulnerable to rotation — especially if yields shift or inflation expectations change.
💱 EUR/TRY – Turkish Lira Rotation
We just saw a sharp rejection at 47.78, a key round-number resistance.
On the ground, there’s a notable shift — My Turkish brother says 'FX profits being converted into real estate and hard assets, especially by locals and returning expats'. And I trust a good Turk as much as i trust my Greek family! (yes, we can be friends when there is respect and no hatred! common interests work best in this troubled world)
The chart reflects this move: potential drop toward 46.00 → 45.45 → 43.79 if momentum fades.
🧩 What These Charts Teach Us
This is a perfect storm where technical resistance, macro rotation, and local capital behavior all align:
🔹 Silver rising = hard assets in favor
🔹 Tech pausing = overextension risk
🔹 TRY dropping = profit-taking & capital redeployment
Trade what you see — but understand why it’s happening.
One Love,
The FX PROFESSOR 💙
Disclosure: I am happy to be part of the Trade Nation's Influencer program and receive a monthly fee for using their TradingView charts in my analysis. Awesome broker, where the trader really comes first! 🌟🤝📈
EUR TRY

EUR/USD 4-Hour Chart - OANDA4-hour performance of the Euro/US Dollar (EUR/USD) currency pair on the OANDA platform as of July 17, 2025. The current exchange rate is 1.16408, showing a slight decline of 0.01%. Key levels include a buy signal at 1.16417 and a sell signal at 1.16399, with recent price action ranging between 1.1452 and 1.17245. The chart includes candlestick patterns and shaded areas indicating potential resistance and support zones.

EUR/USD 4-Hour Chart Analysis (ONDA)Euro/US Dollar (EUR/USD) exchange rate over a 4-hour interval, sourced from ONDA. The current rate is 1.16177, reflecting a 0.08% increase (+0.00093). The chart highlights a recent upward trend, with a resistance level around 1.16746 and a support zone between 1.15439 and 1.16000, as indicated by the shaded areas. The time frame covers late June to early July 2025.

EUR/USD 2-Hour Chart Analysis2-hour candlestick chart for the Euro/U.S. Dollar (EUR/USD) currency pair, sourced from OANDA, as of June 23, 2025. The current exchange rate is 1.14705, reflecting a 0.45% decrease (-0.00517). The chart highlights recent price movements, with a marked resistance zone around 1.15218 and a support zone near 1.14483. An upward trend is indicated with an arrow, suggesting potential price action toward the resistance level.

EUR/USD Potential Reversal from Resistance Zone –Bearish OutlookThe EUR/USD pair has been trading within a well-defined ascending channel for several weeks. Price recently tested a strong resistance zone near 1.15850 – 1.16000, which aligns with the upper boundary of the channel and a previously marked supply area.
Key observations:
The price action shows signs of rejection from the resistance zone with a potential double-top or fakeout pattern forming.
A projected bearish trajectory is marked, suggesting a possible break below the channel support.
Immediate bearish targets are set at key demand zones around 1.14500, 1.12500, and further down to 1.10500.
A large red arrow indicates the strong downside bias if the price confirms the breakdown.
Conclusion:
If EUR/USD fails to sustain above the 1.15850 resistance zone and breaks below the ascending channel, a strong bearish correction is anticipated. Traders should watch for confirmation of the breakdown before entering short positions.

EUR/USD Bearish Reversal AnalysisEUR/USD Bearish Reversal Analysis 📉🧭
🔍 Technical Breakdown:
Trend Structure:
EUR/USD was trading inside an ascending channel, respecting both support and resistance trendlines.
🔴 Double Rejection at Resistance:
Price action faced strong rejection near the upper boundary of the channel and resistance zone (~1.16500), forming a lower high, suggesting bearish exhaustion.
🟠 Key Breakdown Zone:
A critical horizontal support around 1.13560 has been identified as a short-term target zone. This level previously acted as a demand zone and now may be retested.
🔽 Forecast Path:
A projected bearish wave is anticipated:
A potential pullback or consolidation may occur before resuming the downtrend.
Once 1.13560 is broken, price could drop further toward the major support zone around 1.12000, marked by the previous accumulation area.
🟦 Support Zone:
This final target aligns with a major structural support from late May, strengthening the bearish outlook if the breakdown continues.
📌 Conclusion:
EUR/USD is showing signs of a bearish reversal after failing to sustain above resistance. As long as it remains below the mid-channel region, further downside toward 1.12000 is likely, with 1.13560 as the key short-term level to watch.

Mr. Wave Says... It’s Time for the Last Push!”[ b] EUR/USD is forming a clean Elliott Wave structure — and guess what?
We’re at Wave 4 consolidation, and Wave 5 is about to explode upward!
🔍 Here's what we're seeing:
✅ Wave 1 to 3 already confirmed with solid impulse
✅ Wave 4 found support near previous breakout zone
🎯 Target: Upper supply zone where Wave 5 is likely to terminate
🔔 This isn’t the time to sleep on the charts. Mr. Wave is literally pointing to the target zone — and we’re not ignoring it. 😉
---
🧠 Pro tip:
Use tight risk management, ride the final push of the motive wave, and watch for reversal signals in the supply zone.
---
📌 #GreenFireForex #ElliottWave #Wave5 #ForexTrading #TechnicalAnalysis #EURUSDSetup #ForexReel #WaveTheory #SupplyZone #ForexSignal #SmartTrading

EURUSDThis is the most awaited push.
With the re-tests and each weak hand to strong hand transfer I see this level as a very strong support and the area to start the most expected rally of the USD alternative.

EURTRY Rejected at 44 – Time to Drop? 📉 EURTRY Hits 43 – Time to Drop? 🧭💥
The EURTRY has just reached 43, completing a multi-year journey that began with our pinpoint entries from as low as 15.7. The rejection at 44.2, just beneath the technical resistance at 45.5 , signals a likely pause—and possibly a sharp reversal.
🧠 Trade History Recap:
• Rejection at 10 ➝ Support at 8 ➝ Target 15.7 hit
• Entry at 20 ➝ Target 26.5 ➝ Final Target 43 ✅
• Now, we’re setting sights on a retracement to 33 based on Fibonacci levels.
🔽 Short-Term View:
With the upside target hit, we're now anticipating a short-term pullback to 40 , and possibly deeper toward 33 , as seen in the newly drawn projections. The rejection candle confirms bearish pressure.
📰 Macroeconomic Backdrop:
• April 2025: Turkey’s central bank raised rates to 46% to contain inflation and stabilize the Lira.
• Despite rate hikes, TRY remains under pressure, with over $25 billion in reserves used to defend it.
• Inflation expectations have surged to 29.75% by year-end, reflecting economic instability.
💬 Takeaway:
We may be entering a new chapter. The beast (inflation) is being fought hard, but fundamentals still point to continued volatility . This is a spot to consider profit-taking or even short setups .
🛍️ Bonus thought: This may also be a great time for a visit to Istanbul while the Lira remains weak.
🌍 To our Turkish friends: Peace, stability, and stronger days ahead. Our charts are technical, but our message is human.
One Love,
The FXPROFESSOR 💙

Turkish Lira Rebound- Just EPIC This has to be one of the biggest FX candlesticks of all times!
Turkish President Recep Tayyip Erdoğan on Dec. 20 announced a series of measures to encourage lira-denominated savings, easing the pressure on the Turkish currency.
In a televised speech following a Cabinet meeting, Erdoğan said the government would offer a new financial vehicle that would “alleviate" the concerns of citizens who have been buying foreign currency, fearing that returns on their lira savings are being eroded. Turkish lira deposit holders would be compensated for possible losses from the decline of the local currency, he said, but did not provide details. “From now on, our citizens won’t need to switch their deposits from Turkish lira to foreign currency, fearing that the exchange rate will be higher," Erdoğan said.
This Turkish serial is to be continued: While the government called the lira's rebound on Monday a major win on policy, economists have said Erdogan's economic program based on low-interest rates is reckless and expect inflation.
Trump was known for his Trumponomics but Erdogan has taken his Erdonomics to the NEXT level! Simply EPIC volatility and very risky decisions against the logic and his people.. not sure if I would want to trade this one.
Despite being a Greek Cypriot, i am hereby sending my regards to all Turkish friends. Wish you all a Merry Xmas and a good future close tot eh West, not against the West.
One Love Arkadaşlarım,
the FXPROFESSOR

EURTRY - Inflation Beast is Back EURTRY :
Our first idea/post was on the Epic rebound of the Turkish Lira back in Dec 21st /2021
We had then calculated and prognosed with great precision the levels (rise to 15,7) :
The price has done us the favor then and normalized/consolidated around that level (15,7) :
At this stage, Central bank has kept the lira's rates unchanged (good news because every time they intervene there is panic amongst Turkish citizens and Lira holders) but Inflation is a BEAST out of control:
Turkey’s inflation rate soars to almost 70 percent : www.aljazeera.com
Turkey's role in the Ukraine crisis is something Erdogan can use nicely as long as he can balance between a 'neutral stance' with doors open to Russia and still in Nato' and part of the Western front. If the West wishes to shift him on one side though the Turkish lira might end up under severe pressure again.
Don't forget that there are elections next year and Erdogan is probably not feeling the safest at this moment.
Let's hope everything goes well in the world as well as in Turkey and that Turkey can play a peaceful role in ending the war in Ukraine.
This will be interesting to see.
One Love,
the FXPROFESSOR

EURUSD:SIGNALHello friends
Due to the recent price growth, the price has now corrected in a support range.
Now, if the price continues to fall within the specified support ranges, we can make purchases with capital management and move to the specified targets.
*Trade safely with us*

EUR/USD 4H Trading Plan: Buy Setup & Target Projection📊 EUR/USD 4H Analysis
🔵 Support Zone (1.07584 - 1.0800) 🔵
📌 Expected Reversal Area – Buyers might step in here.
⚠️ Stop-Loss Below ❌ (If price breaks lower, trade is invalid).
🟦 Resistance Zone (~1.0875 - 1.0900) 🟦
📌 First Hurdle – Price may face resistance here before moving higher.
🎯 Target Point: 1.10229 🎯
✅ Final Take-Profit Level – If price reaches here, trade is successful!
📉 Plan:
🔻 Expect a drop into support first…
🔄 Bullish reversal from support…
🚀 Uptrend toward 1.10229!
🔴 Stop-Loss Below 1.07584 (🚫 Safety Net).
🟢 Entry Around Support Zone (✅ Buy Opportunity).
🔵 Exit at Target Point (1.10229) (💰 Profit Zone).
📝 Final Thought:
If the price respects the support zone 🟢, a BUY trade is valid. If it breaks lower 🔴, it's best to step out! 🚀

Ethereum (ETH/USD) Breakout – Next Targets $2,328 & Beyond!
Overview:
Ethereum has been in a downtrend, forming a descending channel, but it recently found strong support at $1,764 and has now broken out of a range-bound consolidation. This could be the beginning of a bullish move towards higher resistance levels.
Key Market Structure Analysis:
🔸 Previous Downtrend: ETH was trading within a bearish channel, creating lower highs and lower lows before bottoming out.
🔸 Accumulation Phase: A sideways consolidation range between $1,764 - $2,017 formed after the downtrend, signaling potential accumulation.
🔸 Breakout Confirmation: ETH has broken above the $2,017 resistance, suggesting that buyers are stepping in.
Potential Trade Setup:
✅ Bullish Scenario:
A successful breakout retest around $2,000 - $1,950 could provide an entry opportunity.
Upside targets:
🎯 $2,328.95 – Major resistance level from previous price action.
🎯 $2,559.17 – Next key resistance if momentum continues.
⚠️ Bearish Scenario (Invalidation):
A drop below $1,950 - $1,900 could push ETH back into the previous range.
Losing the $1,764 support could lead to a retest of $1,600 or lower.
Final Thoughts:
Ethereum is showing strength after breaking out of a key consolidation range. If the breakout holds, ETH could be gearing up for a strong rally toward $2,328 - $2,559. However, a retest of the breakout zone may provide a better risk-to-reward entry.
What do you think? Will ETH push toward $2,328 next? Drop your thoughts below! 🔥📈

EUR/USD 15-Minute Chart - Bearish Reversal Trade SetupEUR/USD 15-Minute Chart Analysis
Market Overview:
Current Price: 1.09154
Recent High: 1.09283 (Price rejected from this level)
Volume: 2.91K (Moderate trading activity)
Key Levels:
Resistance: 1.09283 (Strong rejection zone)
Support Levels:
1.09000 (Psychological level)
1.08877 (Major support & target area)
Trade Setup:
Bias: Bearish (Potential reversal after strong upward move)
Entry: Below 1.09100 after confirmation
Take Profit Levels:
TP1: 1.09000
TP2: 1.08900
TP3: 1.08877
Trade Confirmation:
A break and retest of 1.09100 as resistance will confirm bearish momentum.
If price fails to break below 1.09100, bulls might regain control.
Risk Management:
Stop Loss: Above 1.09283 (To protect against a breakout)
Risk-to-Reward: Favorable, as price is showing early signs of reversal.
Conclusion:
Bearish rejection at 1.09283 suggests a possible short trade opportunity.
Wait for price action confirmation below 1.09100 before entering.
Watch volume and momentum for further confirmation of direction.

EURUSD ANALYSIS ENGULGING THEORY BASEDEurusd currently in mid 2 zone if market go upside we can see down fall our that first level or if market go down then we can see buy from these 2 levels that i mentioned in chart lets see what will happen.
Note ! dont trade without knowledge becouse your harder money market will not see and dont put your whole amount in trade takecare.

Sell Signal📉 EURUSD Sell Signal 📉
🔹 Wait for the best candle formation before entering the sell trade! Risk management is crucial.
🔹 The 1.04980 resistance zone is considered as the entry point.
🔹 Stop-loss is set at 1.05355 to minimize potential risks.
🔹 Target levels:
✅ First target: 1.04658
✅ Second target: 1.04133
⚠️ Always manage your risk! Make sure to get additional confirmations before entering the trade.

EURUSD Buy📉 EURUSD Signal | 1H Timeframe Analysis
📆 Date: February 7, 2025
🔍 Strategy: Breakout and Risk Management
✅ Suggested Position: Buy after pullback confirmation
🎯 Targets:
First Target: 1.04016
Second Target: 1.04429
Third Target: 1.04938
🛑 Stop Loss: 1.03083
🔄 Entry Level: Confirmed breakout at 1.03372
⚠ Key Points:
Enter if a pullback to 1.03372 is confirmed.
Set stop loss at 1.03083.
Apply proper risk management.
📊 Technical Analysis: The previous downtrend has been corrected, and we are in a demand zone. If the key level breaks, an upward move is expected.
#Forex #TechnicalAnalysis #EURUSD

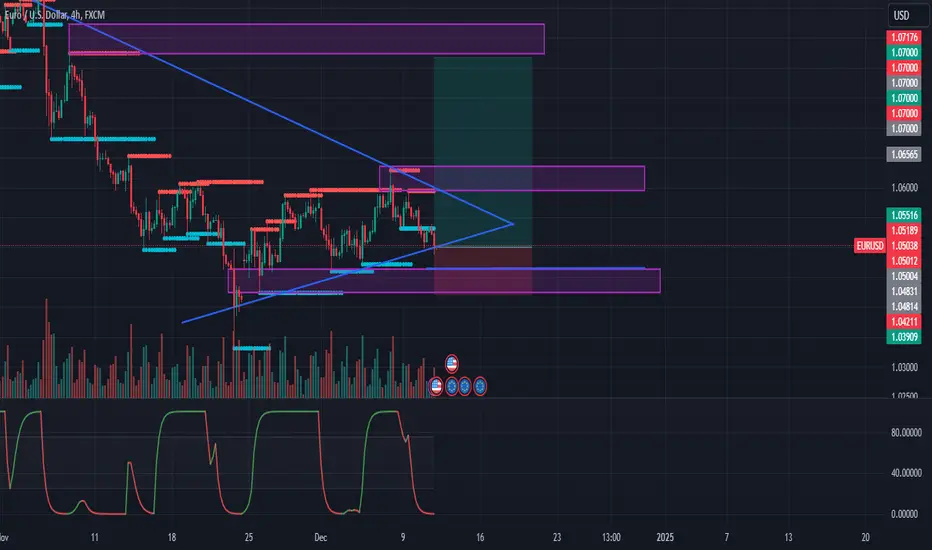
EUR - Long - Re-entryNew opportunity to go long. It's a risky trade, and we need to break 1.062.
T1: 1.06 (protect trade).
T2: 1.08 (partial or close).
T3: 1.09 (close - daily chart).
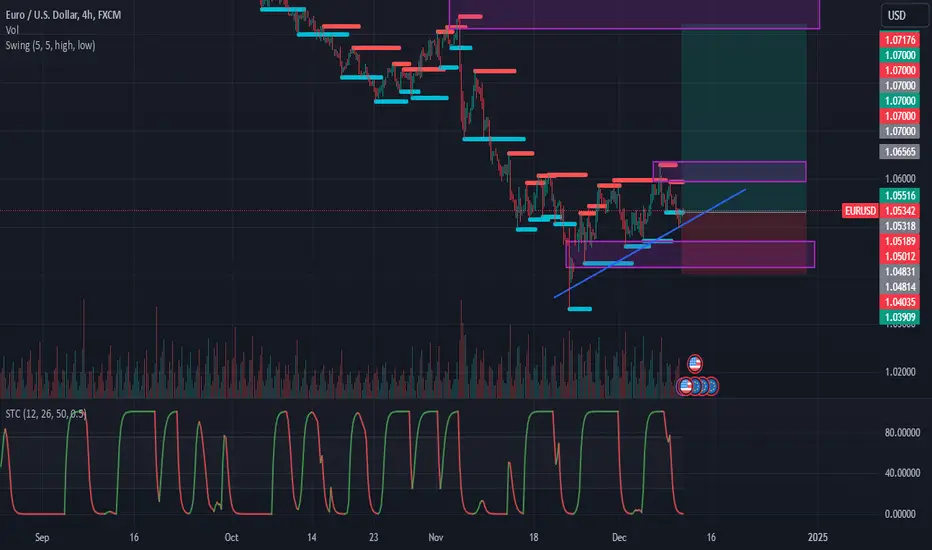
EUR- Long - Re-entryNew opportunity to go long. It's a risky trade, and we need to break 1.062.
T1: 1.062 (protect trade).
T2: 1.08 (partial or close).
T3: 1.09 (close - daily chart).
#EU ANALYST #EU analyst
Currently, the price is still reacting at FVG monthly frame, you can wait for LTF (H4) to create MSS.i as shown in picture 2 and then find a buying point up to BSL.
* If the price sweeps liquidity or Asia.Sweep then creating Mss.i will be safer. If the price drops and does not create Mss.i, I will update again.
Goodluck🥰🥰

EURGBP ASCENDING TRIANGLE TRADERight then, can see we have come to a major level of significant resistance and we are seeing bearish pressure as a reaction to it (has been of significance for a while so other people will look to trade this level aswell). If i see alot of bearish pressure i will be entering as other traders will do the same and bring down price in favour

XAUUSD SHORT TRADEConsolidating for some time, seen alot of short term resistance at current area of volatility and will be looking for next bearish swing to support
