KNOW WHAT TO LOOK FOR IN A RANGE PATTERNThe market is working a range pattern the majority
of the time which is good news if you know what to look for.
Range patterns are full of information that will help you anticipate what comes next, so you can trade. Here are 3 examples that will make you chart smarter!
The first chart is my personal favorite range pattern. When you see a well established range, watch for price to "overshoot" your expected high or low. When that happens, get ready! As soon as it goes past the expected high or low, place pending orders to sell from the top or buy from the bottom. If price comes back to the range, it will come back fast!
The 2nd chart is an example of past performance predicting future price movement. During a range pattern, look back 15 bars from the middle of the range, and anticipate the market moving that far in the opposite direction. In this example, the solid arrow is predictive of the dashed arrow.
The last chart is an example of how the typical slow or no momentum you would expect is happening in the middle third, shaded in orange. To and from the outer edges of the range, momentum shows up.
Euruad


EURAUD - TRADE THIS SMART - THE WEEK AHEADSee previous analysis
PLEASE SUPPORT THE MOVEMENT WITH YOUR LIKES, COMMENTS AND FOLLOW FOR MORE

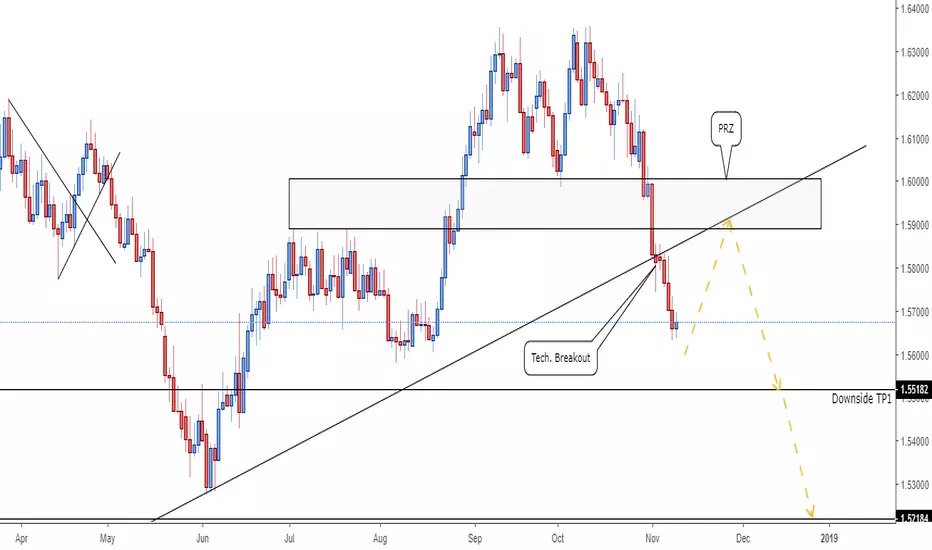
EUR/AUD Bearish Run to Continue? - Swing Trade SetupWe had a big move down after the flash crash but this bearish momentum has continued to hold sway. Based on how fast we moved last week we will probably get a drawback first, but I am looking for a strong bearish breakout to stay below the kumo and break the support line I've drawn for entry. I've drawn several targets including my long term one as our final swing Take Profit level. We do have a bearish kumo twist already and chikou span is below price and clear, but it would be helpful if chikou span can get below the cloud as well. If we fail to move lower or break our support line for entry, this setup may become invalidated.


EURAUD - MORE UPSIDE COMING FOR THIS PAIRI AM EXPECTING EURAUD - MORE UPSIDE COMING FOR THIS PAIR
LIKE, FOLLOW AND COMMENT

EURAUD - LOOKING FOR DOWNSIDEHello traders. We are looking for downside on this pair (and possibly upside correction which will be tradable) Make sure you use corect MM and Strategy.


EURAUDEURAUD has just formed under the strong daily support. Heading towards the target to complete the potential H&S.


05-13/07/2018For technical analysis:
Please review the notes below
Pair in very strong resistance areas represented:
1 - historical resistance represented by the levels of the Maori Math
2. Very strong buying signals at resistance levels in Stochastic, RSI and CCI
3. Very strong resistance levels with Fibonacci levels at 61.8-78.2 coming from top to bottom
4 - opportunity to sell another list at the highest R2 resistance at the highest levels where these levels if the price reversed and arrived to designate it that the region proves its strength as a resistance after the price broke in the past and was a support area and then turned to resistance
5. The pair now has two peaks as shown on the chart
Personally better selling than buying
And preferably to be out of the agreement according to the proportion of risk on your account does not exceed 5%
Open the jar and wait for the break on the smaller ferris and Bryce Action
6 - The areas that have been identified are not pending orders, but areas may reach the price and then rebound with the advent of signs of sale or purchase, for example, fluctuations or fluctuations or price Action and ...
7-DEFERGENCY between price, MACDY and CCI on four-hour frame

EURAUD, shortRisk on mood brought strength to the aussie with ease of tentions with China after weekend announcement that the 'trade war is on hold'. EUR continues to sell against the majority of currencies.
Current set-up offers good risk-reward and is in line with fundamentals. Fib levels seem to be respected so first obstacle in the way is 61.8% retracement. Potential to take profits and re-enter there.
Happy Trading!

EURAUD - What will happen?If you look on the weekly time frame, EURAUD will be showing multiple rejections on a very significant weekly resistance level;
On this chart i'm on the daily time frame, and as of right now price is moving between two different zones, showing a strong fight between bears and bulls.
My bias is short, If we get a strong bearish daily close below the grey box and below my trendline,
I believe we will be moving down to the next zone.
for now, I'll sit on my hands and see how price action plays out.


EURAUD Short Trade SetupHello traders
I'm waiting for breaking of green trendline and correction to take short trade.Down move will be either weekly impulse or weekly corrective structure. It is not clear yet, bu we can expect vey big down move after the completion of up impulse:


EURAUD Short IdeaPending Short @ 1.5060
Stop Loss @ 1.5160
Target @ 1.4770
RR Ratio @ 2.9
Trading involves substantial risk of loss. I'm just providing insight into what trades I'm taking.


EURUAD: Major Support / Go ShortThere price is getting close to the major resistance level at 1.4760. The market moves sideways last few weeks and it respected that resistance many times and it is more likely it will do again. If you are an aggressive trader, you may place your sell limit order at the key level. For more conservative traders, wait the confirmation bar and then open the position.

