EURUSD: focus on inflationThis week was calm when it comes to currently important US macro data. The most important event was related to the release of the FOMC meeting minutes from the June session. There was no new information revealed in the Minutes, which has not already been communicated with the public. The Fed is aimed to maintain flexibility around future rate cuts. They will most probably remain on hold until the economic data more clearly supports a slowdown. Analysts continue to be of the opinion that the Fed will most probably make the next rate cut somewhere in late 2025 and into 2026. Such opinion is supported with ongoing risks of both rising inflation and unemployment due to introduced trade tariffs, putting challenge to Fed officials.
Industrial Production in Germany during May increased by 1,2% for the month, which was much better from estimated 0%. Retail Sales in the Euro Zone dropped in May by -0,7%, bringing the indicator to the yearly level of 1,8%. Balance of Trade in Germany in May reached euro 18,4B, better from expected euro 15,5B. Inflation rate in Germany, final for June, was standing at the level of 0% for the month and 2% for the year. Both figures were in line with market expectations. Wholesale prices in Germany in June were higher by 0,2% and 0,9% on a yearly basis.
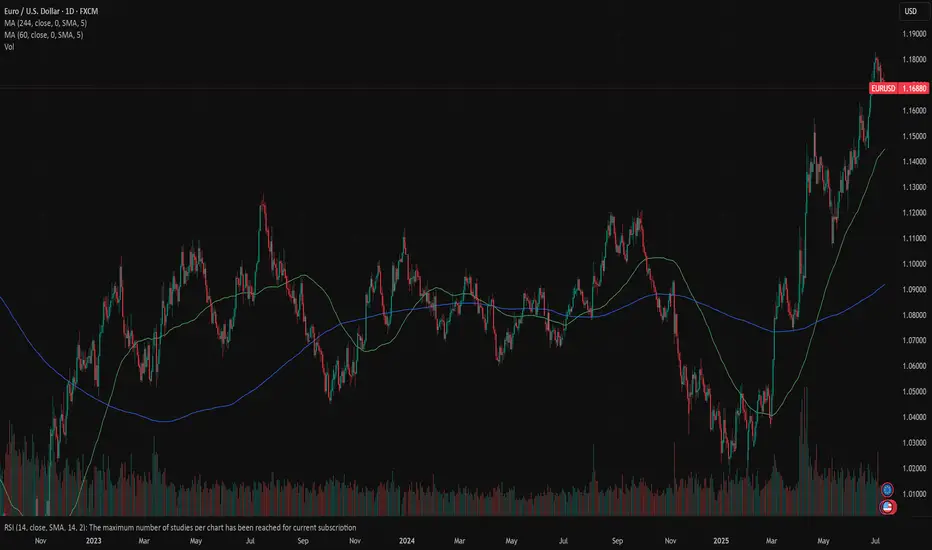
Markets favored US Dollar during the previous week, where the eurusd was traded within a range from 1,1790 down to 1,1670. The RSI moved from the overbought market side, ending the week at the level of 57. As long as the indicator is holding above the level of 50, there will be no indication that the market has started to clearly eye the oversold market side. At the same time, the MA50 continues to strongly diverge from MA200, within an indication of a potential slowdown in the coming period, as well as potential crossovers.
Although this week was a relatively calm one, the week ahead brings some important US macro data, including June inflation, PPI and University of Michigan Consumer Sentiment data. Considering current market sensitivity on any negative movements in inflation figures, the week ahead might bring some increased volatility on financial markets. As per current charts, eurusd has some space for a further move toward the downside, at least till the level of 1,1650. There is also potential for a short term reversal indicated on charts, with some potential that 1,1750 might be tested during the week.
Important news to watch during the week ahead are:
EUR: Industrial Production in the Euro Zone in May, ZEW Economic Sentiment Index in July in the EuroZone and Germany,
USD: Inflation Rate in June, Producers Price Index in June, Retail Sales in June, Building Permits preliminary for June, Housing Starts in June, Michigan Consumer Sentiment preliminary for July.
EURUSD-2
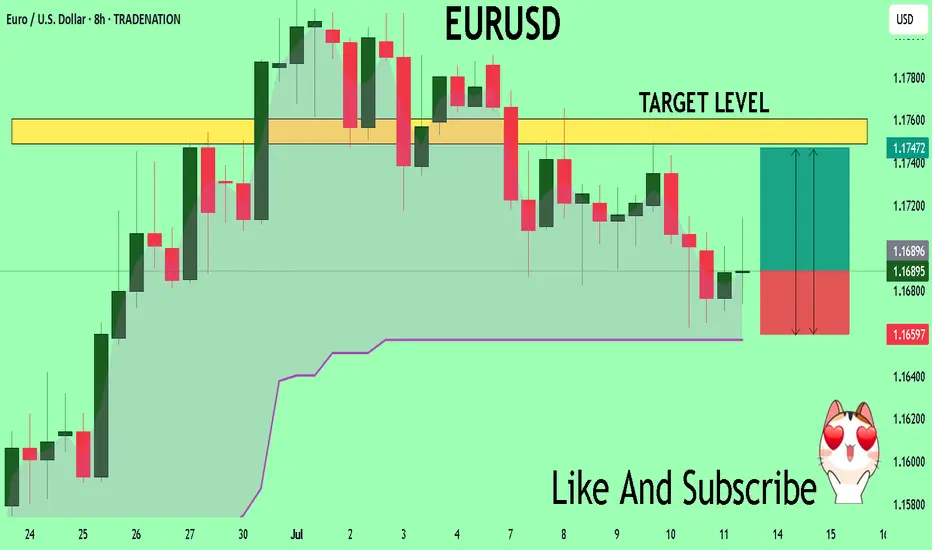
Week of 7/13/25: EURUSD AnalysisLast week's candle was a bearish engulfing meaning that most likely price will continue lower this week as a daily trend retracement. Waiting for LTF bearish price action before entering.
Major News:
Tuesday - CPI
Wednesday - PPI
Thursday - Unemployment

EUR-USD Will Keep Growing! Buy!
Hello,Traders!
EUR-USD keep trading in
An uptrend along the rising support
So as the pair is approaching
A the support we will be
Expecting a bullish rebound
And a move up on Monday
Buy!
Comment and subscribe to help us grow!
Check out other forecasts below too!
Disclosure: I am part of Trade Nation's Influencer program and receive a monthly fee for using their TradingView charts in my analysis.

EURUSD: Long Signal with Entry/SL/TP
EURUSD
- Classic bullish formation
- Our team expects pullback
SUGGESTED TRADE:
Swing Trade
Long EURUSD
Entry - 1.1689
Sl - 1.1627
Tp - 1.1799
Our Risk - 1%
Start protection of your profits from lower levels
Disclosure: I am part of Trade Nation's Influencer program and receive a monthly fee for using their TradingView charts in my analysis.
❤️ Please, support our work with like & comment! ❤️

Bearish Signal | Technical + Custom AlgoSmart Trend Signal | Technical Analysis + Custom Algorithm
This signal is the result of a combination of classic technical trend analysis and a proprietary software I personally developed.
Two Brains, One Trade: Why You Freeze Under PressureBy MJTrading:
In trading, your biggest opponent isn’t volatility.
It’s your own neural wiring.
Every trader operates with two main systems:
🧠 System 2 – Rational, deliberate, planning (Prefrontal Cortex)
🧠 System 1 – Emotional, instinctive, fast (Amygdala & Limbic Brain)
Before entry, System 2 is in control. You feel calm, logical.
But the moment money is at risk—especially in drawdown or after a missed TP—System 1 takes over.
💥 Stress hormones spike
💥 Focus narrows
💥 Long-term thinking disappears
💥 You freeze, or act impulsively
You knew what to do.
But you didn’t do it.
Because in that moment, your rational mind wasn’t driving anymore.
⚖️ Set & Forget vs. Floating Managers
Different trading personalities react differently under pressure:
🔹 Set & Forget Traders
Rely on automation or predefined exits to bypass emotional hijack.
They reduce cognitive load, but often feel regret when price goes “a little more.”
🔹 Floating Management Traders
Rely on intuition and live feeling. They stay with the chart, adjusting based on flow.
When calm and trained, they shine.
But under pressure, they’re more vulnerable to emotional loops:
– hesitation
– premature exits
– revenge tweaks
– system betrayal
🧘♂️ What can you do?
✔️ Pre-plan decisions
Make the hard calls before emotions kick in.
✔️ Mental rehearsal
Visualize trade management scenarios—yes, like athletes do.
✔️ Create fallback protocols
So if you freeze, your system still knows what to do.
🧠 For Those Who Want to Go Deeper:
“Thinking, Fast and Slow” by Daniel Kahneman
Understand System 1 & 2 thinking—and how cognitive bias shapes all decisions, not just trades.
“The Hour Between Dog and Wolf” by John Coates
A stunning look at how biology, hormones, and risk-taking collide in traders' brains.
🔓 Final Thought:
If your strategy works in theory, but breaks in real-time—
It’s time to work on your neural execution layer.
Because in trading, you don’t rise to your level of analysis—
you fall to your level of emotional wiring.
— MJTrading
#NeuroTrading #TraderTypes #TradingPsychology #SetAndForget #FloatingManagement #MindOverMarkets #EURUSD #MJTrading
Previous psychology Ideas:

EURO - Price will rise a little and then drop to $1.1500 pointsHi guys, this is my overview for EURUSD, feel free to check it and write your feedback in comments👊
Price earlier carved out a pennant pattern after a strong rally, with price oscillating between converging trendlines and indecision mounting near $1.1550 resistance.
After several weeks in consolidation, sellers finally broke down below the pennant base, sending price back toward the support area and trapping late buyers.
Buyers regrouped and launched a new advance, driving EUR into a well-defined rising channel.
During this channel run, two notable breakouts above interim highs were quickly followed by exits at the upper trendline.
Price now sits in a tight consolidation just under the rising channel’s ceiling near $1.1700, forming small corrective swings on lighter volume.
I expect one more shallow rally toward $1.1750 before sellers overwhelm buyers again, pushing Euro down through $1.1550 and toward the $1.1500 points.
If this post is useful to you, you can support me with like/boost and advice in comments❤️
Disclaimer: As part of ThinkMarkets’ Influencer Program, I am sponsored to share and publish their charts in my analysis.

EURUSD: Detailed Support & Resistance Analysis 🇪🇺🇺🇸
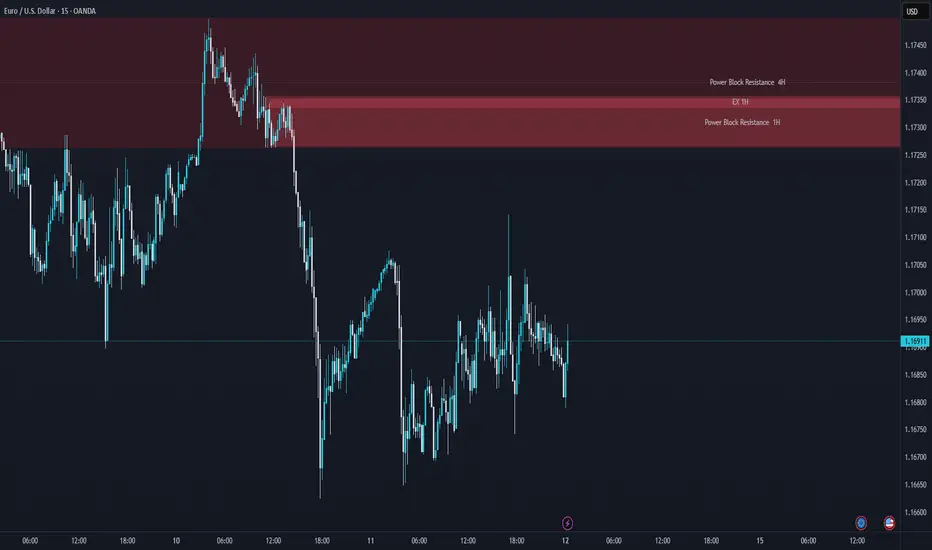
Here is my latest structure analysis and important
supports and resistances for EURUSD for next week.
Consider these structures for pullback/breakout trading.
❤️Please, support my work with like, thank you!❤️
I am part of Trade Nation's Influencer program and receive a monthly fee for using their TradingView charts in my analysis.

EURUSD - Still Orderflow remains bearishLooking at EU. The 1H Orderflow is still maintaining that bearish intent. My area is set now for where i want to take a potential sell to the downside seeing as everything else is pretty much mitigated.
The only issue with this potential sell of is that we never really had a sweep of liquidity before we rolled over and moved to the downside.
We do have a level of inducement before our POI but i think in an ideal world i would love to see us build up a bit more liquidity before the POI just to induce the early sellers before making that move to the downside.
For now. On the lower TF's i will be looking to take short term long positions back up to our POI before looking for the longer terms short. to our 4H POI in which i will be looking to get long once again.
Any questions feel free to give me a message

EURUSD Trading Opportunity! BUY!
My dear subscribers,
This is my opinion on the EURUSD next move:
The instrument tests an important psychological level 1.1689
Bias - Bullish
Technical Indicators: Supper Trend gives a precise Bullish signal, while Pivot Point HL predicts price changes and potential reversals in the market.
Target - 1.1748
My Stop Loss - 1.1659
About Used Indicators:
On the subsequent day, trading above the pivot point is thought to indicate ongoing bullish sentiment, while trading below the pivot point indicates bearish sentiment.
Disclosure: I am part of Trade Nation's Influencer program and receive a monthly fee for using their TradingView charts in my analysis.
———————————
WISH YOU ALL LUCK
EURUSD H4 RISES 🔄 Disrupted EUR/USD Analysis (4H)
📉 Current Structure:
Price is hovering around 1.17298, showing hesitation at the resistance of a potential bearish flag.
While the chart labels this zone as “bullish,” there are signs of market indecision, possibly a fakeout trap.
⚠️ Key Disruptions:
1. Bullish Trap Risk:
The price formed a short-term M-pattern (double top inside the orange circle), indicating bearish exhaustion rather than continuation.
The expected breakout to the upside may fail if bulls don’t sustain volume.
2. Support Area Weakness:
The support zone around 1.17000 has been tested multiple times. If it breaks, it could turn into a strong resistance, flipping the sentiment.
3. Macro Influence:
Upcoming EUR and USD economic events (noted by icons) could cause high volatility and break structure unexpectedly.
A strong USD report could reverse bullish momentum, sending EUR/USD toward 1.16500 or lower.
4. Bearish Continuation Scenario:
If the market breaks down from the current consolidation, expect targets at:

EUR/USD SELLERS WILL DOMINATE THE MARKET|SHORT
Hello, Friends!
Previous week’s green candle means that for us the EUR/USD pair is in the uptrend. And the current movement leg was also up but the resistance line will be hit soon and upper BB band proximity will signal an overbought condition so we will go for a counter-trend short trade with the target being at 1.133.
Disclosure: I am part of Trade Nation's Influencer program and receive a monthly fee for using their TradingView charts in my analysis.
✅LIKE AND COMMENT MY IDEAS✅

Soybeans Loading a Bounce? Demand Zone + COT1. Price Action & Technical Structure
Price has bounced off a strong daily demand zone (1011–969).
Today’s daily candle shows a clear rejection wick from the low, and RSI is signaling a potential reversal.
The market is trading inside a falling channel, currently near the lower boundary — setting up a possible breakout move.
Technical Targets:
• First upside target: 1039–1049
Invalidation: daily close below 990, which would confirm structural breakdown.
2. COT Report – Soybeans Futures (as of July 9, 2025)
• Non-Commercials:
+11,539 spreads | +7,017 shorts | –7,520 longs → Slight bearish pressure, though spreads suggest growing speculative complexity.
• Commercials:
+7,876 longs | –9,084 shorts → Moderate commercial bullish bias.
• Open Interest:
+8,076 contracts → Market activity increasing.
Overall COT positioning is neutral to slightly bullish, with growing signs of accumulation around the 1000 level.
3. Seasonality – MarketBulls
Historically, July is one of the weakest months for Soybeans:
• –44.82 (20Y avg)
• –36.86 (15Y avg)
• –34.74 (10Y avg)
However, early August shows signs of seasonal recovery, and price action is already diverging from typical seasonal behavior.
This makes a deeper breakdown less likely — we could be nearing the end of the seasonal weakness.
Operational Takeaway
Current Bias: Neutral-to-Bullish
Confluence of signals supports the idea of a technical rebound:
✅ Bullish reaction candle in demand
✅ Fibonacci support + lower trendline touch
✅ COT data stabilizing with rising open interest
✅ Seasonal weakness possibly exhausted

EURJPY Hits Supply | Pullback Is ComingPrice has entered the daily supply zone (red area) between 170.80 and 171.80, showing immediate rejection with a long upper wick — a signal of potential short-term bearish reaction.
The RSI is turning lower, indicating loss of momentum, although it hasn’t reached extreme levels yet.
The current map suggests a technical pullback toward the 169.40–168.50 zone (FVG + dynamic support) before any potential bullish continuation toward 174+.
The overall structure remains bullish, but a correction looks likely due to technical exhaustion and retail positioning.
📊 2. COT Report (JPY Futures – as of 2025-07-01)
Non-Commercials (speculators) reduced long positions on the JPY by -7,779 contracts, and also slightly trimmed shorts → clear sign of position reduction.
Net positioning remains strongly negative (JPY weakness), but it's starting to recover slightly.
Commercials added both longs (+2,830) and shorts (+5,977), indicating indecision but growing interest.
Open interest slightly decreased (–516), though it remains elevated.
👉 The market has not yet reversed, but the JPY downtrend may be approaching exhaustion.
🧠 3. Retail Sentiment
86% of retail traders are short EUR/JPY — a strong contrarian bullish signal.
Average retail short entry: 166.27, while current price is 171.55 → retail traders are trapped and under pressure.
A short squeeze is likely underway or already completed, increasing the risk of a technical correction after distribution.
📅 4. Seasonality
July is historically weak for EUR/JPY:
20Y: -0.35
15Y: -0.49
10Y: -0.18
August tends to be even worse from a seasonal perspective.
This supports the idea of a potential pullback in the coming days or weeks.
Trading Conclusion
Current Bias: Short-term Neutral–Bearish, Medium-term Bullish.
✳️ Potential pullback from 172.30 toward 169.40–168.50
🎯 If price holds and builds clean bullish structure, expect continuation toward 174.00–175.00
❌ Invalidation on daily close below 167.80

EUR/USD Reversal Ahead? COT + DXY Strength Signal Price has broken below the ascending channel that started in mid-May.
The current candle is rejecting the weekly supply zone (1.17566–1.18319), leaving a significant upper wick.
Daily RSI is losing strength but has not yet reached extreme levels.
A key daily Fair Value Gap (FVG) lies between 1.1600 and 1.1480, with the first potential downside target at 1.14802, which aligns with support and the FVG zone.
A deeper bearish continuation could push price towards 1.1350, but only if the FVG lows are clearly broken.
📊 COT Data (CME - Euro FX & USD Index)
Euro FX
Net long: +15,334
Commercials increased both longs (+13,550) and shorts (+9,913) → mild divergence.
Non-Commercials (speculators) increased shorts (+4,786) more than longs (+1,188) → speculative bias tilting bearish.
USD Index
Strong net long accumulation across all trader types: +4,597 net.
Non-Commercials added +3,590 longs, with only a minor increase in shorts.
→ USD strength continues, reinforcing potential weakness in EUR/USD.
🧠 Retail Sentiment
67% of retail traders are short EUR/USD → typically a contrarian bullish signal.
However, the price is already showing distribution, not accumulation, so we may see price push lower first to trap remaining retail longs, invalidating the contrarian signal in the short term.
📅 Seasonality
July is historically bullish, especially on the 2Y (+0.0142) and 10Y (+0.0106) averages.
However, the 15Y and 20Y averages show a much more moderate performance (+0.007 / +0.0025).
Based on current price action, the seasonal rally may have already played out with the run-up to 1.1830. A correction now seems likely, even if the broader macro remains supportive mid-term.
🧩 Conclusion
Despite historically bullish seasonality for July, both price action and COT data indicate distribution with early signs of reversal.
Retail sentiment is too skewed short for a major breakdown just yet, but the technicals support a short-term pullback toward more balanced levels.
USD strength from COT and DXY structure reinforces a corrective short bias for now.

EURUSD – Breakout Confirms Bullish ContinuationEURUSD has just successfully broken out of a corrective triangle pattern, confirming that the bullish structure remains intact. The price reacted well to the support zone around 1.1660 and bounced back, opening the way toward the 1.1820 target in the short term.
On the news front, the euro is gaining support as the Eurozone’s July CPI held steady at 2.6%, indicating that inflationary pressures have not fully eased—this may prompt the ECB to maintain a tighter policy for longer. Meanwhile, the USD is under mild correction pressure after U.S. CPI came in higher than expected but not strong enough to reignite rate hike expectations from the Fed.
Given the current technical setup and news backdrop, EURUSD could continue rising in the coming sessions as long as it holds above the trendline support.

EUR_USD STRONG UPTREND|LONG|
✅EUR_USD is trading in an uptrend
With the pair set to retest
The rising support line
From where I think the growth will continue
LONG🚀
✅Like and subscribe to never miss a new idea!✅
Disclosure: I am part of Trade Nation's Influencer program and receive a monthly fee for using their TradingView charts in my analysis.

EURUSD. The plan for the next few days.The nearest resistance zones are where it's interesting to look for purchases. We are waiting for a reaction and looking for an entry point.
The post will be adjusted if there are any changes.
Don't forget to click on the Rocket! =)

EURUSD: Bulls Are Winning! Long!
My dear friends,
Today we will analyse EURUSD together☺️
The price is near a wide key level
and the pair is approaching a significant decision level of 1.16915 Therefore, a strong bullish reaction here could determine the next move up.We will watch for a confirmation candle, and then target the next key level of 1.17015.Recommend Stop-loss is beyond the current level.
❤️Sending you lots of Love and Hugs❤️

HelenP. I Euro will drop more, breaking the support levelHi folks today I'm prepared for you Euro analytics. After analyzing the current structure of the EURUSD chart, I noticed a strong break of the ascending trend line, which had been respected for a long period. The price has now returned to test the broken trend line from below, aligning with the resistance zone between 1.1665 and 1.1700 points. This area used to serve as solid support, but after the breakout, it turned into resistance. The retest from below could become the final confirmation before the pair continues its downward movement. Right now, EUR is trading just inside this resistance zone. There is a small chance the price might move slightly higher to touch the upper boundary of the zone, but overall, the pressure looks bearish. I expect that after a minor bounce, EUR will decline again, breaking below the local support at 1.1665. Once that happens, a larger impulse down could be triggered, targeting even 1.1525 points, which is my main goal for this setup. This bearish scenario is supported by the failed attempts to recover above the trend line and the fact that previous support has already flipped to resistance. If you like my analytics you may support me with your like/comment.❤️
Disclaimer: As part of ThinkMarkets’ Influencer Program, I am sponsored to share and publish their charts in my analysis.

EURUSD: Long Trading Opportunity
EURUSD
- Classic bullish setup
- Our team expects bullish continuation
SUGGESTED TRADE:
Swing Trade
Long EURUSD
Entry Point - 1.1685
Stop Loss - 1.1664
Take Profit - 1.1728
Our Risk - 1%
Start protection of your profits from lower levels
Disclosure: I am part of Trade Nation's Influencer program and receive a monthly fee for using their TradingView charts in my analysis.
❤️ Please, support our work with like & comment! ❤️

EURO - Price will continue to grow inside rising channelHi guys, this is my overview for EURUSD, feel free to check it and write your feedback in comments👊
Recently, price entered to rising channel, where it soon reached the support level, which coincided with the support area.
After this movement, the price broke this level, but soon turned around and corrected the support line of the channel.
Next, EUR went back to $1.1365 level and broke it again, after which it made a retest and continued to move up.
In a short time, EUR rose to the resistance line of the channel, made a correction, and then grew to $1.1700 support level.
Price broke this level too and reached the resistance line of the channel, but not long ago corrected.
At the moment, I expect that the Euro can correct to the support line of the channel and then rise to $1.1900
If this post is useful to you, you can support me with like/boost and advice in comments❤️
Disclaimer: As part of ThinkMarkets’ Influencer Program, I am sponsored to share and publish their charts in my analysis.

EURUSD Will Go Up! Buy!
Here is our detailed technical review for EURUSD.
Time Frame: 6h
Current Trend: Bullish
Sentiment: Oversold (based on 7-period RSI)
Forecast: Bullish
The market is trading around a solid horizontal structure 1.169.
The above observations make me that the market will inevitably achieve 1.177 level.
P.S
The term oversold refers to a condition where an asset has traded lower in price and has the potential for a price bounce.
Overbought refers to market scenarios where the instrument is traded considerably higher than its fair value. Overvaluation is caused by market sentiments when there is positive news.
Disclosure: I am part of Trade Nation's Influencer program and receive a monthly fee for using their TradingView charts in my analysis.
Like and subscribe and comment my ideas if you enjoy them!
