Tariff and oil volatility converge on July 9 Tuesday, July 9 marks a key deadline for two major market-moving events.
Tuesday is the official deadline for U.S.–EU trade negotiations. While a full deal is off the table, the EU hopes to secure a last-minute "agreement in principle" to avoid a threatened 50% U.S. tariff on some European exports.
President Trump’s history of moving deadlines adds uncertainty. Traders might like to watch for sharp intraday moves in EUR/USD and European equities tied to tariff risk.
OPEC’s International Seminar also kicks off on the 9th in Vienna. Energy ministers and CEOs from BP, Shell, and others will speak on oil supply, investment, and long-term strategy.
Crude has been volatile in July, and any signs of supply shifts or policy changes could drive WTI and Brent in either direction.
EURUSD-2

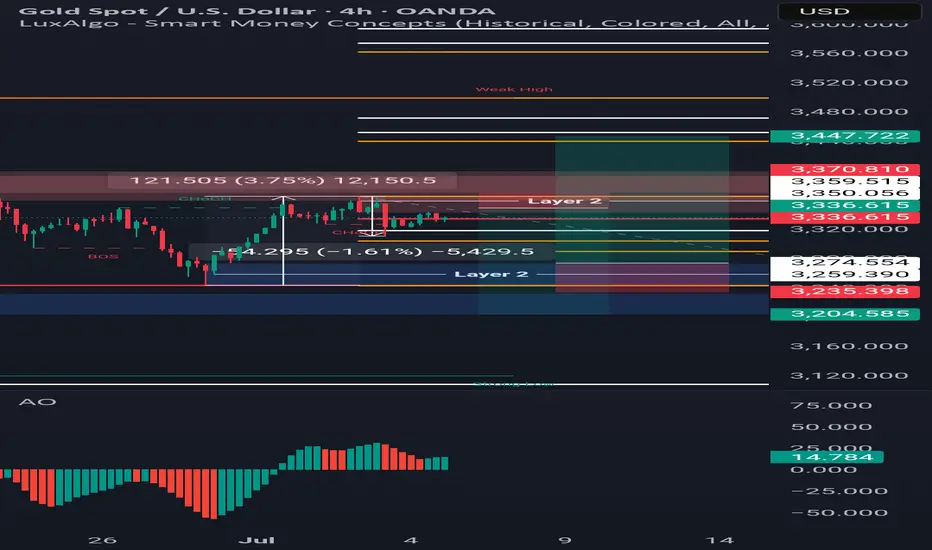
Gold in buyIn Day gold in side ways but we got h&d
In point stry we got low confrm also got high in day
day OB entry is Buylimit
4hrs OB entry is selllimit
If sell limit active hold buy limit
If buy limit active before sell limit delete sell limit
Tp 20,50,100,200,500&open pips
Use risky management
Note: entry will chance on Monday
EUR/USD – Smart Money Trap at 1.18? Massive Rejection Ahead 1. Technical Context
The pair has been moving inside a well-defined bullish channel since May, forming higher highs and higher lows. Price is currently hovering around 1.1718, approaching the upper boundary of the channel and a key weekly supply zone (1.1750–1.1850).
➡️ Potential scenario:
A short bullish extension toward 1.1780–1.1820 to trigger stop hunts, followed by a bearish rejection toward 1.1500, and potentially 1.1380.
The daily RSI is overbought (>70), suggesting a likely short-term correction.
2. Retail Sentiment
80% of retail traders are short, with an average entry around 1.1318.
This signals a liquidity cluster above current highs, increasing the likelihood of a fake bullish breakout followed by a sell-off.
➡️ Contrarian insight: Retail heavily short → market may push higher first to wipe them out before reversing lower.
3. COT Report – USD Index (DXY)
Non-commercials (speculators) increased their short exposure on USD (+3,134).
Commercials cut their short positions (-1,994), indicating a potential bottoming on the dollar.
➡️ Conclusion: USD strength could return soon → bearish pressure for EUR/USD.
4. COT Report – EUR FX
Non-commercials increased longs on EUR (+2,980) and sharply reduced shorts (-6,602) → market is now heavily net long.
Commercials remain net short (581,664 vs 417,363 longs).
➡️ Over-leveraged spec longs → vulnerable to downside squeeze if macro sentiment shifts.
5. Seasonality
June tends to be mildly bullish for EUR/USD.
July historically shows even stronger upward performance over the last 5–10 years.
➡️ Shorts are high risk in the very short term, but a bearish setup is likely in the second half of July, especially if price action confirms.
6. Trading Outlook
📍 Short-Term Bias: Neutral to bullish toward 1.1780–1.1820
📍 Mid-Term Bias: Bearish on rejection from supply area and break of channel
🎯 Key Levels:
1.1780–1.1850: critical decision zone (liquidity + weekly supply)
1.1500: first key support
1.1380: next downside target (demand zone + previous POC)
📌 Final Conclusion
The most likely play is a short setup from 1.1780–1.1850 on strong rejection, supported by:
Extreme retail positioning (80% short),
COT pointing to USD recovery,
Extended technical structure,
Overbought RSI on the daily chart.

EURUSD: overboughtFriday was a non-working day in the US, as the country was celebrating Independence Day. The most important weekly macro data was related to US jobs data. At the start of the week JOLTs job openings in May were posted with a figure of 7.769M, significantly higher from market estimate of 7,3M. The next day the NFPs and Unemployment rate was published. As per data, the unemployment rate dropped by 0,1pp to the level of 4,1%, which missed market expectations of 4,2%. The Non-farm payrolls in June added 147K new jobs, again better from forecasted 110K. The average hourly earnings were higher by 0,2% in June, or 3,7% on a yearly basis, modestly below the forecasted 3,9%. Other weekly macro data including ISM Manufacturing PMI in June reached 49,0 a bit higher from estimated 48,8. The ISM Services PMI in June was standing at 50,8 in line with market estimates.
Retail Sales in Germany dropped by an additional -1,6% in May, bringing the indicator to the level of +1,6% on a yearly basis. Both figures were lower from the market estimate of +0,5% for May and +3,3% for the year. Inflation rate in Germany preliminary in June was 2% a bit lower from forecasted 2,2%. Inflation for the month was standing at 0%. Preliminary inflation data for the Euro Zone in June was 0,3% for the month and 2% for the year. EuroZone core inflation was standing at 2,3% in June, exactly in line with market estimates. The unemployment rate in the Euro Zone in May was modestly increased by 0,1pp to the level of 6,3%, while the market was expecting to remain flat at 6,2%.
The US Dollar continued its decline against the euro during the previous week. The highest weekly level was at 1,1825, but the currency pair closed the week at 1,1776. The RSI reached the level of 73, signalling a clear overbought market side, increasing the probability of a short term reversal in the coming period. The MA50 continues to diverge from MA200, indicating low probability of a potential cross in the future period.
The eurusd daily chart is showing that the currency pair had formed a sort of channel with an uptrend during the past period. If lows from end of February, mid March and end of March are connected, the indication for a next potential level of eurusd might be somewhere above the 1,16 level. The 1,1620 was the highest level achieved in mid July this year, which aligns well with the previous indication. Indicators are currently showing higher probability of a short term reversal. The week ahead is not bringing any currently significant news with respect to the US economy, in which sense, it could be expected that the market will slow down a bit during the week. Short reversal is quite possible, where the level of 1,1620 might be shortly tested. Just in case that the market decides to continue movement toward the higher grounds, then 1,18 resistance will be tested, before the market continues its road toward the 1,19 level.
Important news to watch during the week ahead are:
EUR: Industrial Production in May in Germany, Retail Sales in the Euro Zone for May, Balance of Trade in Germany in May, Inflation rate final for May in Germany,
USD: FOMC Meeting minutes.

EURUSD: Support & Resistance Analysis For Next Week 🇪🇺🇺🇸
Here is my recent structure analysis and important
supports and resistances for EURUSD for next week.
Consider these structures for pullback/breakout trading.
❤️Please, support my work with like, thank you!❤️
I am part of Trade Nation's Influencer program and receive a monthly fee for using their TradingView charts in my analysis.

BTC - Bullflag Pattern points to new ATHMarket Context
Bitcoin has been trading within a well-defined descending channel for several weeks now, respecting both upper and lower boundaries with precision (3 touches on the top, 2 on the bottom). This structure suggests an orderly pullback after a strong impulsive leg to the upside in Q2. As price compresses within this flag-like pattern, market participants are watching closely for signs of breakout or breakdown.
Bullish Fair Value Gap Reaction
Recently, price dipped into a Daily Fair Value Gap (FVG) and bounced strongly — a key bullish signal indicating that demand stepped in at the inefficiency. The FVG also aligns with a retest of the channel’s resistance-turned-support, further validating the bounce. This confluence zone acts as a springboard for potential continuation.
Channel Breakout & Liquidity Above ATH
Price has now broken above the channel structure, shifting the market narrative from consolidation to potential expansion. The breakout zone is located just beneath the All-Time High (ATH) — an area that’s likely loaded with stop orders and breakout buys. A sweep or clean break above the ATH would not only invalidate the prior bearish structure but also trigger a fresh wave of bullish momentum.
Bull Flag Continuation Potential
Structurally, this chart presents a classic bull flag breakout. After a strong impulsive leg up and a controlled consolidation phase, we now see bullish continuation potential toward the 112,000–114,000 region. If the ATH gets breached and reclaimed, it could become strong support in the next leg higher.
Final Thoughts
This is the type of setup that blends both technical precision and market psychology — structure, liquidity, and momentum all coming together. Whether you're already long or watching for confirmation, this move could set the tone for Bitcoin’s next major rally.
If you found this analysis helpful or thought-provoking, please give it a like! And let me know in the comments — do you see this as a true breakout or a trap in disguise?

GBP/CHF Headed to 1.10 – But Bulls Might Regret It📉 1. Price Action & Technical Structure (D1)
Key demand zone tested with bullish reaction:
Price reacted strongly around the 1.0790–1.0840 structural demand area, previously the origin of a significant bullish impulse. The latest daily candle closed above the previous swing low, suggesting a potential technical rebound.
Immediate target:
The 1.0980–1.1010 zone, aligning with:
A clear supply area
RSI bouncing from oversold territory
A visible imbalance left unfilled
Technical bias: Short-term LONG to fill the imbalance before a potential institutional-driven short setup at supply.
2. Retail Sentiment
86% of traders are LONG, with an average entry of 1.0997
Only 14% are SHORT, with lower volume and better pricing
Current price: 1.0833, meaning most long traders are in drawdown
Contrarian view:
The heavy long positioning creates a liquidity pool between 1.0990–1.1010, making that zone highly attractive for institutional distribution and liquidation of retail longs, especially if accompanied by a structural shift.
🎯 Operational impact:
Supports a technical long to 1.10, but high risk of reversal once that level is reached.
3. COT Report
GBP (British Pound – CME)
Non-commercials:
Long: -6,434 → massive unwind of bullish exposure
Short: +2,028 → rising bearish bets
Net positioning is increasingly bearish
Commercials:
Long: +7,459 → increasing coverage against GBP weakness
Short: -569 → slight reduction
Positioning is mixed, but commercials are taking defensive long positions
GBP interpretation:
Bearish pressure rising from institutional speculators, despite some commercial support.
CHF (Swiss Franc – CME)
Non-commercials:
Long: +327
Short: +1,215
Net positioning still heavily short, but shorts increasing again
Commercials:
Long: +1,909
Short: +307
Commercials are accumulating long CHF positions (bullish sign)
CHF interpretation:
Divergence between commercials (bullish CHF) and speculators (still short) → shift may be underway.
4. July Seasonality
GBP:
Historically strong in July, especially the last 2 years (+3.5%)
Positive tendency across 10y/15y/20y averages
CHF:
Also seasonally positive in July, but underperforms GBP across most timeframes (except 2Y where CHF is also strong)
Operational impact:
Favors short-term bullish GBP/CHF bias, supported by seasonal momentum.
✅ Final Outlook
Current short-term bias is bullish, driven by:
Clear technical rebound
Visible imbalance toward 1.10
Seasonal divergence in favor of GBP
However, excessive retail long positioning + COT speculative pressure on GBP suggest this rally could be a distribution phase, offering an optimal short opportunity at 1.10.

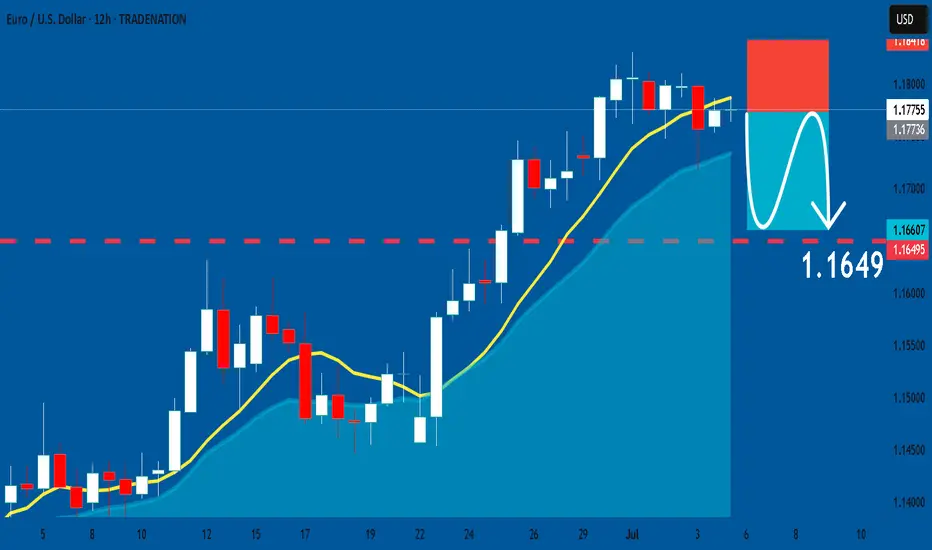
EURUSD: Short Signal Explained
EURUSD
- Classic bearish formation
- Our team expects fall
SUGGESTED TRADE:
Swing Trade
Sell EURUSD
Entry Level - 1.1775
Sl - 1.1841
Tp - 1.1649
Our Risk - 1%
Start protection of your profits from lower levels
Disclosure: I am part of Trade Nation's Influencer program and receive a monthly fee for using their TradingView charts in my analysis.
❤️ Please, support our work with like & comment! ❤️
Bitcoin (BTCUSD) 4-hour timeframe Smart Money Concept (SMC)📌 Key Zones:
Zone Type Price Area Importance
Premium ~111,000-112,000 Sell area / resistance
Buyers Box ~107,000-108,500 Current minor support
FVG Zone ~100,000–106,000 Strong buy zone with imbalance
Discount Below 102,000 High interest zone for large buyers
Resistance Target 111,627.83 Key liquidity target
---
🔔 Conclusion:
As long as buyers defend the current support, price can target the 111.6K resistance.
If rejected, deeper discount entries may be formed in the FVG zone, giving smart money a chance to reaccumulate.
Keep an eye on economic calendar/news (indicated by icons on chart) which might trigger volatility near July 10.

$EUIRYY - Europe CPI (June/2025)ECONOMICS:EUIRYY 2%
June/2025
source: EUROSTAT
- Eurozone consumer price inflation rose slightly to 2.0% year-on-year in June 2025, up from May’s eight-month low of 1.9% and in line with market expectations, according to a preliminary estimate.
The figure aligns with the European Central Bank’s official target.
Among major economies, inflation in Germany unexpectedly declined, while France and Spain saw modest increases and Italy’s rate held steady.

Euro can rebound up from support area to 1.1860 pointsHello traders, I want share with you my opinion about Euro. In this chart, we can see how the price has been moving confidently inside an upward channel after breaking out of a wedge formation. Previously, price consolidated within a narrowing wedge pattern above the buyer zone and broke upward, showing strong bullish momentum. That breakout initiated the current uptrend and led to the formation of a new support area. Now, price is pulling back from the resistance line of the channel and approaching this support area, which also coincides with the support line of the channel. This confluence increases the probability of a bullish reaction in this region. The structure suggests that buyers may step in around this level, preventing a deeper retracement. If the pair bounces off the support zone, I expect a continuation of the uptrend toward the upper boundary of the channel. For that reason, I set my TP at 1.1860 points, almost aligning with the resistance line of the channel. Given the current price action, the bullish structure, and strong reaction levels, I remain bullish and anticipate a rebound followed by further growth toward my target. Please share this idea with your friends and click Boost 🚀
Disclaimer: As part of ThinkMarkets’ Influencer Program, I am sponsored to share and publish their charts in my analysis.

Candlestick Patterns - How to read them like a ProOverview
Candlestick charts serve as a cornerstone in technical analysis, presenting price activity in a visually digestible format. By examining how prices move over a given timeframe, traders gain key insights into potential market direction, sentiment shifts, and trend strength.
Mastering candlestick interpretation is essential for identifying bullish or bearish sentiment, as well as for spotting possible trend reversals or continuations. Still, candlesticks alone don’t paint the full picture—using them without broader context increases the risk of false signals.
---
What You'll Learn
What are candlestick charts?
Common bearish candlestick patterns
Common bullish candlestick patterns
How to apply candlestick analysis in trading
---
What is a Candlestick Chart?
A candlestick provides a snapshot of an asset’s price behavior during a specific time interval, whether it's one minute, one hour, or one day. This format allows traders to quickly assess how the price has moved within that period.
Each candle reveals four price points:
* Open – the price at the beginning of the interval
* Close – the price at the end of the interval
* High – the highest price reached
* Low – the lowest price during that time
Anatomy of a Candlestick:
* Body: The thick section between the open and close. A green (or white) body means the close was higher than the open (bullish), while red (or black) means the opposite (bearish).
* Wicks (or Shadows): Thin lines extending from the body to indicate the high and low.
* Upper wick: Marks the highest traded price
* Lower wick: Marks the lowest traded price
---
Bearish Candlestick Patterns
Understanding bearish candlestick patterns helps traders identify moments when buying momentum might be running out—setting the stage for a potential downward shift.
Evening Star
A three-candle formation that signals a shift from buying pressure to selling dominance. It starts with a strong bullish candle, followed by a small-bodied candle of indecision, and concludes with a large bearish candle that cuts deep into the first. This pattern often appears at the end of an uptrend.
Bearish Engulfing
This setup includes a small bullish candle followed by a large bearish candle that completely swallows the previous one. It indicates that sellers have seized control, potentially marking the beginning of a downward trend.
Shooting Star
With a small real body near the low and a long upper wick, this pattern reflects strong early buying that is ultimately rejected by the close—suggesting fading bullish momentum.
Gravestone Doji
This candle opens, closes, and hits its low all around the same price, leaving a long upper wick. It suggests that bulls pushed higher during the session but were overpowered by bears by the close.
Three Crows
Three consecutive bearish candles, all approximately the same size. These indicate that a sell off is coming soon.
---
Bullish Candlestick Patterns
Bullish patterns can alert traders to possible reversals after a downtrend or strengthen conviction during an uptrend.
Morning Star
This three-candle formation marks a potential turning point from bearish to bullish. It begins with a strong bearish candle, followed by a smaller candle showing indecision, and ends with a large bullish candle breaking upward—signaling buying strength is returning.
Bullish Engulfing
This two-candle pattern begins with a bearish candle, then a larger bullish candle that completely envelops the previous body. It reflects a sharp transition in sentiment, suggesting renewed buying pressure.
Dragonfly Doji
A single candle where the open, close, and high are all very close, with a long lower wick. It shows sellers pushed prices lower but buyers stepped in and brought them back up—an early sign of possible reversal.
Hammer
A classic bullish reversal signal that features a small real body near the top and a long lower shadow. It indicates a battle where sellers initially dominated, but buyers managed to close near the open price.
Three soldiers
Three consecutive bullish candles, all approximately the same size. These indicate that a big buy is coming soon.
---
Trading with Candlestick Patterns
Candlestick patterns become more meaningful when they align with major chart areas—such as previous support or resistance, trendlines, or retracement zones. A bullish signal at a support level can hint that the downward pressure is fading, while a bearish pattern at resistance may warn of an upcoming decline.
To increase the reliability of your trades, combine candlestick patterns with other forms of technical analysis:
* Support & Resistance Zones: These are price levels where the market has historically reacted. Candlestick patterns forming near these zones have stronger potential implications.
* Fibonacci Levels : These help identify likely retracement areas. When a candlestick pattern forms near a key Fibonacci level like 61.8%, it adds strength to a potential reversal setup.
* Liquidity Areas: Clusters of orders (buy or sell) tend to create strong reactions. When patterns appear in these zones, they often precede more decisive moves.
* Technical Indicators : RSI, MACD, Moving Averages, and Stochastic RSI can provide confirmation. For instance, a bullish reversal pattern that appears when RSI is oversold strengthens the signal.
💡 Tip: Don’t rush into trades based on one candlestick alone. Always wait for the next candle or price confirmation (e.g., a break of a previous high/low) to validate your signal.
---
Thanks for Reading!
✨ If you found this helpful, show some love by liking or commenting!
🔔 Don’t forget to follow for more technical breakdowns and trading insights coming soon!

EUR/USD Daily Chart Analysis For Week of July 4, 2025Technical Analysis and Outlook:
During the trading session this week, we witnessed the successful completion of the Outer Currency Rally at a level of 1.177. Recent analyses suggest that the Euro is likely to encounter a downward trend, with an initial target set at the Mean Support level of 1.168 and a potential extension to an additional Mean Support of 1.160. Nevertheless, it is crucial to acknowledge the possibility of a subsequent increase toward the next Outer Currency Rally level of 1.187 before any definitive downward movement transpires.

EURUSD - Where next?Looking at EURUSD
I still feel like we are due some sort of deeper retracement to the downside considering how bullish the 4H and Daily time frame have been in recent times.
Although the market does not care how I feel in all honesty haha. I will play the short term short until the 15min orderflow switches bullish once again.
The expansion that is currently happing right now is very interesting and makes a good watch to see what we will do come market open as we are engineering liquidity for both a buy and sell with both POI's looking primed for entries.
Will be keeping a close and keen eye on EURUSD when the market opens
Any questions feel free to give me a message

GBP/USD : First Long, Then SHORT! (READ THE CAPTION)By analyzing the GBP/USD chart on the 4-hour timeframe, we can see that the price is currently trading around 1.3625. I expect a new Fair Value Gap (FVG), formed by the recent sharp drop, to be filled soon.
The first target for this potential move is 1.3650, with the next bullish zone between 1.3670 and 1.3730.
Supply and demand zones are marked on the chart — keep a close eye on how the price reacts to these key levels!
Please support me with your likes and comments to motivate me to share more analysis with you and share your opinion about the possible trend of this chart with me !
Best Regards , Arman Shaban

EURUSD 30Min Engaged ( Bullish Entry Detected )➕ Objective: Precision Volume Execution
Time Frame: 30-Minute Warfare
Entry Protocol: Only after volume-verified breakout
🩸 Bullish Wave Coming From : 1.17400
➗ Hanzo Protocol: Volume-Tiered Entry Authority
➕ Zone Activated: Dynamic market pressure detected.
The level isn’t just price — it’s a memory of where they moved size.
Volume is rising beneath the surface — not noise, but preparation.
🔥 Tactical Note:
We wait for the energy signature — when volume betrays intention.
The trap gets set. The weak follow. We execute.
EURUSD 30Min Engaged ( Bullish Entry Detected )

EURUSD A Fall Expected! SELL!
My dear subscribers,
My technical analysis for EURUSD is below:
The price is coiling around a solid key level - 1.1784
Bias - Bearish
Technical Indicators: Pivot Points High anticipates a potential price reversal.
Super trend shows a clear sell, giving a perfect indicators' convergence.
Goal - 1.1667
My Stop Loss - 1.1853
About Used Indicators:
By the very nature of the supertrend indicator, it offers firm support and resistance levels for traders to enter and exit trades. Additionally, it also provides signals for setting stop losses
Disclosure: I am part of Trade Nation's Influencer program and receive a monthly fee for using their TradingView charts in my analysis.
———————————
WISH YOU ALL LUCK

SHORT ON EUR/USDEU has given a nice bearish setup with a rising channel.
I will be selling EU to the next demand level looking to catch 200-300 pips.

EURUSD: Strong Bearish Sentiment! Short!
My dear friends,
Today we will analyse EURUSD together☺️
The recent price action suggests a shift in mid-term momentum. A break below the current local range around 1.17775 will confirm the new direction downwards with the target being the next key level of 1.17696.and a reconvened placement of a stop-loss beyond the range.
❤️Sending you lots of Love and Hugs❤️

EURUSD 4H Structure Analysis | MMC Strategy + Channel + CurveIn this EURUSD 4-hour chart analysis using MMC (Market Mind Concept), we are observing a textbook rising channel structure accompanied by a black mind curve (evidence of psychological support behavior). Let's break it down:
📊 Structure Overview:
Straight Ascending Channel:
Price has been respecting a clean, straight rising channel, forming higher highs and higher lows over the past several weeks. This structure provides a controlled bullish bias, but we are approaching an inflection point.
Black Mind Curve Support (Evidence 2):
A curved trendline (Mind Curve) is providing dynamic support. This curve intersects with the lower boundary of the rising channel—creating a confluence zone, which is likely to act as strong short-term support or the base of a reversal.
Major BOS (Break of Structure):
A significant bullish BOS occurred earlier, confirming momentum strength. This previous break is acting as a reference point for bullish continuation scenarios.
📉 Bearish Scenario:
If the price breaks below the channel and mind curve support, this would invalidate the current bullish channel structure.
A clean breakout + retest below the support zone may invite strong selling pressure, targeting previous support zones around 1.1500 – 1.1350.
📈 Bullish Scenario:
If the price holds above the mind curve and continues upward, we may see a breakout above the top of the channel.
A confirmed breakout could send price toward the 1.1900 – 1.2000 resistance zone.
Patience is key—wait for a confirmed breakout from the channel (either side) before engaging.
⏳ Strategy Outlook:
✅ Wait for channel breakout confirmation (up or down)
⚠️ Watch for fakeouts or liquidity grabs near channel boundaries
🔁 Mind Curve Support adds another layer of decision-making structure
🧠 Trade with the trend, but remain adaptable to shift if channel breaks
🔍 Summary:
The EURUSD pair is in a decision-making zone—either we get a bullish continuation breakout, or the structure fails and we flip into a bearish correction. The confluence of the straight channel and mind curve makes this setup high-quality for both trend traders and breakout traders.

BTC - Will the Bearish Channel continue?Market Context
After a strong impulsive rally earlier in the year, BTC has been trading within a descending channel on the daily timeframe. This corrective structure suggests a period of consolidation and redistribution, as price oscillates between the channel's boundaries. The repeated rejection from the upper trendline and the inability to break through key highs reinforce the bearish bias in this structure.
Buy Side Liquidity Sweep Potential
Price is currently positioned just beneath a relatively clean swing high, sitting above the mid-range of the channel. This high represents a clear area of Buy Side Liquidity—stop losses from short positions and pending breakout orders from longs are likely clustered there. An engineered sweep of this high would serve as a strategic move for larger participants to collect liquidity before driving price lower.
Fair Value Gap as a Pivot Point
Beneath current price lies a Fair Value Gap—a visible inefficiency formed during a fast upward move earlier in the structure. This Gap remains unfilled and offers a compelling target for price once the Buy Side Liquidity Sweep occurs. It represents a logical zone for price to rebalance before deciding on continuation or reversal. Should price break below the Gap cleanly, it would confirm the bearish intent and potentially accelerate toward the lower bounds of the channel.
Channel Continuation Structure
The overall geometry of the channel remains intact, and the price respecting both upper and lower boundaries strengthens the likelihood of a continuation toward the downside. If the Buy Side Liquidity Sweep and subsequent rejection occur, the market could be poised for another leg lower—possibly seeking the next structural support closer to 90,000 or even toward the lower extremities of the channel around 80,000–82,000.
Final Thoughts
This chart reflects classic price delivery behavior: corrective structure, engineered liquidity sweeps, and the magnetic pull of inefficiencies like Fair Value Gaps. Whether you’re actively trading or simply observing, this is a clean, educational setup to learn from.
If this breakdown helped you see the market a bit clearer, I’d really appreciate a like. And feel free to share your thoughts or counterviews in the comments—your insights make the analysis even more valuable.

Fundamental Market Analysis for July 4, 2025 EURUSDEvents to pay attention to today:
12:00 EET. EUR - Producer Price Index
EURUSD:
On Friday, during the Asian session, the EUR/USD pair is trading in a narrow range around 1.1760. The main currency pair is showing sluggish dynamics amid the US holiday (Independence Day).
The US dollar (USD) is maintaining its recovery, triggered by better-than-expected non-farm payrolls (NFP) data for June. Data released on Thursday showed that the US economy added 147,000 new jobs, exceeding expectations of 110,000.
The better-than-expected NFP data brought some relief to the US dollar, but this is unlikely to continue as the report shows that private sector hiring is losing momentum. Private employers added 74,000 jobs in June, well below the three-month average of 115,000. This scenario is unlikely to ease the position of several Federal Reserve (Fed) officials, including Vice Chair for Supervision Michelle Bowman, who advocated for lower interest rates at a policy meeting later this month, citing potential risks in the labour market.
In the eurozone, the sharp appreciation of the euro (EUR) has raised concerns that inflation could fall below the European Central Bank's (ECB) 2% target. According to a senior ECB official, ‘the ECB may have to make it clear that too strong a euro could be a problem, as it could cause inflation to hover below target,’ reports the Financial Times (FT).
Trading recommendation: SELL 1.17700, SL 1.18000, TP 1.16900

EURUSD Short Projections for Big Beautiful BillI think we may hit a resistance point soon and drop to around 1.16 or lower. Based on the fundamentals of the Big Beautiful Bill. I think this will be short term and the USD may lose strength.
It will have large economic impact, I think this will happen in short term.
FX:EURUSD
TVC:DXY
