EUR/USD - 4H Analysis - High Probability Trade Setup🔍 Bias: Bullish continuation (Wave 5 setup)
📌 Key Confluences:
Wave (4) is retracing into a key demand zone with strong volume support.
Price is approaching the 71% Fibonacci retracement, a proven institutional entry level.
Ichimoku cloud is holding as dynamic support.
Wave (5) projection targets 1.1550–1.1600 zone (Swing Range).
🎯 Trade Idea:
Buy EUR/USD between 1.1280 – 1.1320
Stop Loss: Below 1.1220 (invalidates wave count)
Take Profit: 1.1550 (1:3+ RR)
⚠️ Risk Note: Confirmation via bullish engulfing candle or volume spike would increase the entry's conviction.
This setup offers strong confluence for a wave 5 rally, making it a high-probability long trade toward the upper swing range.
Follow along for more setups
EURUSD-2

EUR/USD - After taking the highs, are the lows next?The EUR/USD currency pair is moving between two important price levels. The top level is 1.1454 and the bottom level is 1.1357. This means the price is staying inside a range. Yesterday, the price of EUR/USD went above the top level of 1.1454. By doing this, it triggered many stop-loss orders from traders who were expecting the price to go down. These traders had placed their stop-losses just above this level, and the market moved up to take them out.
Current support of the 1H FVG
Now, the price is starting to go down again. It is getting closer to the lower level of the range, which is around 1.1357. There is a chance that the market will go below this level as well. If that happens, it may take out the stop-loss orders of traders who are expecting the price to go up. These traders often place their stop-losses just below the low point of the range. When the market goes below the low, it collects liquidity. In simple words, it grabs the orders that are waiting there.
Looking at the chart, we can see that EUR/USD has found some support at the 1-hour Fair Value Gap (1H FVG). This area is acting like a short-term floor for the price. If a full 1-hour candle closes below this support area, then the price will likely fall further. In that case, it may reach the bottom of the range and possibly move below it to take out more stop-losses.
Why below support?
But why would the market go below the low on purpose? The reason is that many retail traders, those are small traders who trade from home, often put their stop-losses just below the recent low. If the market moves there, it activates those stop-losses. These stop-losses are usually sell orders, and when they get triggered, it gives the market extra selling power. After collecting this liquidity, the market often uses the new buying interest (from other traders entering long positions) to push the price back up again.
Conclusion
So in summary, the EUR/USD is still inside a range. It has already moved above the top to take out stop-losses, and now it might go below the bottom to do the same. After that, there could be a strong move upward, powered by the new liquidity in the market.
Disclosure: I am part of Trade Nation's Influencer program and receive a monthly fee for using their TradingView charts in my analysis.
Thanks for your support.
- Make sure to follow me so you don't miss out on the next analysis!
- Drop a like and leave a comment!

EURUSD - Look for Short (SWING) 1:2.5!Price has formed an ascending channel on the higher time frame, currently consolidating before potentially entering a distribution phase. A breakout could occur in either direction, but if the chart pattern plays out as expected, we may see a break below the key support level. Let’s aim for at least TP1.
Disclaimer:
This is simply my personal technical analysis, and you're free to consider it as a reference or disregard it. No obligation! Emphasizing the importance of proper risk management—it can make a significant difference. Wishing you a successful and happy trading experience!

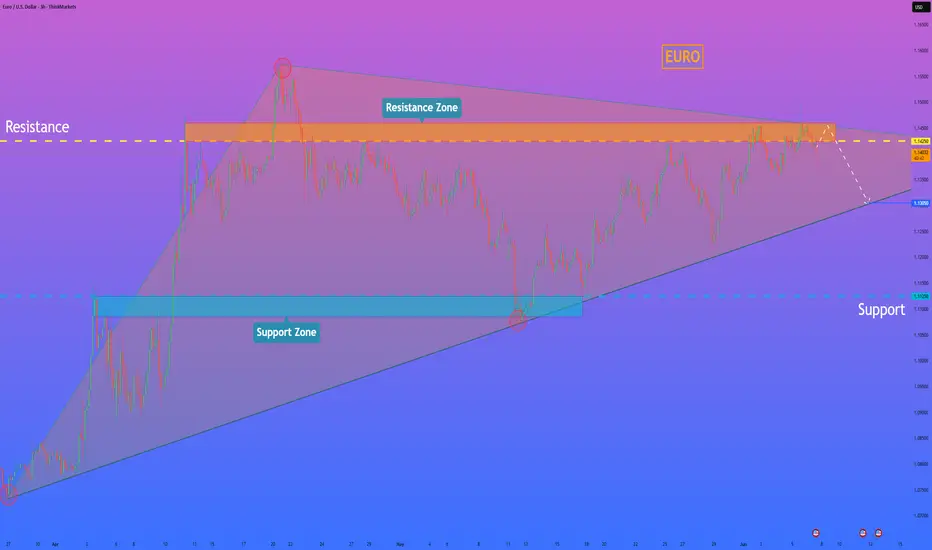
HelenP. I Euro may continue to decline to trend lineHi folks today I'm prepared for you Euro analytics. In this chart, we can see how the price reached the trend line and then started to grow inside a triangle pattern. Price some time traded near the trend line and then made an impulse up to the support level, which coincided with the support zone, and then made a correction, after which it turned around and made an impulse up one more time, breaking the support level. The euro reached the resistance level, which coincided with the resistance zone, and then made a small correction, after which it continued to move up and rose to the resistance line of the triangle. But then the Euro dropped below the resistance level, breaking it, and then continued to decline, after a retest. Price fell to the support zone, where it rebounded from the trend line, which is the support line of the triangle as well, and then started to grow. The euro has grown to a resistance zone, but recently it started to fall and now trades below the 1.1425 resistance level. So, I think that EURUSD will enter to resistance zone one more time and then continue to fall to the trend line. For this case, I set my goal at 1.1305 points, which coincided with this line. If you like my analytics you may support me with your like/comment ❤️
Disclaimer: As part of ThinkMarkets’ Influencer Program, I am sponsored to share and publish their charts in my analysis.
EURUSDVery important area now for EURUSD
Will the unmitigated OB's on the 1H stand strong or, will we continue lower. due to the HTF area of value.
Took a nice short on the 5min TF for a 1:21 RR.
Now lets see how this plays out should be really interesting
Gold Rejected Below $3370 — Eyes on Lower Demand Zones! (READ)By examining the gold chart on the 4-hour timeframe, we can see that after our previous analysis, the price climbed to $3388, giving us nearly 150 pips of return. However, gold was rejected from that level and failed to hold above $3370, eventually dropping below $3360.
Currently, gold is trading around $3348, and we may likely see further decline toward lower levels. The potential downside targets are $3338, $3332, $3326, and $3317.
Key demand zones to watch are:
→ $3327
→ $3311
→ $3298–$3300
→ $3278
Please support me with your likes and comments to motivate me to share more analysis with you and share your opinion about the possible trend of this chart with me !
Best Regards , Arman Shaban

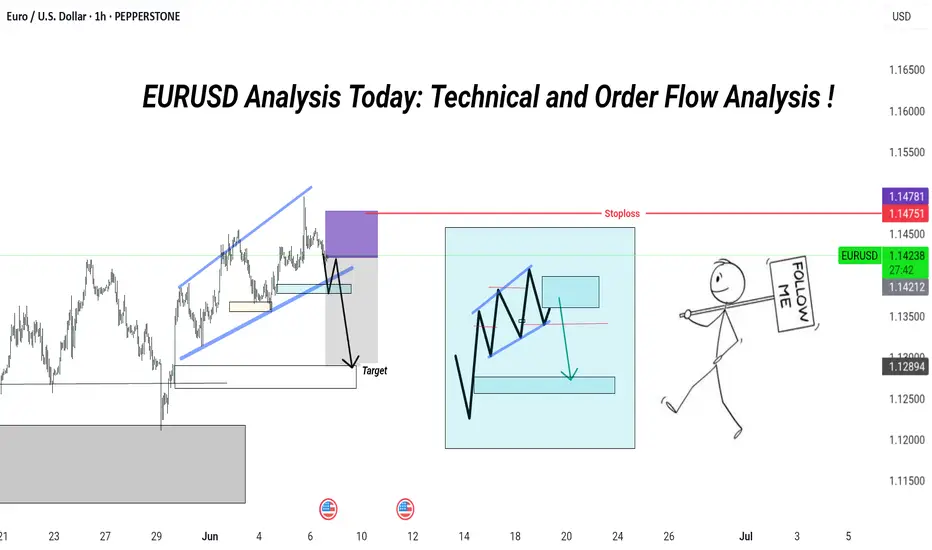
EURUSD Analysis Today: Technical and Order Flow Analysis !Technical Breakdown:
Rising Wedge Pattern ✅
Price was moving inside a rising channel (blue lines).
This is often a bearish reversal pattern.
Break of Structure 💥
Price broke the lower trendline + support zone — confirming potential downside momentum.
Short Entry Zone 🟪
Purple box marks a premium entry zone (Order Block / Supply Zone) — where sellers are likely positioned.
Stop Loss: 1.14781 🔺 (Above last high)
Target: Key demand zone below (highlighted in grey) 🎯
---
📦 Order Flow Perspective:
Internal structure shows lower highs and lower lows forming.
Expecting price to retest lower blue trendline, then drop to fill imbalance and hit demand zone below.
---
🗓️ Upcoming Events:
Watch out for USD-related news near June 10 & June 14 — it may increase volatility 📊
---
🧠 Summary:
This is a classic bearish continuation setup.
Entry after pullback = higher R:R potential.
Patience and proper risk management are key 🔑
---
EURUSD Set To Grow! BUY!
My dear friends,
My technical analysis for EURUSD is below:
The market is trading on 1.1420 pivot level.
Bias - Bullish
Technical Indicators: Both Super Trend & Pivot HL indicate a highly probable Bullish continuation.
Target - 1.1439
About Used Indicators:
A pivot point is a technical analysis indicator, or calculations, used to determine the overall trend of the market over different time frames.
Disclosure: I am part of Trade Nation's Influencer program and receive a monthly fee for using their TradingView charts in my analysis.
———————————
WISH YOU ALL LUCK

EURUSD: Local Bearish Bias! Short!
My dear friends,
Today we will analyse EURUSD together☺️
The market is at an inflection zone and price has now reached an area around 1.14182 where previous reversals or breakouts have occurred.And a price reaction that we are seeing on multiple timeframes here could signal the next move down so we can enter on confirmation, and target the next key level of 1.14050..Stop-loss is recommended beyond the inflection zone.
❤️Sending you lots of Love and Hugs❤️

EURUSD failing to close above a key daily highThis is a quick analysis but we are at a key bearish range that may give a double top on the weekly/daily. If this Daily mother candle abides by Candle Range Theory mechanics, we will see it's low taken out.
We'll see 🎯

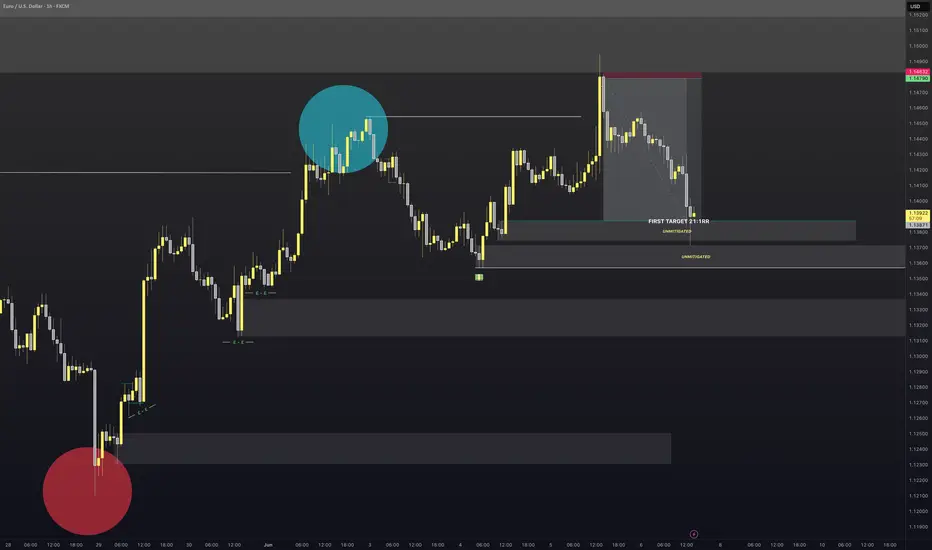
EURUSD - SellEntered this earlier on the 1min TF
Target will be the first Order Block which is 21:RR.
The reason I am targeting here is the 4H order flow is still bullish. So if we can hit the target I close 50% of the position and let the rest ride and manage accordingly to price.
Lets see how it plays out

Bearish drop for the Fiber?The price is reacting off the resistance level which is a pullback resistance and could drop from this level to our take profit.
Entry: 1.1452
Why we like it:
There is a pullback resistance level.
Stop loss: 1.1495
Why we like it:
There is a pullback resistance level.
Take profit: 1.1375
Why we like it:
There is an overlap support level that is slightly below the 38.2% Fibonacci retracement.
Enjoying your TradingView experience? Review us!
Please be advised that the information presented on TradingView is provided to Vantage (‘Vantage Global Limited’, ‘we’) by a third-party provider (‘Everest Fortune Group’). Please be reminded that you are solely responsible for the trading decisions on your account. There is a very high degree of risk involved in trading. Any information and/or content is intended entirely for research, educational and informational purposes only and does not constitute investment or consultation advice or investment strategy. The information is not tailored to the investment needs of any specific person and therefore does not involve a consideration of any of the investment objectives, financial situation or needs of any viewer that may receive it. Kindly also note that past performance is not a reliable indicator of future results. Actual results may differ materially from those anticipated in forward-looking or past performance statements. We assume no liability as to the accuracy or completeness of any of the information and/or content provided herein and the Company cannot be held responsible for any omission, mistake nor for any loss or damage including without limitation to any loss of profit which may arise from reliance on any information supplied by Everest Fortune Group.

EURUSD: Will Go Up! Long!
My dear friends,
Today we will analyse EURUSD together☺️
The recent price action suggests a shift in mid-term momentum. A break above the current local range around 1.14403 will confirm the new direction upwards with the target being the next key level of 1.14764 and a reconvened placement of a stop-loss beyond the range.
❤️Sending you lots of Love and Hugs❤️

Gold Hits All Targets with 500+ Pips – Eyes Now on $3420By examining the gold chart on the 4-hour timeframe, we can see that after our previous analysis, the price moved exactly as expected and successfully hit all four targets — $3367, $3380, $3391, and $3400 — reaching as high as $3403 and delivering over 500 pips of return.
After sweeping the liquidity above $3400, the price corrected back to around $3370. Currently, gold is trading around $3380. If the price can hold above the $3370 level, we can expect a continuation of the bullish move toward the $3420 area.
Please support me with your likes and comments to motivate me to share more analysis with you and share your opinion about the possible trend of this chart with me !
Best Regards , Arman Shaban

EURO - Price can drop to $1.1280, breaking support levelHi guys, this is my overview for EURO, feel free to check it and write your feedback in comments👊
A few days ago price broke $1.1375 level and then entered to triangle pattern, where it at once dropped from resistance line.
Price fell to $1.1375 level, where it some time traded between and then continued to decline to $1.1220 level.
When Euro declined to this level, it at once broke this level and fell to support line of a triangle pattern.
Next, price turned around and in a short time rose higher than $1.1220 level, breaking it and continued to grow next.
Euro rose to resistance line and then corrected, after which it made an upward impulse, thereby exiting from triangle.
Now, price traded inside resistance area, near $1.1375 level, and I think EUR can drop to $1.1280
If this post is useful to you, you can support me with like/boost and advice in comments❤️
Disclaimer: As part of ThinkMarkets’ Influencer Program, I am sponsored to share and publish their charts in my analysis.

EURUSD Long Setup Above 1.14544 – Trendline in FocusFX:EURUSD is showing a potential long setup if price breaks above the 1.14544 level . The trade's potential is influenced by an ascending trendline around 1.14710 . If the market hesitates at this level, it may be wise to close the position or move the stop loss to breakeven .
NASDAQ at Weekly Supply Zone – Bearish Breakdown Ahead? (READ)By examining the #Nasdaq chart on the weekly timeframe, we can see that the price is currently trading within the supply zone around 21,400. If it manages to close and stabilize below 21,100, we can expect further downside for this index. The potential bearish targets are 21,000, 20,700, 20,200, and 19,150. The key supply zone ranges from 21,400 to 22,200.
Please support me with your likes and comments to motivate me to share more analysis with you and share your opinion about the possible trend of this chart with me !
Best Regards , Arman Shaban

Mr. Wave Says... It’s Time for the Last Push!”[ b] EUR/USD is forming a clean Elliott Wave structure — and guess what?
We’re at Wave 4 consolidation, and Wave 5 is about to explode upward!
🔍 Here's what we're seeing:
✅ Wave 1 to 3 already confirmed with solid impulse
✅ Wave 4 found support near previous breakout zone
🎯 Target: Upper supply zone where Wave 5 is likely to terminate
🔔 This isn’t the time to sleep on the charts. Mr. Wave is literally pointing to the target zone — and we’re not ignoring it. 😉
---
🧠 Pro tip:
Use tight risk management, ride the final push of the motive wave, and watch for reversal signals in the supply zone.
---
📌 #GreenFireForex #ElliottWave #Wave5 #ForexTrading #TechnicalAnalysis #EURUSDSetup #ForexReel #WaveTheory #SupplyZone #ForexSignal #SmartTrading

EURUSD: Bearish Continuation & Short Signal
EURUSD
- Classic bearish formation
- Our team expects pullback
SUGGESTED TRADE:
Swing Trade
Short EURUSD
Entry - 1.1423
Sl - 1.1473
Tp - 1.1323
Our Risk - 1%
Start protection of your profits from lower levels
Disclosure: I am part of Trade Nation's Influencer program and receive a monthly fee for using their TradingView charts in my analysis.
❤️ Please, support our work with like & comment! ❤️

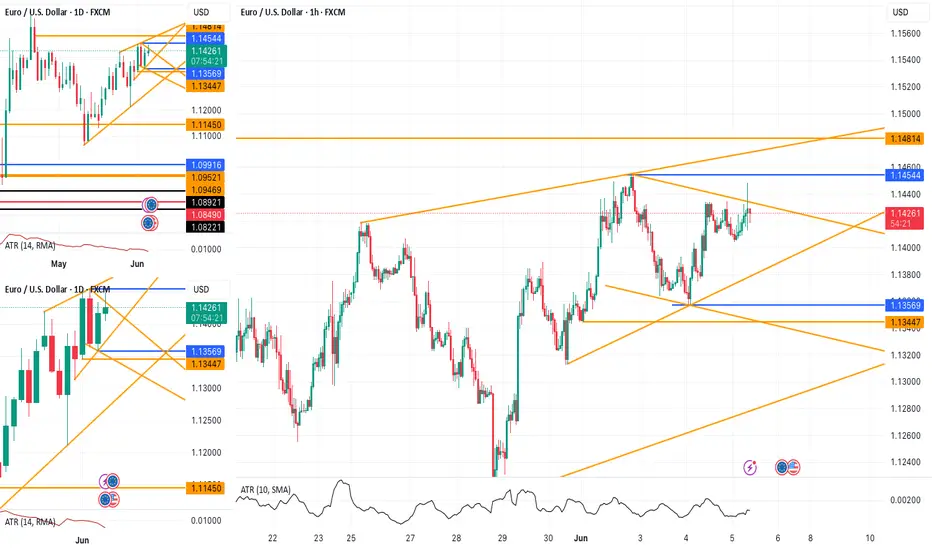
DeGRAM | EURUSD fixed above the resistance line📊 Technical Analysis
● Price has broken the H1 descending-channel roof and twice “fixed” above it at ≈1.137, turning the former ceiling into short-term support.
● The rebound forms an ascending triangle under 1.142; its measured swing targets 1.156 – 1.160, where the violet long-term resistance line and mid-channel parallel converge.
💡 Fundamental Analysis
● Markets expect the ECB to cut only 25 bp on 6 Jun and signal patience, while soft US JOLTS openings and slipping ISM-prices lifted September Fed-cut odds past 60 %, narrowing the 2-yr yield gap and underpinning EUR.
✨ Summary
Buy 1.135-1.137; triangle break >1.142 seeks 1.156 → 1.160. Long view void on an H1 close below 1.126.
-------------------
Share your opinion in the comments and support the idea with like. Thanks for your support!

Fundamental Market Analysis for June 5, 2025 EURUSDThe EUR/USD pair is trading cautiously, slightly above the key level of 1.14000 during Thursday's Asian trading session. The major currency pair is expected to remain in a sideways trend as investors await the European Central Bank's (ECB) interest rate decision.
The ECB is almost certain to cut its key lending rates by 25 basis points (bps), bringing the deposit rate and the main refinancing rate to 2% and 2.15%, respectively. This will be the ECB's seventh consecutive interest rate cut and the eighth since June last year, when it began its cycle of monetary expansion.
Traders are increasingly confident of a seventh consecutive ECB interest rate cut as deflationary trends persist in the eurozone. Preliminary data from the eurozone's harmonized index of consumer prices (HICP) released on Tuesday showed that inflationary pressure fell below the central bank's 2% target.
With the Fed widely expected to cut interest rates, investors will be watching ECB President Christine Lagarde's press conference closely for clues on likely monetary policy in the second half of the year. Market participants would also like to hear about the progress of trade negotiations with the US.
Meanwhile, the US dollar (USD) is struggling to stay near a six-week low as weak US data has reignited stagflation risks. The ISM Services PMI unexpectedly declined in May, while its components showed that production costs continue to rise rapidly. ADP employment change data, which reflects labor demand in the private sector, showed that 37,000 new jobs were created in May, the lowest figure since February 2021.
Trading recommendation: SELL 1.14100, SL 1.14400, TP 1.13600

EURUSD Breakout and Potential RetraceHey Traders, in today's trading session we are monitoring EURUSD for a buying opportunity around 1.13700 zone, EURUSD was trading in a downtrend and successfully managed to break it out. Currently is in a correction phase in which it is approaching the retrace area at 1.13700 support and resistance area.
Trade safe, Joe.

EURUSD: Twin Channel Up structure aims for 1.14950.EURUSD is bullish on its 1D technical outlook (RSI = 59.016, MACD = 0.005, ADX = 22.852) as it maintains a bullish structure consisting of successive Channel Up patterns. We are currently on the 2nd, with the price supported by both the 30m MA50 and MA200. The 1st Channel Up peaked after a +1.29% rise. We remain bullish, aiming for a similar rise, TP = 1.14950.
See how our prior idea has worked out:
## If you like our free content follow our profile to get more daily ideas. ##
## Comments and likes are greatly appreciated. ##
