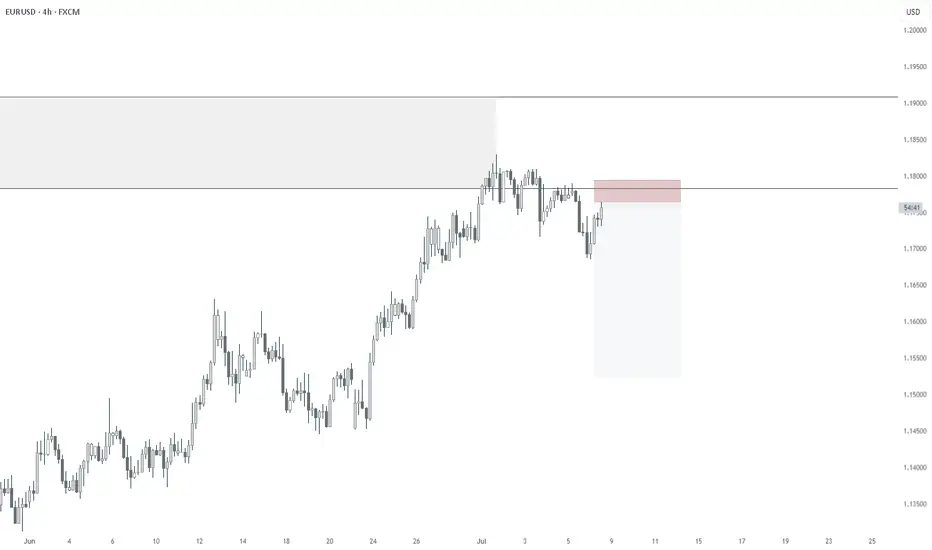
Bullish reversal?The Fiber (EUR/USD) is reacting off the support level which is a pullback support and could rise from this level to our take profit.
Entry: 1.1684
Why we like it:
There is a pullback support.
Stop loss: 1.1652
Why we like it:
There is a pullback support that aligns with the 161.8% Fibonacci extension.
Take profit: 1.1738
Why we like it:
There is an overlap resistance.
Enjoying your TradingView experience? Review us!
Please be advised that the information presented on TradingView is provided to Vantage (‘Vantage Global Limited’, ‘we’) by a third-party provider (‘Everest Fortune Group’). Please be reminded that you are solely responsible for the trading decisions on your account. There is a very high degree of risk involved in trading. Any information and/or content is intended entirely for research, educational and informational purposes only and does not constitute investment or consultation advice or investment strategy. The information is not tailored to the investment needs of any specific person and therefore does not involve a consideration of any of the investment objectives, financial situation or needs of any viewer that may receive it. Kindly also note that past performance is not a reliable indicator of future results. Actual results may differ materially from those anticipated in forward-looking or past performance statements. We assume no liability as to the accuracy or completeness of any of the information and/or content provided herein and the Company cannot be held responsible for any omission, mistake nor for any loss or damage including without limitation to any loss of profit which may arise from reliance on any information supplied by Everest Fortune Group.
Eurusd-3

EUR-USD Bullish Bias! Buy!
Hello,Traders!
EUR-USD is trading in an
Uptrend and the pair is
Making a local bearish correction
But we are bullish biased and
After the retest of the horizontal
Support of 1.1640
We will be expecting a further
Bullish move up
Buy!
Comment and subscribe to help us grow!
Check out other forecasts below too!
Disclosure: I am part of Trade Nation's Influencer program and receive a monthly fee for using their TradingView charts in my analysis.

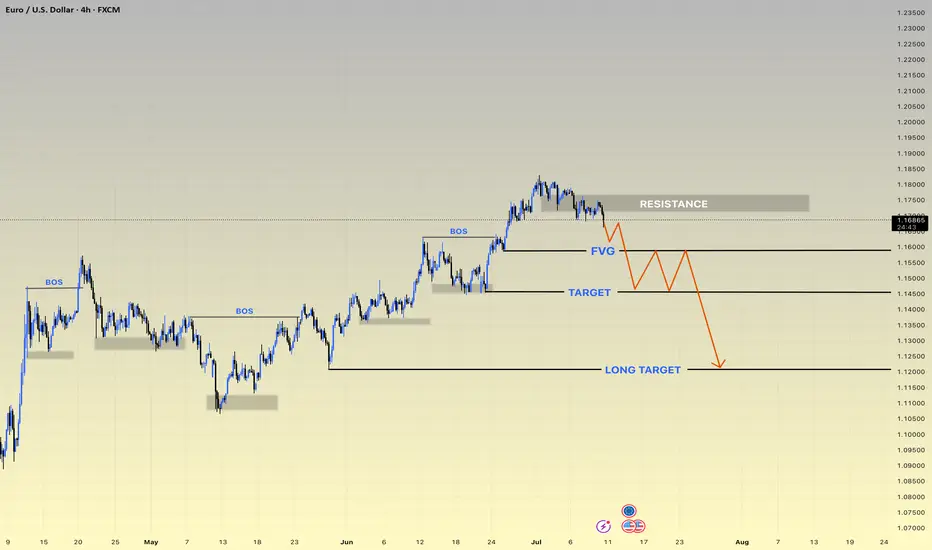
EURUSD h4 update ⚠️ Current Outlook: Reversal Zone Hit
• Price tapped into the strong RESISTANCE zone (~1.1800), failing to break higher.
• Market structure BOS (Break of Structure) confirms bearish intent.
• FVG (Fair Value Gap) likely to act as a short-term liquidity trap.
📍 Disrupted Bearish Flow:
1. Price rejects resistance aggressively ✅
2. Pullback into FVG may trigger a liquidity hunt 🧲
3. Fake bounce → Smart Money re-entry expected 👀
4. Target levels:
• 🥅 TARGET: 1.1550 zone (first major support)
• 🎯 LONG TARGET: 1.1200 zone (high probability zone for HTF buyers)
🔁 Bear Trap Setup Possibility:
• After hitting the LONG TARGET, price could reverse sharply.
• Watch for accumulation signs and deviation below key levels.
⸻
🔥 Key Zones to Watch:
• 🔳 Resistance: 1.1790–1.1820
• 🟦 FVG Retest Zone: 1.1630–1.1660
• 📉 Target Zone: 1.1500–1.1550
• 🚨 Long-Term Demand Zone: 1.1180–1.123
XAU/USD : Gold at a Turning Point – Rejection or Breakout Ahead?By analyzing the TVC:GOLD (XAUUSD) chart on the 4-hour timeframe, we can see that price climbed to $3330 today, entering a key supply zone, which triggered a pullback down to $3310. Gold is now trading around $3317, and I’m watching several potential setups closely.
Scenario 1:
If gold stabilizes below $3320, we could see a bearish move toward $3296.
Scenario 2:
If price breaks above the $3333 resistance, it may enter the next supply zone between $3341 and $3351, which could trigger a strong rejection—potentially offering a 100 to 400 pip move.
Now let’s break down the key levels to watch:
Supply zones: $3320, $3333, $3342, $3358
Demand zones: $3303, $3296, $3289, $3278
Monitor how price reacts to each of these zones — they may provide excellent opportunities.

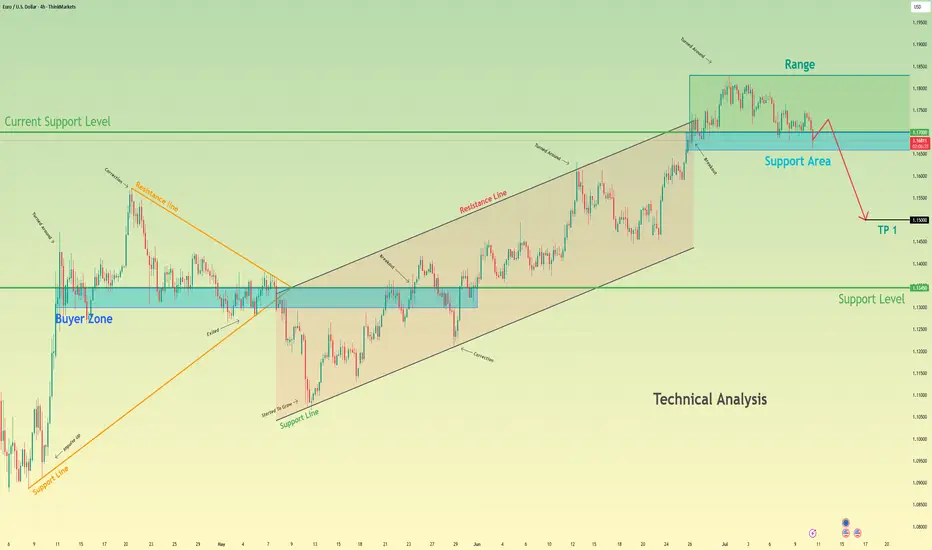
After breaking support level, Euro can continue to fallHello traders, I want share with you my opinion about Euro. After forming an ascending channel, the price steadily moved higher and reached a local range area near 1.1850 points. However, once it entered this zone, the momentum faded. The market started showing signs of distribution, and we saw multiple attempts to push higher being rejected. This range acted as a cap, preventing further growth. Now, the price has pulled back and is trading near the current support level at 1.1700, which also coincides with the support area. This zone has already been tested several times, and each bounce has been weaker than the previous one. That suggests growing pressure from sellers. Looking at the broader structure, the price exited the previous triangle formation with an upward move, but now that impulse has exhausted. The rising wedge is also broken. Based on the behavior at resistance and the weakness around the current support, I expect a breakdown from the range and further decline toward TP 1 at 1.1500 points. If bearish pressure continues, the price could eventually reach the major buyer zone around 1.1345 - 1.1300 points. Given the weakening momentum, retests of support, and lack of bullish continuation, I remain bearish and anticipate a continuation of the downtrend. Please share this idea with your friends and click Boost 🚀
Disclaimer: As part of ThinkMarkets’ Influencer Program, I am sponsored to share and publish their charts in my analysis.
EURUSD Will Keep Growing!
HI,Traders !
#EURUSD is trading in an
Uptrend and the pair broke
The key horizontal level
Of 1.16370 and the breakout
Is confirmed so after a potential
Retest of the support cluster
Of the rising and horizontal
Support lines below we will
Be expecting a bullish continuation !
Comment and subscribe to help us grow !

EURUSD: Absolute Price Collapse Ahead! Short!
My dear friends,
Today we will analyse EURUSD together☺️
The price is near a wide key level
and the pair is approaching a significant decision level of 1.17309 Therefore, a strong bearish reaction here could determine the next move down.We will watch for a confirmation candle, and then target the next key level of 1.17241..Recommend Stop-loss is beyond the current level.
❤️Sending you lots of Love and Hugs❤️

EURUSD Will Go Lower! Short!
Please, check our technical outlook for EURUSD.
Time Frame: 30m
Current Trend: Bearish
Sentiment: Overbought (based on 7-period RSI)
Forecast: Bearish
The market is approaching a key horizontal level 1.172.
Considering the today's price action, probabilities will be high to see a movement to 1.170.
P.S
The term oversold refers to a condition where an asset has traded lower in price and has the potential for a price bounce.
Overbought refers to market scenarios where the instrument is traded considerably higher than its fair value. Overvaluation is caused by market sentiments when there is positive news.
Disclosure: I am part of Trade Nation's Influencer program and receive a monthly fee for using their TradingView charts in my analysis.
Like and subscribe and comment my ideas if you enjoy them!

Euro H4 | Multi-swing-low support at 38.2% Fibonacci retracementThe Euro (EUR/USD) is falling towards a multi-swing-low support and could potentially bounce off this level to climb higher.
Buy entry is at 1.1684 which is a multi-swing-low support that aligns with the 38.2% Fibonacci retracement.
Stop loss is at 1.1570 which is a level that lies underneath an overlap support and the 61.8% Fibonacci retracement.
Take profit is at 1.1807 which is a swing-high resistance.
High Risk Investment Warning
Trading Forex/CFDs on margin carries a high level of risk and may not be suitable for all investors. Leverage can work against you.
Stratos Markets Limited (tradu.com ):
CFDs are complex instruments and come with a high risk of losing money rapidly due to leverage. 63% of retail investor accounts lose money when trading CFDs with this provider. You should consider whether you understand how CFDs work and whether you can afford to take the high risk of losing your money.
Stratos Europe Ltd (tradu.com ):
CFDs are complex instruments and come with a high risk of losing money rapidly due to leverage. 63% of retail investor accounts lose money when trading CFDs with this provider. You should consider whether you understand how CFDs work and whether you can afford to take the high risk of losing your money.
Stratos Global LLC (tradu.com ):
Losses can exceed deposits.
Please be advised that the information presented on TradingView is provided to Tradu (‘Company’, ‘we’) by a third-party provider (‘TFA Global Pte Ltd’). Please be reminded that you are solely responsible for the trading decisions on your account. There is a very high degree of risk involved in trading. Any information and/or content is intended entirely for research, educational and informational purposes only and does not constitute investment or consultation advice or investment strategy. The information is not tailored to the investment needs of any specific person and therefore does not involve a consideration of any of the investment objectives, financial situation or needs of any viewer that may receive it. Kindly also note that past performance is not a reliable indicator of future results. Actual results may differ materially from those anticipated in forward-looking or past performance statements. We assume no liability as to the accuracy or completeness of any of the information and/or content provided herein and the Company cannot be held responsible for any omission, mistake nor for any loss or damage including without limitation to any loss of profit which may arise from reliance on any information supplied by TFA Global Pte Ltd.
The speaker(s) is neither an employee, agent nor representative of Tradu and is therefore acting independently. The opinions given are their own, constitute general market commentary, and do not constitute the opinion or advice of Tradu or any form of personal or investment advice. Tradu neither endorses nor guarantees offerings of third-party speakers, nor is Tradu responsible for the content, veracity or opinions of third-party speakers, presenters or participants.

EURUSD: Expecting Bullish Movement! Here is Why:
Looking at the chart of EURUSD right now we are seeing some interesting price action on the lower timeframes. Thus a local move up seems to be quite likely.
Disclosure: I am part of Trade Nation's Influencer program and receive a monthly fee for using their TradingView charts in my analysis.
❤️ Please, support our work with like & comment! ❤️
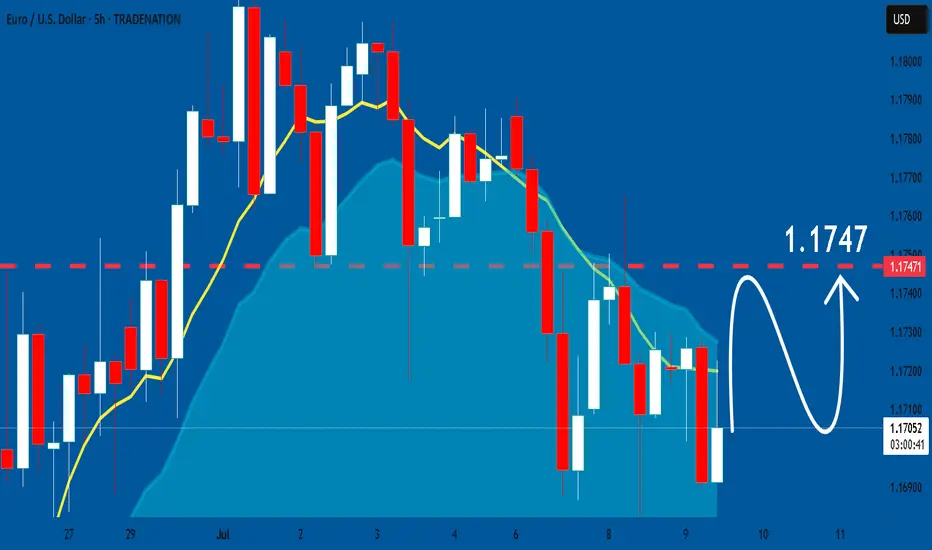
EURUSD: Next Move Is Up! Long!
My dear friends,
Today we will analyse EURUSD together☺️
The recent price action suggests a shift in mid-term momentum. A break above the current local range around 1.17041 will confirm the new direction upwards with the target being the next key level of 1.17163 and a reconvened placement of a stop-loss beyond the range.
❤️Sending you lots of Love and Hugs❤️

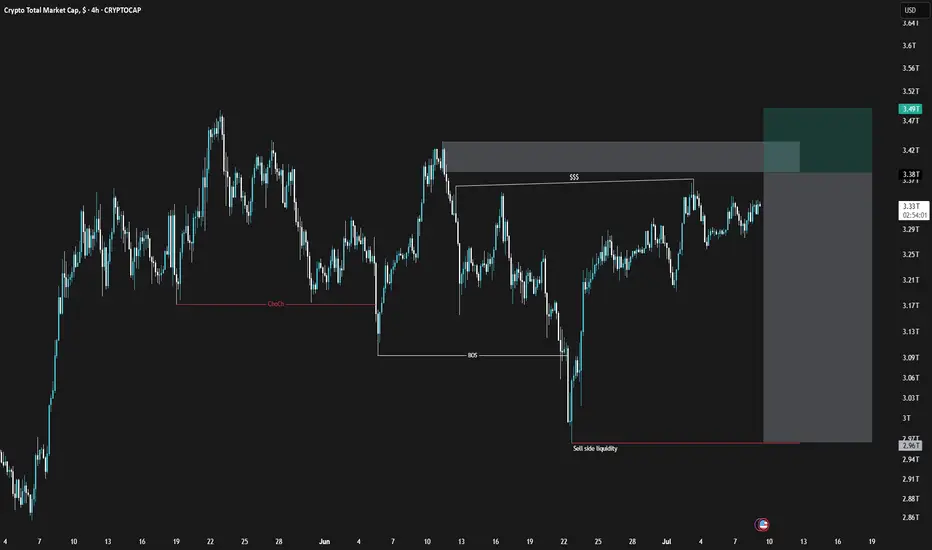
TOTAL SELL SIGNAL 25/Jul/9The TOTAL chart has shown a structural change in the 4-hour timeframe, indicating weakness in the bullish trend. Don't rush into buying and avoid falling into FOMO.
⚠️ This Analysis will be updated ...
👤 Sadegh Ahmadi: GPTradersHub
📅 2025.Jul.9
⚠️(DYOR)
❤️ If you apperciate my work , Please like and comment , It Keeps me motivated to do better
EURUSD Will Go Down!
HI,Traders !
#EURUSD is making a
Bullish rebound after a
Bearish breakout but the
Pair will soon hit a new
Horizontal resistance
Of 1.17489 from where
We will be expecting a
Further move down !
Comment and subscribe to help us grow !

EURUSD Below 1.1745 – Bearish Bias in PlayFX:EURUSD Technical Outlook
EURUSD maintains bearish momentum as long as the price remains below 1.1745, with a near-term target at 1.1684.
A confirmed breakout above 1.1745 would shift the trend to bullish, opening the path toward 1.1808 and 1.1883.
On the downside, a 1H or 4H candle close below 1.1684 would reinforce the bearish trend, likely extending losses toward 1.1627, and possibly 1.1557.
Support: 1.1684 / 1.1627 / 1.1557
Resistance: 1.1808 / 1.1883

GBP/USD : Get Ready for Another Fall!By analyzing the GBP/USD chart on the 4-hour timeframe, we can see that after reaching 1.36800—filling the targeted FVG as expected—the price faced selling pressure once again and has since dropped to around 1.35690.
The first target at 1.35630 is now within reach. After collecting liquidity below this level and a possible short-term bounce, we can expect another bearish continuation on GBPUSD.
Key supply zones to watch are 1.36180–1.36465 and 1.36940.
Key demand zones are located at 1.35630, 1.35100, and 1.34880.
THE MAIN ANALYSIS :

EUR/USD at 1.1750 as EU Pushes Trade DealEUR/USD trades around 1.1745 in Tuesday’s Asian session, supported by strong Eurozone retail sales for May. The Euro benefits as the EU aims to finalize a preliminary trade deal with the US this week, seeking to maintain a 10% tariff beyond the August 1 deadline while negotiations continue. The proposed agreement would keep the 10% base tariff but exempt sensitive sectors like aviation and alcohol, which helps lift market sentiment toward the Euro.
Eurostat data showed retail sales rose 1.8% year-on-year in May, beating expectations of 1.2% but slowing from April’s 2.7%. Monthly sales fell 0.7%, matching forecasts.
Resistance for the pair is at 1.1830, while support is at 1.1730.

EUR/USD Trade Plan – Sell Limit StrategyEUR/USD has shown signs of completing a 5-wave bullish structure on the 4H chart, with price now re-testing a key supply zone. A Sell Limit has been positioned at 1.17962, anticipating a sharp reversal back toward the order block zone.
🔍 Technical Analysis
The chart shows a clear Elliott Wave formation, with wave V forming a weak new high, indicating buyer exhaustion.
Price is approaching the 1.17960–1.18013 supply zone, previously unmitigated.
This zone also holds an Order Block (OB) and liquidity above wave III, making it a prime area for institutional sell triggers.
📌 Entry: 1.17962
🛑 Stop Loss: 1.18113
🎯 Target Zone: 1.17122
📈 Risk–Reward: 3R – 6R - 10r potential (depending on trade management)
🧠 Fundamental Outlook
The upcoming trading week is filled with market-moving events from both the US and Eurozone:
🇺🇸 Key USD Events
Non-Farm Payrolls (Fri): Forecast 147K; strong print = bullish USD.
Unemployment Rate: Expected at 4.1%.
Powell Speech, ISM Services PMI: Will impact rate expectations and USD strength.
🇪🇺 Key EUR Events
CPI Flash Estimates: Any surprise may shift ECB tone.
Lagarde Speaks: Markets listening for any policy hints after soft data.
🧩 The combination of a potentially strong USD and weakened Euro fundamentals adds weight to a bearish EUR/USD outlook.
💡 Why This Setup Works
Perfect Liquidity Trap: The zone is designed to trigger late buyers before reversal.
Clean Risk–Reward: Defined SL with a high-probability downside path.
Macro + Technical Confluence: Both align toward downside potential.
Target OB: Strong institutional demand seen at 1.1712 offers a natural take-profit zone.
⚠️ Execution Guidance
Enter only if price hits the Sell Limit zone cleanly.
Avoid execution during red news releases.
Partial TP suggested near 1.1740 (around 2R–3R) to lock early profit.

EURUSD Short, 08 JulyHTF Bearish Continuation & Intraday Confirmation
HTF bias remains bearish, reacting from W/D OB and completing the daily imbalance left from yesterday. Now looking for continuation lower, supported by a clean 4H OB.
📉 Confluence:
15m Decisional OB in play
5m OB entry zone with a clean 1m BOS
DXY gap + imbalance still open in our favor + Correlation between EU and DXY
Asia session structure aligned
🎯 Entry: Retest of 5m OB after 1m BOS
🛡️ SL: Above recent high, ~10 pips
📌 TP: Asia low – 1:3 RR
⚠️ Risk: OB is mid-Asia (less ideal), and DXY Daily imbalance not filled yet
Still a solid setup with structure + HTF narrative backing it.

EURUSD sideways consolidation support at 1.1640The EURUSD currency pair continues to exhibit a bullish price action bias, supported by a sustained rising trend. Recent intraday movement reflects a sideways consolidation breakout, suggesting potential continuation of the broader uptrend.
Key Technical Level: 1.1640
This level marks the prior consolidation range and now acts as pivotal support. A corrective pullback toward 1.1640 followed by a bullish rejection would reinforce the bullish trend, targeting the next resistance levels at:
1.1830 – Near-term resistance
1.1900 – Minor swing high
1.1940 – Longer-term bullish objective
On the other hand, a decisive daily close below 1.1640 would invalidate the bullish setup, shifting the outlook to bearish in the short term. This could trigger a deeper retracement toward:
1.1590 – Initial support
1.1530 – Key downside target
Conclusion:
As long as 1.1640 holds as support, the technical outlook remains bullish, favoring long positions on dips. A confirmed break below this level would signal a shift in sentiment and open the door to a corrective pullback phase.
This communication is for informational purposes only and should not be viewed as any form of recommendation as to a particular course of action or as investment advice. It is not intended as an offer or solicitation for the purchase or sale of any financial instrument or as an official confirmation of any transaction. Opinions, estimates and assumptions expressed herein are made as of the date of this communication and are subject to change without notice. This communication has been prepared based upon information, including market prices, data and other information, believed to be reliable; however, Trade Nation does not warrant its completeness or accuracy. All market prices and market data contained in or attached to this communication are indicative and subject to change without notice.

07/08/2025 - EURUSD - HEDGE SHORTHedge Short for FX:GBPUSD
COT Retailer still extended
We are on the higher timeframe weekly zone
Substructure is already confirmed bearish
EURUSD. The plan for the next few days.The nearest resistance zones are where it's interesting to look for purchases. We are waiting for a reaction and looking for an entry point.
The post will be adjusted if there are any changes.
Don't forget to click on the Rocket! =)

08.07.25 Morning ForecastPairs on Watch -
FX:EURUSD
FX:USDJPY
A short overview of the instruments I am looking at for today, multi-timeframe analysis down to what I will be looking at for an entry. Enjoy!

EURUSD – Rounded Top Signals Bearish Reversal The EURUSD pair is showing clear signs of weakness after forming a rounded top pattern near the 1.18100 resistance zone. Price has broken out of a short-term sideways range and may retest the FVG area near 1.17500 before continuing its downward move.
If the support at 1.17118 is breached, EURUSD could head toward the 1.16200 level – a key demand zone on the chart. The bearish momentum is being reinforced by recent news:
Yesterday: U.S. employment data exceeded expectations, strengthening the USD.
Today: The euro is under pressure due to EU recession concerns and political instability in France.
Coming up: The FOMC minutes may continue to reflect a hawkish stance, which could further weigh on EURUSD.
