EURUSD: Local Bullish Bias! Long!
My dear friends,
Today we will analyse EURUSD together☺️
The recent price action suggests a shift in mid-term momentum. A break above the current local range around 1.14158 will confirm the new direction upwards with the target being the next key level of 1.14327 and a reconvened placement of a stop-loss beyond the range.
❤️Sending you lots of Love and Hugs❤️
Eurusd-3

EURUSD - LongTried to upload this a while ago but for some reason TV was acting up
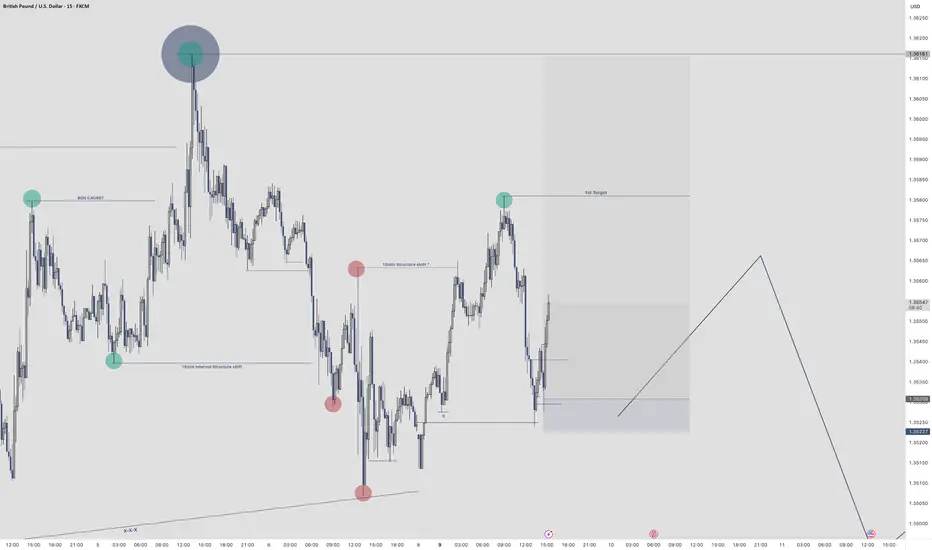
Im currently in a long position.
We had a 15min structure shift to the upside meaning I was looking at the most relevant place to get long.
Took the entry cased on the 1min timeframe
First target is set at 1.35810
Secondary targets I will be shooting for the HTF high

EURUSD: Short Trade Explained
EURUSD
- Classic bearish pattern
- Our team expects retracement
SUGGESTED TRADE:
Swing Trade
Sell EURUSD
Entry - 1.1398
Stop - 1.1449
Take - 1.1303
Our Risk - 1%
Start protection of your profits from lower levels
Disclosure: I am part of Trade Nation's Influencer program and receive a monthly fee for using their TradingView charts in my analysis.
❤️ Please, support our work with like & comment! ❤️

EURUSD Expected Growth! BUY!
My dear followers,
I analysed this chart on EURUSD and concluded the following:
The market is trading on 1.1395 pivot level.
Bias - Bullish
Technical Indicators: Both Super Trend & Pivot HL indicate a highly probable Bullish continuation.
Target - 1.1419
About Used Indicators:
A super-trend indicator is plotted on either above or below the closing price to signal a buy or sell. The indicator changes color, based on whether or not you should be buying. If the super-trend indicator moves below the closing price, the indicator turns green, and it signals an entry point or points to buy.
Disclosure: I am part of Trade Nation's Influencer program and receive a monthly fee for using their TradingView charts in my analysis.
———————————
WISH YOU ALL LUCK

EURUSD Buy the next dip and target 1.17700The EURUSD pair has been trading within a Channel Up pattern and is currently on its 2nd Bullish Leg that hasn't yet been completed.
It does print an identical price action to the 1st Bullish Leg of the pattern, having already made its first pull-back near the 0.382 Fibonacci retracement level and is now rising for the 2nd rejection.
Our plan is to buy the next dip and target 1.17700, which is the -0.136 Fibonacci extension, the level where the 1st Bullish Leg topped.
-------------------------------------------------------------------------------
** Please LIKE 👍, FOLLOW ✅, SHARE 🙌 and COMMENT ✍ if you enjoy this idea! Also share your ideas and charts in the comments section below! This is best way to keep it relevant, support us, keep the content here free and allow the idea to reach as many people as possible. **
-------------------------------------------------------------------------------
Disclosure: I am part of Trade Nation's Influencer program and receive a monthly fee for using their TradingView charts in my analysis.
💸💸💸💸💸💸
👇 👇 👇 👇 👇 👇

EURUSDHello Traders! 👋
What are your thoughts on EURUSD?
EURUSD remains below a key resistance zone, and at this stage, it does not appear to have enough momentum to break through.
We are watching for potential sell setups around this area.
As long as there is no daily candle close above the resistance, we expect a pullback toward the specified support level.
If a daily candle closes above the resistance zone, the bearish scenario will be invalidated, and the structure may shift.
Don’t forget to like and share your thoughts in the comments! ❤️

EUR/USD Best Place To Sell To Get 250 Pips , Don`t Miss It !Here is my EUR/USD Analysis and if you check the chart you will see that we have avery strong res area forced the price to go down hard last time , so i will sell this pair from the same res area , it will force the price to go down hard at least 250 pips , waiting the price to touch it and then we can sell it .

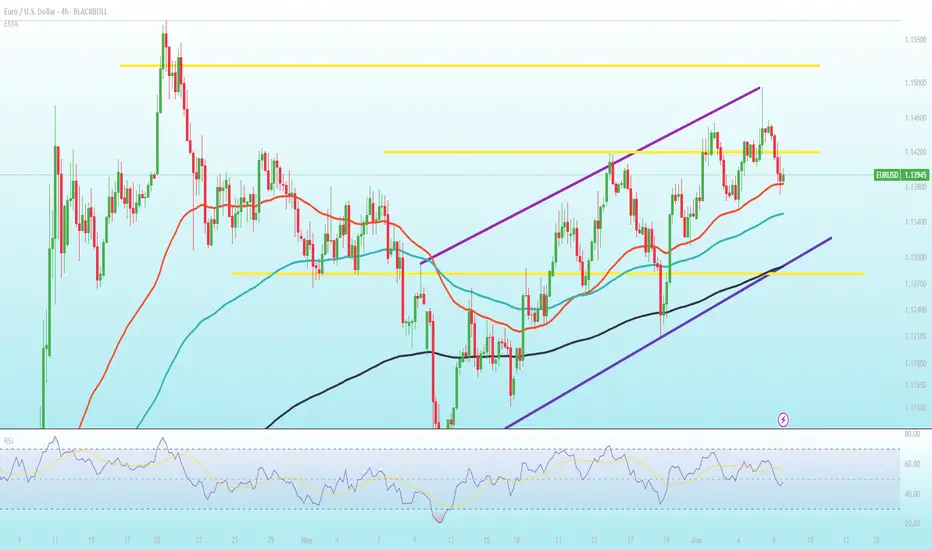
EURUSD – Upper Boundary Holds Firm, Watch for a PullbackEURUSD remains well-contained within its ascending channel, but price has repeatedly been rejected near the upper boundary around the 1.14790 zone. This highlights that profit-taking pressure near the previous high remains significant.
The current bounce from the lower boundary is unconvincing, as the recent highs are not surpassing the previous ones. While EMA34 and EMA89 are still offering support, if price moves toward 1.14790 but fails to break through, a “minor double top” pattern may emerge—raising the risk of a short-term correction.
A notable scenario would be a rejection at 1.14790, followed by a pullback toward the lower channel boundary around 1.13870. A break below this level could temporarily invalidate the short-term uptrend.
At this stage, buyers should remain patient and only look to re-enter near clear support zones. Avoid chasing entries near major resistance areas.

DeGRAM | EURUSD formed a bullish takeover📊 Technical Analysis
● A bullish engulfing on the grey 1.135-1.139 demand band reclaimed the inner trend-median and confirmed the base of the rising 2-month channel.
● The pull-back has just retested the broken wedge top (~1.140) as support; pattern height projects a grind to the channel mid-rail / horizontal cluster at 1.1565.
💡 Fundamental Analysis
● Ahead of the ECB’s expected “one-and-pause” 25 bp cut, EZ core CPI stayed stuck at 2.9 % y/y while soft US job-openings and lower T-bill yields narrowed the 2-yr spread, helping bids return to the euro.
✨ Summary
Long 1.137-1.140; hold above 1.135 seeks 1.156 ➜ 1.160. Invalidate on H4 close < 1.126.
-------------------
Share your opinion in the comments and support the idea with like. Thanks for your support!

Eur, Gbp & DXY Dynamics: We have reached fair valueWith equilibrium being established we are stuck in an internal liquidity range. We do expect the trending targets to be hit although we are seeing a preliminary shift in structure.
If there was anything I missed in this analysis please let me know. Share this with anyone who may be interested 🙏🏾

Bullish momentum to extend?The Fiber (EUR/USD) is falling towards the pivot which is a pullback support and could bounce to the 1st resistance which is also a pullback resistance.
Pivot: 1.1079
1st Support: 1.1075
1st Resistance: 1.1512
Risk Warning:
Trading Forex and CFDs carries a high level of risk to your capital and you should only trade with money you can afford to lose. Trading Forex and CFDs may not be suitable for all investors, so please ensure that you fully understand the risks involved and seek independent advice if necessary.
Disclaimer:
The above opinions given constitute general market commentary, and do not constitute the opinion or advice of IC Markets or any form of personal or investment advice.
Any opinions, news, research, analyses, prices, other information, or links to third-party sites contained on this website are provided on an "as-is" basis, are intended only to be informative, is not an advice nor a recommendation, nor research, or a record of our trading prices, or an offer of, or solicitation for a transaction in any financial instrument and thus should not be treated as such. The information provided does not involve any specific investment objectives, financial situation and needs of any specific person who may receive it. Please be aware, that past performance is not a reliable indicator of future performance and/or results. Past Performance or Forward-looking scenarios based upon the reasonable beliefs of the third-party provider are not a guarantee of future performance. Actual results may differ materially from those anticipated in forward-looking or past performance statements. IC Markets makes no representation or warranty and assumes no liability as to the accuracy or completeness of the information provided, nor any loss arising from any investment based on a recommendation, forecast or any information supplied by any third-party.

EURUSD H1 I Bearish Reversal Based on the H1 chart analysis, we can see that the price is rising toward our sell entry at 1.1433, which is a pullback resistance aligning with a 50% Fibo retracement.
Our take profit will be at 1.1386, an overlap support level.
The stop loss will be placed at 1.1457, a swing-high resistance level.
High Risk Investment Warning
Trading Forex/CFDs on margin carries a high level of risk and may not be suitable for all investors. Leverage can work against you.
Stratos Markets Limited (tradu.com/uk ):
CFDs are complex instruments and come with a high risk of losing money rapidly due to leverage. 63% of retail investor accounts lose money when trading CFDs with this provider. You should consider whether you understand how CFDs work and whether you can afford to take the high risk of losing your money.
Stratos Europe Ltd (tradu.com/eu ):
CFDs are complex instruments and come with a high risk of losing money rapidly due to leverage. 63% of retail investor accounts lose money when trading CFDs with this provider. You should consider whether you understand how CFDs work and whether you can afford to take the high risk of losing your money.
Stratos Global LLC (tradu.com/en ):
Losses can exceed deposits.
Please be advised that the information presented on TradingView is provided to Tradu (‘Company’, ‘we’) by a third-party provider (‘TFA Global Pte Ltd’). Please be reminded that you are solely responsible for the trading decisions on your account. There is a very high degree of risk involved in trading. Any information and/or content is intended entirely for research, educational and informational purposes only and does not constitute investment or consultation advice or investment strategy. The information is not tailored to the investment needs of any specific person and therefore does not involve a consideration of any of the investment objectives, financial situation or needs of any viewer that may receive it. Kindly also note that past performance is not a reliable indicator of future results. Actual results may differ materially from those anticipated in forward-looking or past performance statements. We assume no liability as to the accuracy or completeness of any of the information and/or content provided herein and the Company cannot be held responsible for any omission, mistake nor for any loss or damage including without limitation to any loss of profit which may arise from reliance on any information supplied by TFA Global Pte Ltd.
The speaker(s) is neither an employee, agent nor representative of Tradu and is therefore acting independently. The opinions given are their own, constitute general market commentary, and do not constitute the opinion or advice of Tradu or any form of personal or investment advice. Tradu neither endorses nor guarantees offerings of third-party speakers, nor is Tradu responsible for the content, veracity or opinions of third-party speakers, presenters or participants.

Correction on EURUSDAfter Friday’s news, EURUSD reached 1,1368.
Make a note of the news candle and wait for a breakout.
If the retracement continues, the next key support level is 1,1317.
Important USD-related news is expected this Wednesday.
Watch for potential trend continuation setups and avoid rushing into new trades.

Despite some difficulties, EUR is still in an uptrendThe European Central Bank cut interest rates by 25 basis points as expected and said inflation was close to its medium-term target of 2%. Trump's tariff policies have loosened financial conditions, suggesting further easing is likely.
This dovish stance has put some pressure on the euro. Preliminary eurozone CPI data for May showed that inflationary pressures slowed more than expected, dragging the euro down. Germany’s manufacturing PMI for May was weaker than expected, suggesting further contraction in the manufacturing sector; France’s services PMI was better than expected, but still in contraction territory. Eurozone economic data has been mixed. European Central Bank President Lagarde said the monetary easing cycle was coming to an end, boosting market confidence in the euro over the medium term.
But caution will still be needed about the impact of Trump’s tariff policies on the global economy. While the ECB believes trade tensions have eased, the eurozone is not completely out of the woods. If future economic data remains weak, the euro could face downward pressure.
On the daily chart of OANDA:EURUSD after receiving support from the 0.236% Fibonacci retracement level with horizontal support at 1.12038, the recovery momentum has created a significant increase. Specifically, the increase has tested the levels of 1.14744 and 1.14212, please note that in the previous publication about EUR/USD, these levels are also the nearest resistance at present.
However, in terms of the overall technical picture, EUR/USD is still in a bullish trend with a break above 1.14744 opening the door for a new bullish cycle with a short-term target of 1.15720.
Intraday, the bullish outlook for EUR/USD will be highlighted again by the following price points.
Support: 1.13788 – 1.12422
Resistance: 1.14212 – 1.14744

GBPJPY UPDATE!!Good day traders, I am back again with an update and this time it's on GBP/JPY. On the 1st of June I posted a setup but I mentioned that I will explain it later because I will be able to make my point clearer and easy to understand.
When this setup was posted I had that daily order block in mind, only because I needed to see it revisit the order block for the last time before price could make a run for that internal liquidity resting inside an unfilled FVG(BISI). We can also use that thought as confluence when looking for short term reversals or partial exits. Just by taking a look on the chart I posted again I will put it in the description below, you can see in the sell side of the chart we have a lot of equal lows and ICT teaches us that price looks for relative lows/equal lows and old lows.
On the daily TF price is currently inside a bearish order block and what we do not wanna see is price going over the wick of that wick of a candle that was booked on the 29th of May. We are also inside the premium zone of the wick meaning we can expect to run from there to our objectives below. As always my first objective is always the internal liquidity and that is only because that internal liquidity are my LTF | Highs/Lows.
On the 4H price is inside a balanced price range again that's in my favour meaning I have to note it. ICT teaches that we always wanna trade towards the direction where all our PD arrays are lining up and in this case, it's in the sellside, I believe we are in the starting phase of ICT's sell model.
My name is Teboho Matla but you...you don't know me yet!!

Nato and EU meetings could lift EUR/USD further Despite believing the euro is currently overvalued, Bank of America prefers it to the US dollar, Swiss franc and Japanese yen.
Bank of America thinks the EUR could be supported leading up to the NATO and EU summits (June 24-27) especially if defense spending is confirmed. German infrastructure spending might also be expected to support the euro.
The EUR/USD holds above the 20- and 50-period EMAs at 1.1380–1.1360 and is comfortably above the 200-period EMA. The recent pull-back from 1.14930 has eased momentum slightly.
A close above 1.1420 could target 1.1470, then 1.1520. A sustained break below 1.1280 could neutralise the bullish bias.
Week of 6/8/25: EU AnalysisPrice has reached the extreme of daily bearish structure and we can see a rejection of the 4h latest push to make another high. We're following 1h internal bearish structure to at least take out the weak low, thus making 1h structure bearish and following that to the 4h extreme swing low.
Major news:
Core CPI - Wednesday

NQ tumbles?Good day traders, I don't know why but I get a bit scared when it comes to analyzing NQ. I always doubt myself with it.
On the weekly TF price is trading inside an order block and for the past two weeks price has visited the order block two times. In the two times that price revisited the order block it failed to close above the midpoint indicating the strength of the order block, going into the new week I am going to use the discount zone of the OB+ as my resistance.
On the daily TF before I say much, THERE IS A GAP, and price did not trade to it since opening high on the 12th May. That gap is my target and I want to see price go and fill that volume imbalance as ICT calls it.
Still on the daily TF...when you read price for past two weeks on NQ, you'll quickly come to a realization that price has been expanding higher since Tuesday 3rd June, but expanding to where?...well liquidity resting above the high of the candle booked on the 29th of May.
Now on the 4 hour TF things are opening up and price is becoming clearer and it goes to show the importance of multi time frame analysis. The lows of Tuesday and Thursday make the relative equal lows that are shown on the chart. The internal liquidity shown below is my short term target or TP1. The red triangle represents that 4H inverse FVG and once price is trading below the inverse any movement inside that inverse should show weakness!

EURUSD: Weekly Overview June 9th 2025Hello Traders,
US CPI news is really important and could change the direction of the markets. But I think the Pair would keep its bullish trend for next week too.
*********************************************************************
The indicated levels are determined based on the most reaction points and the assumption of approximately equal distance between the zones.
Some of these points can also be confirmed by the mathematical intervals of Murray.
You can enter with/without confirmation. IF you want to take confirmation you can use LTF analysis, Spike move confirmation, Trend Strength confirmation and ETC.
SL could be placed below the zone or regarding the LTF swings.
TP is the next zone or the nearest moving S&R, which are median and borders of the drawn channels.
*******************************************************************
Role of different zones:
GREEN: Just long trades allowed on them.
RED: Just Short trades allowed on them.
BLUE: both long and short trades allowed on them.
WHITE: No trades allowed on them! just use them as TP points

Bearish drop?EUR/USD is rising towards the resistance level which is a pullback resistance that lines up with the 23.6% Fibonacci retracement and could drop from this level to our take profit.
Entry: 1.1406
Why we like it:
There is a pullback resistance level that lines up with the 23.6% Fibonacci retracement.
Stop loss: 1.1433
Why we like it:
There is a pullback resistance level that lines up with the 50% Fibonacci retracement.
Take profit: 1.1358
Why we like it:
There is a pullback support level that aligns with the 50% Fibonacci retracement.
Enjoying your TradingView experience? Review us!
Please be advised that the information presented on TradingView is provided to Vantage (‘Vantage Global Limited’, ‘we’) by a third-party provider (‘Everest Fortune Group’). Please be reminded that you are solely responsible for the trading decisions on your account. There is a very high degree of risk involved in trading. Any information and/or content is intended entirely for research, educational and informational purposes only and does not constitute investment or consultation advice or investment strategy. The information is not tailored to the investment needs of any specific person and therefore does not involve a consideration of any of the investment objectives, financial situation or needs of any viewer that may receive it. Kindly also note that past performance is not a reliable indicator of future results. Actual results may differ materially from those anticipated in forward-looking or past performance statements. We assume no liability as to the accuracy or completeness of any of the information and/or content provided herein and the Company cannot be held responsible for any omission, mistake nor for any loss or damage including without limitation to any loss of profit which may arise from reliance on any information supplied by Everest Fortune Group.

eurusdContinuing the previous analysis
EUR/USD seems to be very loyal to the daily trendline.
I think there is a possibility of reaching the trendline again and with the upcoming news it could break the ceiling and start an uptrend.

Skeptic | This Week's Most Profitable Setups: Gold, Forex & SPX!hey, traders, it’s Skeptic ! 😎 Our last watchlist was straight fire, racking up some sweet profits with tons of setups. This week’s looking just as juicy, so stick with me to catch these killer opportunities! 🚖 Welcome to my Weekly Watchlist, where I lay out the markets I’m trading with active triggers—forex pairs, commodities, and CFD indices. No FOMO, no hype, just pure reasoning to keep your trades sharp. Let’s jump in! 📊
DXY (Dollar Index)
Let’s kick off with DXY, ‘cause getting this right makes analyzing other indices and pairs a breeze. After multiple failed attempts to break support at 98.8 , it’s still ranging. This is a monthly support, so confirmation of a break needs to come on a monthly or at least weekly chart. Personally, I’m betting it’ll bounce from here. A break above 99.36 gives early confirmation of a rise, but the real deal is breaking resistance at 100 —then you can short USD pairs like EUR/USD . If 98.8 gives way, look for longs, but this monthly zone is tough, so expect some chop! 😬
EURX
EURX seems to be in a weak upward channel. A break above 1063 could push us to 1071 . On the flip side, breaking the channel’s midline at 1058 might drag us to the floor or even support at 1049 . So, our EURX game plan is clear.
Watchlist Breakdown
Let’s hit the watchlist, starting with XAU/USD (Gold ).
Triggers here are tricky, but I cloned last week’s downward channel and placed it above—this trick often gives us solid setups. If we bounce off the channel’s floor, a break above resistance at 3340 opens a long. For shorts, I don’t have a trigger yet since the market’s already dumped. If we form a 1-hour range, a break below its floor could trigger a short targeting 3249 or the previous channel’s midline.
Now, XAG/USD (Silver)
—no triggers this week. Our long trigger from last week’s analysis at 33.68 smashed it, spiking 8%! 🎉 That’s a lock even Bitcoin traders would drool over, but in Skeptic Lab :)
Next, EUR/USD.
The long trigger is set at a break above resistance at 1.14555 , which lines up with the DXY support break I mentioned. Heads-up: this trade won’t be easy. Reduce risk ‘cause we’re in for a big fight at this level—wild swings and tight stop losses get hunted fast. Stay sharp! 😤
GBP/USD Update
My GBP/USD long got stopped out, so let’s break it down. I went long after a resistance break, with crazy uptrend momentum and RSI hitting overbought (which I see as a long confirmation). Everything looked dope except my stop loss placement. The prior move was so sharp that my stop had to be wide, tanking my R/R. It hit the box ceiling target but then dumped, nailing my stop. Lesson? Either jump in before the main momentum or let the move play out and skip it. Mid-move entries with big stops? Recipe for pain...
SPX 500
Our SPX 500 long trigger from breaking the box ceiling already fired and seems to have pulled back. My target’s 6128.55 , and my open position has a stop loss below 5952.51. If you missed last week’s trade, a new trigger could be a 1-hour resistance break at 6014.20 . If you’re already long, no need to double up.
Final Note
my max risk per trade is 1%, and I suggest you stick to that or lower. I’m cooking up a Money management guide soon, diving deep into why it’s the key to outpacing 90% of traders and boosting your odds of consistent profits. Stay tuned! 🚨 No FOMO, and have an awesome week!
💬 Let’s Talk!
If this watchlist lit a spark, hit that boost—it means a ton! 😊 Got a pair or setup you want me to tackle? Drop it in the comments. Thanks for rolling with me—keep trading smart! ✌️
