EURUSD Back to 8H Support ZoneFollowing the bullish breakout of the trendline on the 4-hour timeframe and the subsequent pullback to the mentioned level, along with confirmations on lower timeframes, we expect the price to retrace toward the 8-hour support zone to gather momentum for a potential continuation of the upward trend.
While a precise touch of the support level is not guaranteed, based on the current setup, it remains a likely scenario.
A possible entry zone could be around the highlighted orange area. Based on this setup, I anticipate a potential drop of approximately 4% in EUR/USD, targeting the 1.095 level.
Disclaimer: You are responsible for your own trades. Do not risk more than 2% of your account on a single setup.
Eurusd-3

EURUSD Update – Exceptional Long Entry As mentioned in our previous post, we were waiting for price to react from one of the key demand zones:
🔹 1.12250 – 1.12500
🔹 1.1190 – 1.12060
✅ We entered a long position on the 3-minute timeframe after getting a personal confirmation trigger.
The result? An exceptional entry with a minimum of 100 pips profit so far.
📍 Now it's time to secure profits and wait for the next structure to form.
We’ve been patiently waiting all week for price to hit this area – and it played out perfectly.
Great execution! ✅
Keep in touch!
EURUSD H4 I Bullish Bounce Off Based on the H4 chart analysis, the price is falling toward buy entry level at 1.1367, a pullback support that aligns with the 38.2% Fibonacci retracement.
Our take profit is set at 1.1482, a pullback resistance that aligns closely with the 127.2% Fibonacci extension.
The stop loss is placed at 1.1286, a pullback support.
High Risk Investment Warning
Trading Forex/CFDs on margin carries a high level of risk and may not be suitable for all investors. Leverage can work against you.
Stratos Markets Limited (tradu.com ):
CFDs are complex instruments and come with a high risk of losing money rapidly due to leverage. 63% of retail investor accounts lose money when trading CFDs with this provider. You should consider whether you understand how CFDs work and whether you can afford to take the high risk of losing your money.
Stratos Europe Ltd (tradu.com ):
CFDs are complex instruments and come with a high risk of losing money rapidly due to leverage. 63% of retail investor accounts lose money when trading CFDs with this provider. You should consider whether you understand how CFDs work and whether you can afford to take the high risk of losing your money.
Stratos Global LLC (tradu.com ):
Losses can exceed deposits.
Please be advised that the information presented on TradingView is provided to Tradu (‘Company’, ‘we’) by a third-party provider (‘TFA Global Pte Ltd’). Please be reminded that you are solely responsible for the trading decisions on your account. There is a very high degree of risk involved in trading. Any information and/or content is intended entirely for research, educational and informational purposes only and does not constitute investment or consultation advice or investment strategy. The information is not tailored to the investment needs of any specific person and therefore does not involve a consideration of any of the investment objectives, financial situation or needs of any viewer that may receive it. Kindly also note that past performance is not a reliable indicator of future results. Actual results may differ materially from those anticipated in forward-looking or past performance statements. We assume no liability as to the accuracy or completeness of any of the information and/or content provided herein and the Company cannot be held responsible for any omission, mistake nor for any loss or damage including without limitation to any loss of profit which may arise from reliance on any information supplied by TFA Global Pte Ltd.
The speaker(s) is neither an employee, agent nor representative of Tradu and is therefore acting independently. The opinions given are their own, constitute general market commentary, and do not constitute the opinion or advice of Tradu or any form of personal or investment advice. Tradu neither endorses nor guarantees offerings of third-party speakers, nor is Tradu responsible for the content, veracity or opinions of third-party speakers, presenters or participants.

EUR/USD Forecast: Impulse Wave Progressing TowardThe EUR/USD is currently exhibiting a well-defined impulsive structure following the completion of a corrective (ABC) phase. The market has successfully formed waves (1) and (2), and is now advancing within wave (3), which typically carries the most momentum in an Elliott Wave cycle.
The ongoing rally suggests wave (3) is targeting the 1.15350 level — a key Fibonacci projection area that aligns with previous structural resistance. Momentum remains strong, supported by bullish market structure and sustained buying pressure.
Should wave (3) conclude near this zone, a brief corrective pullback into wave (4) is anticipated, likely retracing toward the 1.14440–1.14730 support range. This would offer a potential entry opportunity before the market resumes its higher trajectory in wave (5), targeting the 1.16077 level.
T1: 1.14857
T2: 1.15090
SL: 1.13867

EURUSD CRACK!I first turned bullish on the EUR back in November 2024 after the disastrous election results.
I have always felt the 105 area was a good area to go long, fundamentally going back all the way to 2017. Here is an example.
After 17 years of data, we can all agree that the 105 area was a great value to get long the EUR. Now we see a major CRACK! in the chart with the fundamentals to back it up.
Again, I remind you I am a MACRO Trader. So my trades hold for a long, long time unless the facts change. I don't do 3 pips and i am out crap!
Let this be a WARNING! To the dollar bulls!
Click Boost, follow, subscribe! Let's get to 5,000 followers so I can help them navigate these crazy markets, too. ))

EURUSD: Strong Bearish Sentiment! Short!
My dear friends,
Today we will analyse EURUSD together☺️
The price is near a wide key level
and the pair is approaching a significant decision level of 1.14292 Therefore, a strong bearish reaction here could determine the next move down.We will watch for a confirmation candle, and then target the next key level of 1.13945..Recommend Stop-loss is beyond the current level.
❤️Sending you lots of Love and Hugs❤️

EURUSD Bullish Signal | Technical + Custom AlgoSmart Trend Signal | Technical Analysis + Custom Algorithm
This signal is the result of a combination of classic technical trend analysis and a proprietary software I personally developed.

EUR/USD Eyes More Upside PotentialDuring the European session, the price showed a trend of first fluctuating and then rising sharply. Currently, the price is at 1.1433, higher than the intraday moving average of 1.1380, indicating that the bulls are in the dominant position. According to ING (International Netherlands Group), the EUR/USD has some intraday resistance at 1.1425, and above this level, it is expected to rise to 1.1500 in the short term. The euro has formed a bottom above 1.1200 and started a new round of upward movement against the US dollar. The EUR/USD has broken through the resistance level of 1.1280, with a bullish trend. The first major resistance level is at 1.1450. If the closing price is above the 1.1450 level, it may lay the foundation for another wave of upward movement. In this case, the currency pair may even break through the resistance level of 1.1500. The next major target for the bulls may be near the resistance level of 1.1580.
Humans need to breathe, and perfect trading is like breathing—maintaining flexibility without needing to trade every market swing. The secret to profitable trading lies in implementing simple rules: repeating simple tasks consistently and enforcing them strictly over the long term.
Trading Strategy:
buy@1.1300-1.1350
TP:1.1450-1.1500

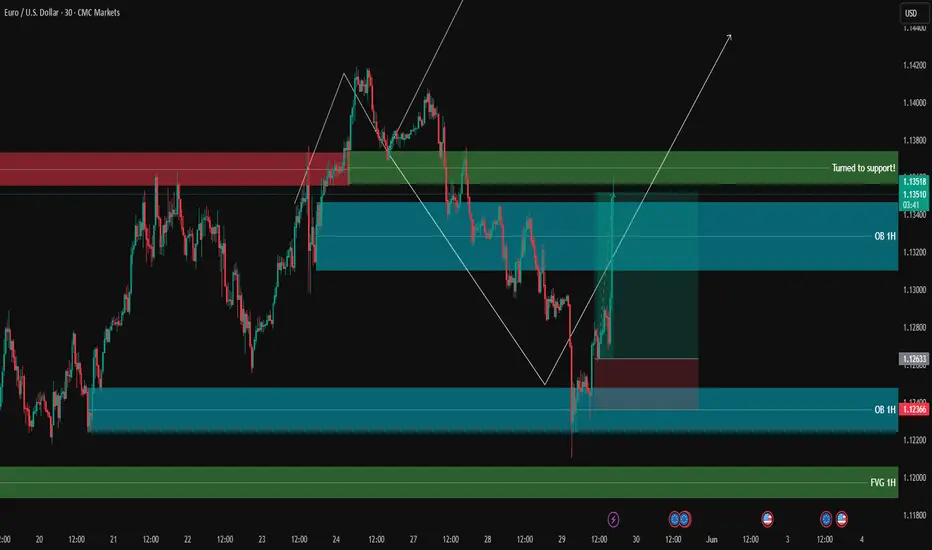
EUR/USD 4H Chart Analysis – May 29, 2025🔍 Market Structure Overview
Current Price: 1.12753
Key Zone: Price is hovering at a critical resistance-turned-support area.
🧱 Key Levels
Resistance Zone: 1.15639 (🔝 Main Target)
Support Zone: 1.10736 (🔻 Main Target)
Intermediate Zones:
Target One (Bullish): 1.14139 📈
Target One (Bearish): 1.11687 📉
🔄 Scenario Outlook
📈 Bullish Scenario:
If price holds above the 1.1275 zone, we could see a climb towards:
1.14139 (minor target)
1.15639 (major resistance & final target)
🚀 Breakout above could indicate continuation of higher highs.
📉 Bearish Scenario:
Failure to hold above 1.1275 could push price lower:
First support at 1.11687
Final drop towards 1.10736 support zone
🪓 Breakdown could confirm lower low structure.
🧠 Conclusion
This is a decision point zone. Wait for confirmation before jumping in. A strong bullish or bearish candle at this level will dictate the next move. Risk management is key here! 🎯

EURUSD Channel Up targeting 1.15000.The EURUSD pair just broke above the Resistance 1 level (1.14250) confirming the extension of the current Bullish Leg of the short-term Channel Up.
With their 4H RSI patterns very similar, the previous Bullish Leg rose by +2.58% before a pull-back to the 4H MA50 (blue trend-line). That gives us a potential Target of 1.15000 on the short-term.
-------------------------------------------------------------------------------
** Please LIKE 👍, FOLLOW ✅, SHARE 🙌 and COMMENT ✍ if you enjoy this idea! Also share your ideas and charts in the comments section below! This is best way to keep it relevant, support us, keep the content here free and allow the idea to reach as many people as possible. **
-------------------------------------------------------------------------------
Disclosure: I am part of Trade Nation's Influencer program and receive a monthly fee for using their TradingView charts in my analysis.
💸💸💸💸💸💸
👇 👇 👇 👇 👇 👇

DXY Update..PWL takenGood day traders I’m back yet again with another update but this this it’s DXY(dollarindex)).
Price has taken previous week’s low, and for me that’s the manipulation phase in the power of 3 because my bias is bullish on the dollar and bearish on foreign currencies. Price has taken the PWL in a zone/area where we saw price react higher in that BPR zone/area. For the rest of the week I personally believe we can expect higher prices on DXY, Atleast till the midpoint of that gap above price. ICT teaches more on the importance of that halfway/midpoint of gaps and other PD arrays.
Since we are in a discount zone we can expect price to move higher into the premium range of the daily TF dealing range and our first liquidity (internal) is also inside the premium zone.

EUR/USD Rises to 4-Week HighEUR/USD Rises to 4-Week High
As shown on the EUR/USD chart today, the euro rose to a 4-week high against the US dollar this morning.
The euro's strength relative to the US dollar is supported by traders’ expectations ahead of the ECB's interest rate decision, scheduled for Thursday at 15:15 GMT+3.
This upcoming event is notable not only because the ECB is expected to cut rates from 2.40% to 2.15% (for the seventh consecutive time), but also due to the broader context shaped by ECB President Christine Lagarde’s recent remarks on the euro’s status as a reserve currency.
At the same time, the US dollar is weakening amid growing trade concerns—on Friday, the US President Donald Trump announced plans to double tariffs on steel and aluminum to 50%. He also accused China of breaching the recent trade truce.
Technical Analysis of the EUR/USD Chart
Seven days ago, when analysing the EUR/USD chart, we:
→ observed bullish sentiment;
→ highlighted the importance of the 1.1400 resistance level;
→ suggested that bears might attempt to strike back.
Since then, the price has pulled back from the mentioned level (as indicated by the arrow), but found support at the lower boundary of the ascending channel. The current bullish momentum could push EUR/USD towards the psychological level of 1.1500 during the week ahead.
This article represents the opinion of the Companies operating under the FXOpen brand only. It is not to be construed as an offer, solicitation, or recommendation with respect to products and services provided by the Companies operating under the FXOpen brand, nor is it to be considered financial advice.

SHORT ON EUR/USDEUR/USD has just swept a previous high and has plenty of liquidity to the downside to capture.
I will be selling EU to the next swing low looking to catch 80-100 pips.

EURUSD – The bearish threat is becoming increasingly clearRecently released PMI data shows that the U.S. manufacturing sector is rebounding. This dampens expectations of monetary easing from the Fed. With a stronger U.S. dollar and rising bond yields, USD-denominated assets like EURUSD are facing downward pressure.
On the daily chart, EURUSD is approaching the resistance zone at 1.16438 – an area that has rejected prices before. The recent rebound appears to be losing strength, and the ascending trendline is at risk of breaking.
If the price fails to hold above this trendline as illustrated, a breakout to the downside could drive the market toward the 1.10757 zone – which aligns with a previous strong support level.
In summary: be cautious of a potential trend break. If a pattern of lower highs continues, sellers may soon take control.

Gold H2 Market Update Ongoing Accumulation BUY LOW SELL HIGH📊 Technical Outlook Update H4
🏆 Bull Market Overview
Gold is currently trading around $3,352.69 per ounce, up 1.9% today, reaching its highest level since May 23, driven by renewed safe-haven demand amid escalating U.S.-China trade tensions and a weaker dollar. The market remains range-bound, with key resistance levels at $3,410 and $3,460, and support levels at $3,160 and $3,240. Volatility is expected to remain moderate, with potential catalysts including upcoming U.S. employment data and central bank policy decisions.
⭐️ Recommended Strategy
Continue to buy on dips near support levels and sell near resistance levels, capitalizing on the current range-bound market conditions. Monitor for potential breakouts above resistance or breakdowns below support, which could signal a shift in market dynamics.
Latest Gold Market Updates:
📈 Gold prices have surged due to renewed tariff threats from the U.S. and escalating geopolitical tensions, prompting investors to seek safety in gold.
💰 Gold miners are largely avoiding hedging strategies to fully benefit from the current market, reflecting strong bullish sentiment in the industry.
🔮 Citibank projects gold prices could rally to $3,500 over the next three months, citing strong demand and macroeconomic factors.
📊 JP Morgan anticipates gold prices exceeding $4,000 per ounce by Q2 2026, with an average of $3,675 in Q4 2025, driven by continued investor and central bank demand.
⭐️ Goldman Sachs has raised its year-end 2025 forecast to $3,700, with a potential upside scenario reaching $4,500, based on strong Asian buying and central bank purchases.
💍 Record gold prices are prompting jewelry designers to shift toward 14-karat gold and alternative materials to control costs, while consumer demand remains robust.
🔮 Outlook Summary
Gold remains in a bullish trend, supported by safe-haven demand amid geopolitical tensions and economic uncertainties. The market is currently range-bound, with key levels to watch at $3,160–$3,240 for support and $3,410–$3,460 for resistance. Upcoming economic data releases and central bank policy decisions could act as catalysts for a breakout from the current range. Analysts maintain a positive outlook, with forecasts suggesting potential for further price increases in the medium to long term.

EURUSD Will Go Down From Resistance! Short!
Here is our detailed technical review for EURUSD.
Time Frame: 6h
Current Trend: Bearish
Sentiment: Overbought (based on 7-period RSI)
Forecast: Bearish
The market is trading around a solid horizontal structure 1.136.
The above observations make me that the market will inevitably achieve 1.126 level.
P.S
The term oversold refers to a condition where an asset has traded lower in price and has the potential for a price bounce.
Overbought refers to market scenarios where the instrument is traded considerably higher than its fair value. Overvaluation is caused by market sentiments when there is positive news.
Disclosure: I am part of Trade Nation's Influencer program and receive a monthly fee for using their TradingView charts in my analysis.
Like and subscribe and comment my ideas if you enjoy them!

DeGRAM | EURUSD retest of the support📊 Technical Analysis
● Price rebounded off the flag base (1.128) and reclaimed the inner grey trend-median, keeping the sequence of higher-lows inside the two-year rising channel.
● The flag’s upper rail at 1.145 has been tested twice; a close above completes the pattern and projects to the channel roof / horizontal confluence at 1.1600, while dynamic support rises with the violet breakout line at 1.1214.
💡 Fundamental Analysis
● Euro stays bid after May EZ headline CPI re-accelerated to 2.6 % y/y, tempering expectations for aggressive ECB cuts, whereas weaker US ADP hiring and cooling core-PCE pressured real yields and the dollar.
✨ Summary
Long bias above 1.128; flag break > 1.145 targets 1.1600, stretch 1.1950. Invalidate on daily close < 1.1080.
-------------------
Share your opinion in the comments and support the idea with like. Thanks for your support!

EURUSD Long Setup Brewing – Here's My Trade Plan!Keeping an eye 👀 on EURUSD – price has just broken market structure 📈 to the upside, and we're seeing clear higher highs 🔼 and higher lows 🔽 forming on the 4H timeframe 🕓.
Price has now rallied into a premium zone 💰, and i'm watching for a retracement 🔁 into my Fibonacci 61.8% 📐✨ point of interest for a potential long entry 🟢.
✅ Entry criteria?
Wait for price to pull back ⬅️ and then give us a break of market structure again 💥.
I'll be looking for confirmations on the 30min or 15min ⏱️ timeframes.
🚫 Not financial advice ✌️

Eurusd is still bullish This EUR/USD daily chart from FXCM suggests a bullish breakout following a well-formed rounded bottom pattern.
Key Observations:
Rounded Bottom Formation: This pattern, marked with multiple lows (highlighted in orange circles), signals a gradual trend reversal from a downtrend to an uptrend.
Breakout Confirmation: Price has broken above the rounded resistance, indicating strong bullish momentum.
Projected Price Movement: The hand-drawn path suggests further upside, with possible retests before continuing higher.
Volume Profile: Increased activity around the 1.0900 level suggests strong support, with potential resistance near 1.1200 - 1.1400.
Conclusion:
This setup indicates a bullish continuation, but confirmation through sustained volume and price action above resistance is crucial.

FROM THE HIGHS ! - EURUSD SHORT FORECAST Q2 W23 D2 Y25EURUSD SHORT FORECAST Q2 W23 D2 Y25
🔥👀QUICK SCOPE TECHNICAL REVERSAL HOT PICK
Professional Risk Managers👋
Welcome back to another FRGNT chart update📈
Diving into some Forex setups using predominantly higher time frame order blocks alongside confirmation breaks of structure.
Let’s see what price action is telling us today!
💡Here are some trade confluences📝
✅1 hour order block
✅15' order block
✅Intraday bearish breaks of structure
✅Tokyo ranges to be filled
🔑 Remember, to participate in trading comes always with a degree of risk, therefore as professional risk managers it remains vital that we stick to our risk management plan as well as our trading strategies.
📈The rest, we leave to the balance of probabilities.
💡Fail to plan. Plan to fail.
🏆It has always been that simple.
❤️Good luck with your trading journey, I shall see you at the very top.
🎯Trade consistent, FRGNT X

EURUSD Forms Rising Wedge + Evening Star_ Bearish SetupAs I expected in the previous idea , the EURUSD ( FX:EURUSD ) started to rise after breaking the upper line of the descending channel and hit the Long Position target with Risk-To-Reward: 1.46 .
The EURUSD is trading near the Resistance zone($1.149-$1.142) .
From a Classic Technical perspective, EURUSD appears to be completing a Rising Wedge Reversal Pattern . Also, a good sign for a EURUSD reversal is the formation of an Evening Star Candlestick Pattern near the upper line of the rising wedge pattern.
Also, we can see the Regular Divergence(RD-) between Consecutive Peaks .
In terms of Elliott Wave theory , I think the EURUSD corrective waves are NOT over yet, and it seems that EURUSD has completed the main wave X inside the rising wedge pattern.
I expect EURUSD to decline to at least $1.126 AFTER breaking the lower line of the wedge pattern.
Note: If EURUSD touches $1.14903 , we can expect more pump.
Please respect each other's ideas and express them politely if you agree or disagree.
Euro/U.S. Dollar Analyze (EURUSD), 4-hour time frame.
Be sure to follow the updated ideas.
Do not forget to put a Stop loss for your positions (For every position you want to open).
Please follow your strategy and updates; this is just my Idea, and I will gladly see your ideas in this post.
Please do not forget the ✅' like '✅ button 🙏😊 & Share it with your friends; thanks, and Trade safe.

Fundamental Market Analysis for June 2, 2025 EURUSDEUR/USD is recovering its recent losses recorded during the previous session, trading around 1.13700 on Monday during Asian hours. The pair is strengthening amid a weakening US dollar (USD) after the US Court of Appeals ruled on Thursday to allow US President Donald Trump's tariffs to take effect.
On Wednesday, a panel of three judges at the International Trade Court in Manhattan said Trump had exceeded his authority by imposing broad import tariffs and ruled the orders issued on April 2 illegal.
On Friday, President Trump said at a rally in Pennsylvania that he plans to double import tariffs on steel and aluminum to increase pressure on global steel producers and escalate the trade war. “We are going to impose a 25 percent increase. We are going to raise tariffs on steel imported into the United States from 25 percent to 50 percent, which will further strengthen the steel industry in the United States,” he said, according to Reuters.
On Saturday, the European Commission (EC) warned that Europe is ready to respond to President Trump's plan to double tariffs on imported steel and aluminum, which would escalate the trade war between the world's two largest economic powers.
Trading recommendation: BUY 1.13600, SL 1.13200, TP 1.14200

EURUSD H1 | Bullish Bounce Off Based on the H1 chart analysis, the price is falling toward our buy entry level at 1.1284, a pullback support that aligns closely with the 61.8% Fibonacci retracement.
Our take profit is set at 1.1367, a pullback resistance.
The stop loss is placed at 1.1229, a multi swing low support.
High Risk Investment Warning
Trading Forex/CFDs on margin carries a high level of risk and may not be suitable for all investors. Leverage can work against you.
Stratos Markets Limited (tradu.com ):
CFDs are complex instruments and come with a high risk of losing money rapidly due to leverage. 63% of retail investor accounts lose money when trading CFDs with this provider. You should consider whether you understand how CFDs work and whether you can afford to take the high risk of losing your money.
Stratos Europe Ltd (tradu.com ):
CFDs are complex instruments and come with a high risk of losing money rapidly due to leverage. 63% of retail investor accounts lose money when trading CFDs with this provider. You should consider whether you understand how CFDs work and whether you can afford to take the high risk of losing your money.
Stratos Global LLC (tradu.com ):
Losses can exceed deposits.
Please be advised that the information presented on TradingView is provided to Tradu (‘Company’, ‘we’) by a third-party provider (‘TFA Global Pte Ltd’). Please be reminded that you are solely responsible for the trading decisions on your account. There is a very high degree of risk involved in trading. Any information and/or content is intended entirely for research, educational and informational purposes only and does not constitute investment or consultation advice or investment strategy. The information is not tailored to the investment needs of any specific person and therefore does not involve a consideration of any of the investment objectives, financial situation or needs of any viewer that may receive it. Kindly also note that past performance is not a reliable indicator of future results. Actual results may differ materially from those anticipated in forward-looking or past performance statements. We assume no liability as to the accuracy or completeness of any of the information and/or content provided herein and the Company cannot be held responsible for any omission, mistake nor for any loss or damage including without limitation to any loss of profit which may arise from reliance on any information supplied by TFA Global Pte Ltd.
The speaker(s) is neither an employee, agent nor representative of Tradu and is therefore acting independently. The opinions given are their own, constitute general market commentary, and do not constitute the opinion or advice of Tradu or any form of personal or investment advice. Tradu neither endorses nor guarantees offerings of third-party speakers, nor is Tradu responsible for the content, veracity or opinions of third-party speakers, presenters or participants.
