EURUSD: The Market Is Looking Up! Long!
My dear friends,
Today we will analyse EURUSD together☺️
The market is at an inflection zone and price has now reached an area around 1.17341 where previous reversals or breakouts have occurred.And a price reaction that we are seeing on multiple timeframes here could signal the next move up so we can enter on confirmation, and target the next key level of 1.17512.Stop-loss is recommended beyond the inflection zone.
❤️Sending you lots of Love and Hugs❤️
Eurusd-4

GBPJPY BULLISH OR BEARIS DETAILED ANALYSISGBPJPY has successfully broken out of a long-term falling wedge on the weekly chart, and the bullish momentum is unfolding as expected. Price has rallied from 190.00 to the current 197.00 level, delivering solid profits from the breakout zone. This continuation setup is extremely strong, with the market respecting the wedge breakout structure and forming higher highs. As long as we hold above the 190.00 support, the bullish bias remains fully intact, with 205.00 as the next key upside target.
Fundamentally, the British pound remains well-supported due to the Bank of England’s hawkish stance. Despite softer inflation data, the BoE has signaled a cautious approach to rate cuts compared to other central banks, maintaining underlying GBP strength. On the other side, the Japanese yen continues to weaken as the Bank of Japan sticks with its ultra-loose monetary policy. Yen weakness is further fueled by rising US and UK bond yields, widening the yield differential and attracting carry trades into GBPJPY.
Technically, the breakout is unfolding with textbook precision. Price has cleared descending resistance, retested it, and is now building a new leg higher. The volume profile is supporting this bullish breakout, and market structure is confirming further upside. The 200.00 psychological level may act as a minor resistance, but once cleared, 205.00 is well within range and aligns with major Fibonacci extensions.
GBPJPY is also benefiting from increased volatility in risk-on sentiment, as equity markets remain firm and bond yields rise globally. Traders are favoring high-yielding currencies like GBP while shorting low-yielders like JPY. With the fundamentals and technicals now strongly aligned, this trade is well-positioned to deliver continued profits toward 205.00 and beyond.

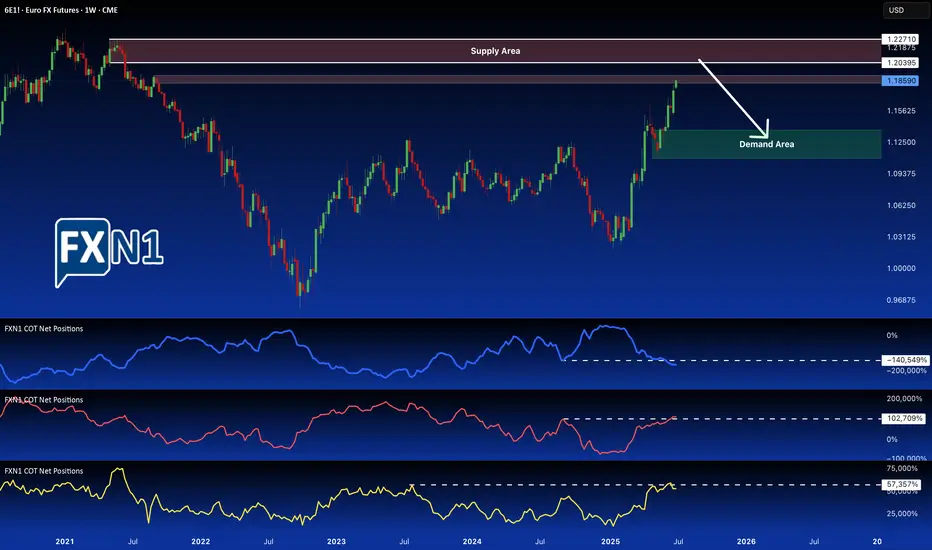
EUR/USD (6E1!) Nears Critical Monthly Supply ZoneThe EUR/USD futures (6E1!) are currently trading at 1.1858, already inside a key monthly supply zone. With price action approaching higher resistance levels, traders should prepare for potential reversals—especially near the 1.20395 – 1.22710 range, where a major bearish reaction could unfold.
Key Technical Levels to Watch
Current Price: 1.1858, testing the lower bounds of a monthly supply zone.
Weekly Supply Areas: Highlighted on the chart, signaling potential selling pressure ahead.
Primary Target Zone for Shorts: 1.21240 – 1.22710 (within the broader 1.20395 – 1.22710 range).
Breakout Scenario: A sustained move above 1.22710 could invalidate the bearish structure, targeting 1.2400+.
COT Report Reveals Market Sentiment Shifts
The latest Commitment of Traders (COT) report shows:
Commercials (Smart Money): Accumulating bearish positions, suggesting institutional hedging at these levels.
Non-Commercials (Large Speculators): Still bullish but stagnant—no major additions or reductions in exposure.
Retail Traders: Remain bullish, often a contrarian signal when Commercials are increasing shorts.
This setup suggests that while momentum is still upward, the lack of new buying from Non-Commercials and Commercials increasing shorts could lead to a reversal.
Bearish reversal off Fibonacci confluence?The Fiber (EUR/USD) is rising towards the pivot and could reverse to the 1st support.
Pivot: 1.1905
1st Support: 1.1577
1st Resistance: 1.2152
Risk Warning:
Trading Forex and CFDs carries a high level of risk to your capital and you should only trade with money you can afford to lose. Trading Forex and CFDs may not be suitable for all investors, so please ensure that you fully understand the risks involved and seek independent advice if necessary.
Disclaimer:
The above opinions given constitute general market commentary, and do not constitute the opinion or advice of IC Markets or any form of personal or investment advice.
Any opinions, news, research, analyses, prices, other information, or links to third-party sites contained on this website are provided on an "as-is" basis, are intended only to be informative, is not an advice nor a recommendation, nor research, or a record of our trading prices, or an offer of, or solicitation for a transaction in any financial instrument and thus should not be treated as such. The information provided does not involve any specific investment objectives, financial situation and needs of any specific person who may receive it. Please be aware, that past performance is not a reliable indicator of future performance and/or results. Past Performance or Forward-looking scenarios based upon the reasonable beliefs of the third-party provider are not a guarantee of future performance. Actual results may differ materially from those anticipated in forward-looking or past performance statements. IC Markets makes no representation or warranty and assumes no liability as to the accuracy or completeness of the information provided, nor any loss arising from any investment based on a recommendation, forecast or any information supplied by any third-party.

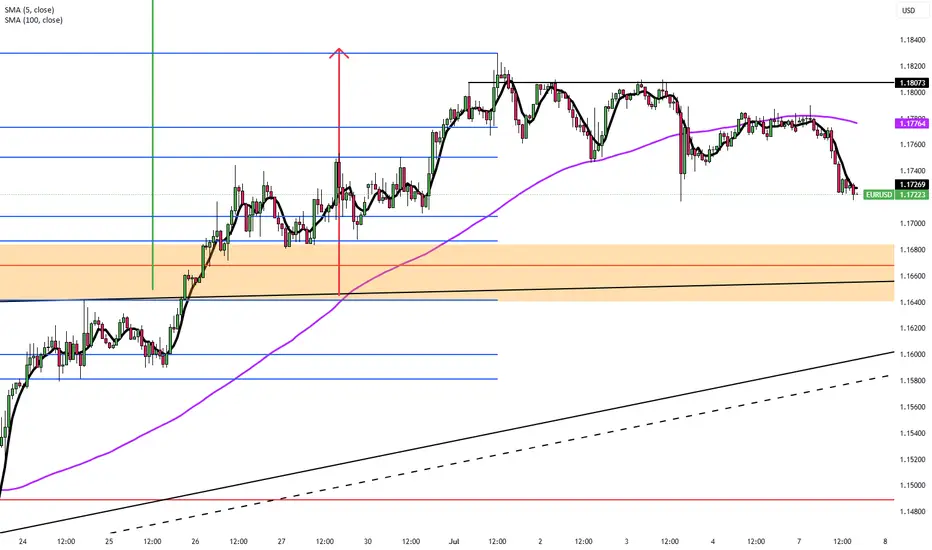
EURUSD: Growth & Bullish Forecast
Balance of buyers and sellers on the EURUSD pair, that is best felt when all the timeframes are analyzed properly is shifting in favor of the buyers, therefore is it only natural that we go long on the pair.
Disclosure: I am part of Trade Nation's Influencer program and receive a monthly fee for using their TradingView charts in my analysis.
❤️ Please, support our work with like & comment! ❤️
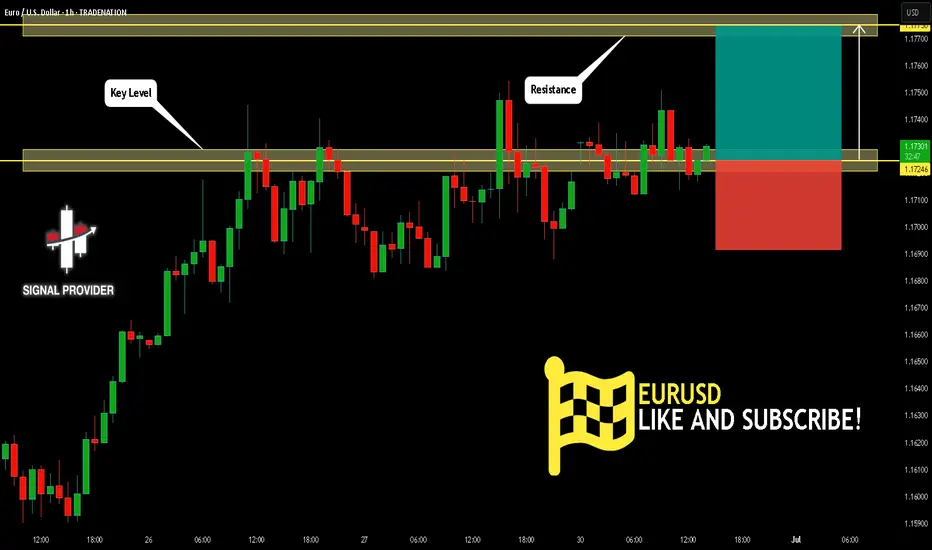
EURUSD Below 1.1745 – Bearish Bias in PlayFX:EURUSD Technical Outlook
EURUSD maintains bearish momentum as long as the price remains below 1.1745, with a near-term target at 1.1684.
A confirmed breakout above 1.1745 would shift the trend to bullish, opening the path toward 1.1808 and 1.1883.
On the downside, a 1H or 4H candle close below 1.1684 would reinforce the bearish trend, likely extending losses toward 1.1627, and possibly 1.1557.
Support: 1.1684 / 1.1627 / 1.1557
Resistance: 1.1808 / 1.1883

DeGRAM | EURUSD fixed under the resistance level📊 Technical Analysis
● Price is stalling against the upper band of a three-month rising channel (≈ 1.1790) after producing a false break and quick rejection—marking a potential bull-trap at trend resistance.
● Bearish divergence on the 4 h RSI and the first lower-high inside a micro rising wedge suggest momentum is fading; a slide through 1.1745 should trigger profit-taking toward the mid-channel support at 1.1595.
💡 Fundamental Analysis
● Solid US payrolls and a hawkish tone in FOMC minutes lift two-year yields, reviving the dollar bid, while post-election coalition wrangling in France keeps a risk premium on the euro.
✨ Summary
Sell 1.1785 ± 15 pips; break below 1.1745 targets 1.1595. Invalidate on a 4 h close above 1.1810.
-------------------
Share your opinion in the comments and support the idea with a like. Thanks for your support!

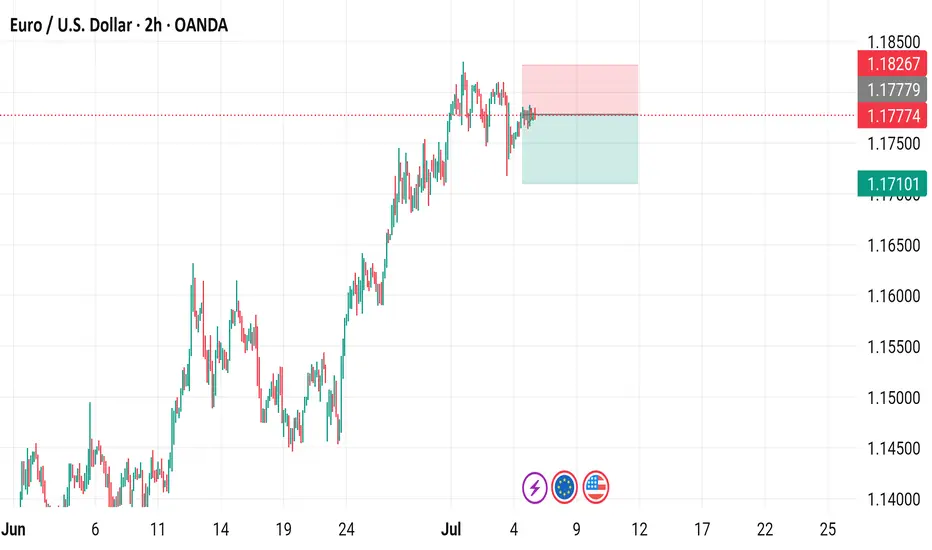
Euro / U.S. Dollar - 2h Chart (OANDA)2-hour candlestick chart of the EUR/USD currency pair from OANDA, showing the exchange rate trend from late June to July 07, 2025. The current rate is 1.17774, with a 0.00200 (0.17%) increase. The chart highlights a recent trading range between 1.17774 (sell) and 1.17824 (buy), with a notable upward movement in the past few hours.
EURUSD - Looking for the RTLooking for the RT on the upper supply zone, long term target for EURUSD is 1.200-1.2200. However, on RT we can potentially expect a larger pull back but will analyse PA.

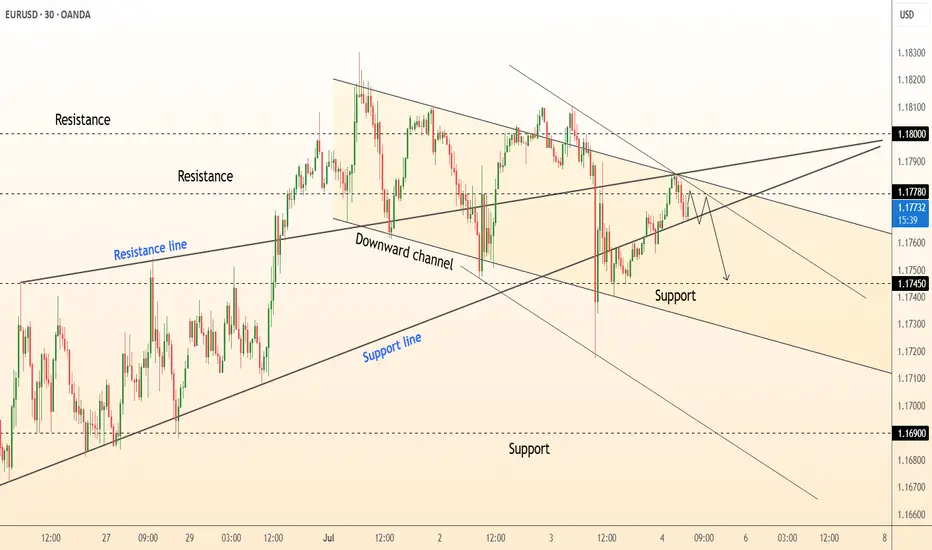
DeGRAM | EURUSD downturn in the channel📊 Technical Analysis
● Price is capped by a confluence of the June-July down-sloping channel roof and the former median resistance line at 1.1780; the last three candles form lower highs inside a micro bear-flag.
● Intraday structure now leans on the 1.1745–1.1750 support cluster: a break beneath this shelf completes the flag and exposes the channel floor/June pivot at 1.1690.
💡 Fundamental Analysis
● Pre-NFP dollar demand is rebuilding as ADP and ISM-services beat consensus, while French election uncertainty revives euro risk premium.
✨ Summary
Sell 1.1775 ± 5 pips; sustained trade below 1.1745 targets 1.1690. Short thesis void if 30-min candle closes above 1.1800.
-------------------
Share your opinion in the comments and support the idea with a like. Thanks for your support!
EURUSD BUY OPPORTUNITY Am seeing a buy Opportunities on EURUSD
Entry: 1.17100
Stoploss: 1.1700
Takeprofit: 1.17500
Comment your opinion
For Fund Management Contact me on X @shajudeakinoba1

EURUSD H1 I Bearish Reversal Based on the H1 chart, the price is approaching our sell entry level at 1.1778, a pullback resistance.
Our take profit is set at 1.1758, an overlap support.
The stop loss is set at 1.180, a swing high resistance.
High Risk Investment Warning
Trading Forex/CFDs on margin carries a high level of risk and may not be suitable for all investors. Leverage can work against you.
Stratos Markets Limited (tradu.com ):
CFDs are complex instruments and come with a high risk of losing money rapidly due to leverage. 63% of retail investor accounts lose money when trading CFDs with this provider. You should consider whether you understand how CFDs work and whether you can afford to take the high risk of losing your money.
Stratos Europe Ltd (tradu.com ):
CFDs are complex instruments and come with a high risk of losing money rapidly due to leverage. 63% of retail investor accounts lose money when trading CFDs with this provider. You should consider whether you understand how CFDs work and whether you can afford to take the high risk of losing your money.
Stratos Global LLC (tradu.com ):
Losses can exceed deposits.
Please be advised that the information presented on TradingView is provided to Tradu (‘Company’, ‘we’) by a third-party provider (‘TFA Global Pte Ltd’). Please be reminded that you are solely responsible for the trading decisions on your account. There is a very high degree of risk involved in trading. Any information and/or content is intended entirely for research, educational and informational purposes only and does not constitute investment or consultation advice or investment strategy. The information is not tailored to the investment needs of any specific person and therefore does not involve a consideration of any of the investment objectives, financial situation or needs of any viewer that may receive it. Kindly also note that past performance is not a reliable indicator of future results. Actual results may differ materially from those anticipated in forward-looking or past performance statements. We assume no liability as to the accuracy or completeness of any of the information and/or content provided herein and the Company cannot be held responsible for any omission, mistake nor for any loss or damage including without limitation to any loss of profit which may arise from reliance on any information supplied by TFA Global Pte Ltd.
The speaker(s) is neither an employee, agent nor representative of Tradu and is therefore acting independently. The opinions given are their own, constitute general market commentary, and do not constitute the opinion or advice of Tradu or any form of personal or investment advice. Tradu neither endorses nor guarantees offerings of third-party speakers, nor is Tradu responsible for the content, veracity or opinions of third-party speakers, presenters or participants.

EURUSD: Absolute Price Collapse Ahead! Short!
My dear friends,
Today we will analyse EURUSD together☺️
The recent price action suggests a shift in mid-term momentum. A break below the current local range around 1.17083 will confirm the new direction downwards with the target being the next key level of 1.16863.and a reconvened placement of a stop-loss beyond the range.
❤️Sending you lots of Love and Hugs❤️

EURUSD On The Rise! BUY!
My dear friends,
My technical analysis for EURUSD is below:
The market is trading on 1.1709 pivot level.
Bias - Bullish
Technical Indicators: Both Super Trend & Pivot HL indicate a highly probable Bullish continuation.
Target - 1.1729
About Used Indicators:
A pivot point is a technical analysis indicator, or calculations, used to determine the overall trend of the market over different time frames.
Disclosure: I am part of Trade Nation's Influencer program and receive a monthly fee for using their TradingView charts in my analysis.
———————————
WISH YOU ALL LUCK

EUR/USD at 1.1750 as EU Pushes Trade DealEUR/USD trades around 1.1745 in Tuesday’s Asian session, supported by strong Eurozone retail sales for May. The Euro benefits as the EU aims to finalize a preliminary trade deal with the US this week, seeking to maintain a 10% tariff beyond the August 1 deadline while negotiations continue. The proposed agreement would keep the 10% base tariff but exempt sensitive sectors like aviation and alcohol, which helps lift market sentiment toward the Euro.
Eurostat data showed retail sales rose 1.8% year-on-year in May, beating expectations of 1.2% but slowing from April’s 2.7%. Monthly sales fell 0.7%, matching forecasts.
Resistance for the pair is at 1.1830, while support is at 1.1730.

EUR/USD Trade Plan – Sell Limit StrategyEUR/USD has shown signs of completing a 5-wave bullish structure on the 4H chart, with price now re-testing a key supply zone. A Sell Limit has been positioned at 1.17962, anticipating a sharp reversal back toward the order block zone.
🔍 Technical Analysis
The chart shows a clear Elliott Wave formation, with wave V forming a weak new high, indicating buyer exhaustion.
Price is approaching the 1.17960–1.18013 supply zone, previously unmitigated.
This zone also holds an Order Block (OB) and liquidity above wave III, making it a prime area for institutional sell triggers.
📌 Entry: 1.17962
🛑 Stop Loss: 1.18113
🎯 Target Zone: 1.17122
📈 Risk–Reward: 3R – 6R - 10r potential (depending on trade management)
🧠 Fundamental Outlook
The upcoming trading week is filled with market-moving events from both the US and Eurozone:
🇺🇸 Key USD Events
Non-Farm Payrolls (Fri): Forecast 147K; strong print = bullish USD.
Unemployment Rate: Expected at 4.1%.
Powell Speech, ISM Services PMI: Will impact rate expectations and USD strength.
🇪🇺 Key EUR Events
CPI Flash Estimates: Any surprise may shift ECB tone.
Lagarde Speaks: Markets listening for any policy hints after soft data.
🧩 The combination of a potentially strong USD and weakened Euro fundamentals adds weight to a bearish EUR/USD outlook.
💡 Why This Setup Works
Perfect Liquidity Trap: The zone is designed to trigger late buyers before reversal.
Clean Risk–Reward: Defined SL with a high-probability downside path.
Macro + Technical Confluence: Both align toward downside potential.
Target OB: Strong institutional demand seen at 1.1712 offers a natural take-profit zone.
⚠️ Execution Guidance
Enter only if price hits the Sell Limit zone cleanly.
Avoid execution during red news releases.
Partial TP suggested near 1.1740 (around 2R–3R) to lock early profit.

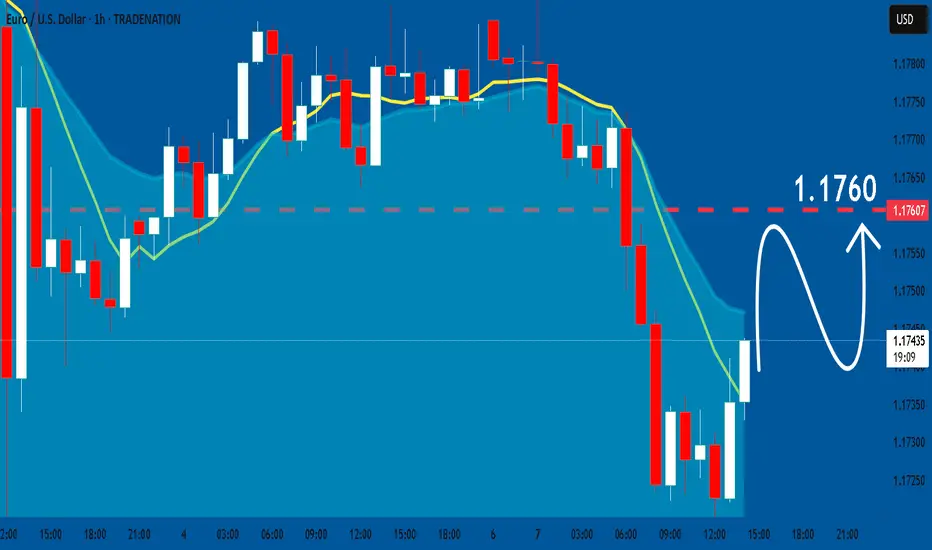
US Jobs Data Supports Fed Dovish SignalsThe EUR/USD stayed in a narrow range around 1.1760 during Friday’s Asian session, with limited movement as US markets were closed for Independence Day.
The US dollar gained modestly after Thursday’s NFP data showed 147,000 new jobs in June, beating the expected 110,000.
However, private sector job growth slowed, adding only 74,000 jobs in June versus a three-month average of 115,000. This trend supports Fed officials like Vice Chair Bowman, who recently called for rate cuts due to labor market risks.
Resistance for the pair is at 1.1830, while support is at 1.1730.
Where the coffee is strong (EUR/USD)Setup
EUR/USD is in a strong uptrend and recently broke above multi-year resistance just under 1.16. The pair looks to be targeting long term resistance at 1.23.
Signal
RSI is dropping back from overbought territory on the daily chart, offering a possible dip-buying opportunity above resistance-turned-support at 1.16.

EURUSD Will Go Higher From Support! Long!
Take a look at our analysis for EURUSD.
Time Frame: 1h
Current Trend: Bullish
Sentiment: Oversold (based on 7-period RSI)
Forecast: Bullish
The market is on a crucial zone of demand 1.172.
The oversold market condition in a combination with key structure gives us a relatively strong bullish signal with goal 1.177 level.
P.S
We determine oversold/overbought condition with RSI indicator.
When it drops below 30 - the market is considered to be oversold.
When it bounces above 70 - the market is considered to be overbought.
Disclosure: I am part of Trade Nation's Influencer program and receive a monthly fee for using their TradingView charts in my analysis.
Like and subscribe and comment my ideas if you enjoy them!
Tariff and oil volatility converge on July 9 Tuesday, July 9 marks a key deadline for two major market-moving events.
Tuesday is the official deadline for U.S.–EU trade negotiations. While a full deal is off the table, the EU hopes to secure a last-minute "agreement in principle" to avoid a threatened 50% U.S. tariff on some European exports.
President Trump’s history of moving deadlines adds uncertainty. Traders might like to watch for sharp intraday moves in EUR/USD and European equities tied to tariff risk.
OPEC’s International Seminar also kicks off on the 9th in Vienna. Energy ministers and CEOs from BP, Shell, and others will speak on oil supply, investment, and long-term strategy.
Crude has been volatile in July, and any signs of supply shifts or policy changes could drive WTI and Brent in either direction.

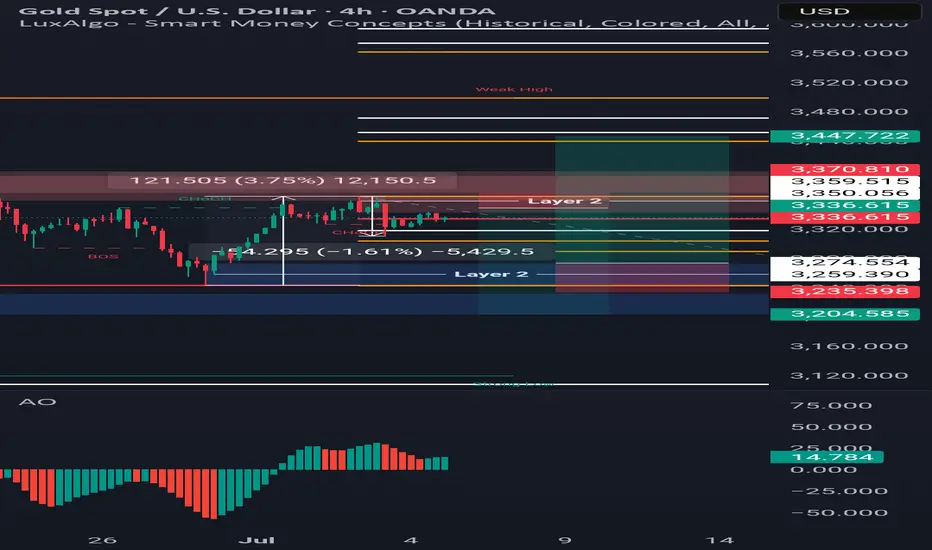
Gold in buyIn Day gold in side ways but we got h&d
In point stry we got low confrm also got high in day
day OB entry is Buylimit
4hrs OB entry is selllimit
If sell limit active hold buy limit
If buy limit active before sell limit delete sell limit
Tp 20,50,100,200,500&open pips
Use risky management
Note: entry will chance on Monday
EURO - Price can continue to grow inside rising channelHi guys, this is my overview for EURUSD, feel free to check it and write your feedback in comments👊
The price traded in a flat range between $1.1500 and $1.1750 for an extended period, testing both extremes multiple times with low volatility and indecision.
A breakout above $1.1750 initially looked promising but turned into a fakeout when sellers quickly pushed the price back below $1.1725, trapping aggressive longs.
After that shakeout, buyers regained control and propelled EUR into a rising channel, marked by higher highs and higher lows since the end of June.
Price has since respected the lower boundary of this rising channel near $1.1725–$1.1750, using it as reliable support for continued gains.
With two confirmed breakouts and the channel structure intact, bullish momentum suggests the pair can extend its move higher within the channel.
I expect Euro to continue climbing toward the next key resistance at $1.1980, where the upper channel line and structural supply zone converge.
If this post is useful to you, you can support me with like/boost and advice in comments❤️
Disclaimer: As part of ThinkMarkets’ Influencer Program, I am sponsored to share and publish their charts in my analysis.

EUR/USD – Smart Money Trap at 1.18? Massive Rejection Ahead 1. Technical Context
The pair has been moving inside a well-defined bullish channel since May, forming higher highs and higher lows. Price is currently hovering around 1.1718, approaching the upper boundary of the channel and a key weekly supply zone (1.1750–1.1850).
➡️ Potential scenario:
A short bullish extension toward 1.1780–1.1820 to trigger stop hunts, followed by a bearish rejection toward 1.1500, and potentially 1.1380.
The daily RSI is overbought (>70), suggesting a likely short-term correction.
2. Retail Sentiment
80% of retail traders are short, with an average entry around 1.1318.
This signals a liquidity cluster above current highs, increasing the likelihood of a fake bullish breakout followed by a sell-off.
➡️ Contrarian insight: Retail heavily short → market may push higher first to wipe them out before reversing lower.
3. COT Report – USD Index (DXY)
Non-commercials (speculators) increased their short exposure on USD (+3,134).
Commercials cut their short positions (-1,994), indicating a potential bottoming on the dollar.
➡️ Conclusion: USD strength could return soon → bearish pressure for EUR/USD.
4. COT Report – EUR FX
Non-commercials increased longs on EUR (+2,980) and sharply reduced shorts (-6,602) → market is now heavily net long.
Commercials remain net short (581,664 vs 417,363 longs).
➡️ Over-leveraged spec longs → vulnerable to downside squeeze if macro sentiment shifts.
5. Seasonality
June tends to be mildly bullish for EUR/USD.
July historically shows even stronger upward performance over the last 5–10 years.
➡️ Shorts are high risk in the very short term, but a bearish setup is likely in the second half of July, especially if price action confirms.
6. Trading Outlook
📍 Short-Term Bias: Neutral to bullish toward 1.1780–1.1820
📍 Mid-Term Bias: Bearish on rejection from supply area and break of channel
🎯 Key Levels:
1.1780–1.1850: critical decision zone (liquidity + weekly supply)
1.1500: first key support
1.1380: next downside target (demand zone + previous POC)
📌 Final Conclusion
The most likely play is a short setup from 1.1780–1.1850 on strong rejection, supported by:
Extreme retail positioning (80% short),
COT pointing to USD recovery,
Extended technical structure,
Overbought RSI on the daily chart.
