Fundamental Market Analysis for May 23, 2025 EURUSDEvent to pay attention today:
17:00 EET. USD- Volume of home sales on the primary market
EURUSD:
EUR/USD is recovering its recent losses from the previous session and is trading around 1.1310 during Asian hours on Friday. The pair is rising on the back of lower US Treasury yields, which continue to decline after the US 30-year bond yield retreated from 5.15 per cent, the highest in 19 months.
US President Donald Trump's ‘One Big Beautiful Bill’ has passed the House of Representatives and is on its way to the Senate, sparking fears of a widening budget deficit in the United States (US).
However, EUR/USD lost around 0.50 per cent on Thursday as the US dollar gained as the S&P Global Composite Purchasing Managers' Index (PMI) for May came in at 52.1, up from April's 50.6. Meanwhile, the manufacturing PMI rose to 52.3 from 50.2 previously, while the services PMI rose to 52.3 from 50.8.
Fed Chairman Christopher Waller noted on Thursday that markets are watching fiscal policy. Waller also said that if rates are close to 10%, the economy will be in good shape for H2 and the Fed may be in a position to cut rates later this year.
The Financial Times reported that President Trump is pushing the European Union (EU) to cut tariffs or impose more duties. US Trade Representative Greer is set to tell fellow EU Commissioner for Trade and Economic Security, Maroš Šefčovič, that the recent ‘explanatory memorandum’ does not meet US expectations.
Trading recommendation: BUY 1.13200, SL 1.13000, TP 1.14200
Eurusd-4

EURUSD H4 I Bearish Reversal Based on the H4 chart, the price is rising toward our sell entry level at 1.1426, a pullback resistance that aligns with the 161.8% Fibo extension.
Our take profit is set at 1.1275, an overlap support.
The stop loss is set at 1.1549, a swing high resistance.
Disclaimer
High Risk Investment Warning
Trading Forex/CFDs on margin carries a high level of risk and may not be suitable for all investors. Leverage can work against you.
Stratos Markets Limited (tradu.com ):
CFDs are complex instruments and come with a high risk of losing money rapidly due to leverage. 63% of retail investor accounts lose money when trading CFDs with this provider. You should consider whether you understand how CFDs work and whether you can afford to take the high risk of losing your money.
Stratos Europe Ltd (tradu.com ):
CFDs are complex instruments and come with a high risk of losing money rapidly due to leverage. 63% of retail investor accounts lose money when trading CFDs with this provider. You should consider whether you understand how CFDs work and whether you can afford to take the high risk of losing your money.
Stratos Global LLC (tradu.com ):
Losses can exceed deposits.
Please be advised that the information presented on TradingView is provided to Tradu (‘Company’, ‘we’) by a third-party provider (‘TFA Global Pte Ltd’). Please be reminded that you are solely responsible for the trading decisions on your account. There is a very high degree of risk involved in trading. Any information and/or content is intended entirely for research, educational and informational purposes only and does not constitute investment or consultation advice or investment strategy. The information is not tailored to the investment needs of any specific person and therefore does not involve a consideration of any of the investment objectives, financial situation or needs of any viewer that may receive it. Kindly also note that past performance is not a reliable indicator of future results. Actual results may differ materially from those anticipated in forward-looking or past performance statements. We assume no liability as to the accuracy or completeness of any of the information and/or content provided herein and the Company cannot be held responsible for any omission, mistake nor for any loss or damage including without limitation to any loss of profit which may arise from reliance on any information supplied by TFA Global Pte Ltd.
The speaker(s) is neither an employee, agent nor representative of Tradu and is therefore acting independently. The opinions given are their own, constitute general market commentary, and do not constitute the opinion or advice of Tradu or any form of personal or investment advice. Tradu neither endorses nor guarantees offerings of third-party speakers, nor is Tradu responsible for the content, veracity or opinions of third-party speakers, presenters or participants.

EURUSD – Consolidation below trendline hints at breakout aheadHello traders! EURUSD is currently forming a rather interesting consolidation pattern right below the descending trendline – a level that has rejected price twice in the past.
After a mild pullback from the 1.1382 zone, price has quickly recovered and is now hovering around the EMA34 and EMA89. This is an important confluence area and is acting as short-term support around 1.1263.
If EURUSD continues to hold above this support and forms sideways accumulation, the probability of a trendline breakout will increase. In that case, the next target will likely be the previous high at 1.1382.
U.S. bond yields are fluctuating sharply, and geopolitical tensions – such as trade uncertainty or regional instability – may serve as catalysts that support the euro.
Keep an eye on the breakout zone – if price breaks out decisively, it could be a strong confirmation of a new bullish trend!

EURUSD – Buy to Mega Resistance 1.2455 (then SELL BIG)💹📊 EURUSD – Buy to Mega Resistance 1.2455 (then SELL BIG) 🧨🔮
The EURUSD is marching toward history once again—right into the jaws of the 1.2455 Mega Resistance (descending level-approximate target). As always, the structure tells the story.
📈 What we’re seeing now is the third peak of a massive, decade-long descending formation. Every previous touch has ended in a violent rejection—2014, 2018... and now 2025?
👁 But here’s where it gets spicy:
See that small “👁” near 2017 on the chart? That wasn’t just a market pivot—it was a geopolitical tremor that reshaped the EURUSD landscape. Want to dive into what really happened behind closed doors in 2017 that’s still quietly echoing through the price action today? Drop a comment below for the conspiracy version of this chart. 🕵️♂️📉
🔍 Strategy Overview:
✅ BUY setups targeting 1.2455
❗ Then get ready to SELL BIG — the third touch historically marks the turn.
📉 Bear targets: 1.03860 and 1.04772 (classic collapse zones)
The chart confirms the momentum is still alive—just like the 2020 setup that nailed the top at 1.232 ( )
History doesn’t repeat… but it sure does rhyme 🎭
One Love,
The FXPROFESSOR 💙
Disclosure: I am happy to be part of the Trade Nation's Influencer program and receive a monthly fee for using their TradingView charts in my analysis. Awesome broker, where the trader really comes first!

EURUSD Set To Fall! SELL!
My dear subscribers,
My technical analysis for EURUSD is below:
The price is coiling around a solid key level - 1.1332
Bias - Bearish
Technical Indicators: Pivot Points High anticipates a potential price reversal.
Super trend shows a clear sell, giving a perfect indicators' convergence.
Goal - 1.1242
About Used Indicators:
By the very nature of the supertrend indicator, it offers firm support and resistance levels for traders to enter and exit trades. Additionally, it also provides signals for setting stop losses
Disclosure: I am part of Trade Nation's Influencer program and receive a monthly fee for using their TradingView charts in my analysis.
———————————
WISH YOU ALL LUCK

EUR/USD Forming Double Top –Bearish Reversal Toward Key Support?📉 EUR/USD Technical Outlook – Bearish Bias Developing 🔍
🟪 Key Resistance Zone:
📍 1.1350 – 1.1450
Price has tested this resistance zone multiple times, forming a double-top pattern (🔄) within the highlighted circle. This signals buying exhaustion and potential reversal pressure. The recent failure to break above confirms the zone’s strength.
🔴 EMA Confluence:
🧭 50 EMA (red): ~1.1242
🧭 200 EMA (blue): ~1.0961
The price is currently hovering just above the 50 EMA but well above the 200 EMA, which is acting as a dynamic support. The crossover has already occurred, so if price breaks below the 50 EMA decisively, momentum could shift bearish.
🔻 Support Breakdown Risk:
A breakdown from the 1.1200 neckline area (highlighted in red oval) would confirm the double-top pattern 🎯. That opens downside potential toward the strong demand zone below.
🟪 Strong Support Zone:
📍 1.0700 – 1.0800
This area aligns with prior consolidation (March lows) and the 200 EMA, making it a high-probability reversal zone 📈 if the bearish scenario plays out.
📌 Trade Setup Insight:
✅ Bearish confirmation below 1.1200 neckline 📉
🎯 Target: 1.0800 zone
❌ Invalidation: Break above 1.1350 resistance
🔵 Summary:
The chart is hinting at a classic double-top reversal below a key resistance zone. If price breaks the neckline, sellers are likely to gain control, targeting the strong support near the 200 EMA.
📊 Bias: Bearish 👇
📅 Timeframe: Daily
🛑 Risk Management: Watch for fake-outs near neckline; volume confirmation preferred.

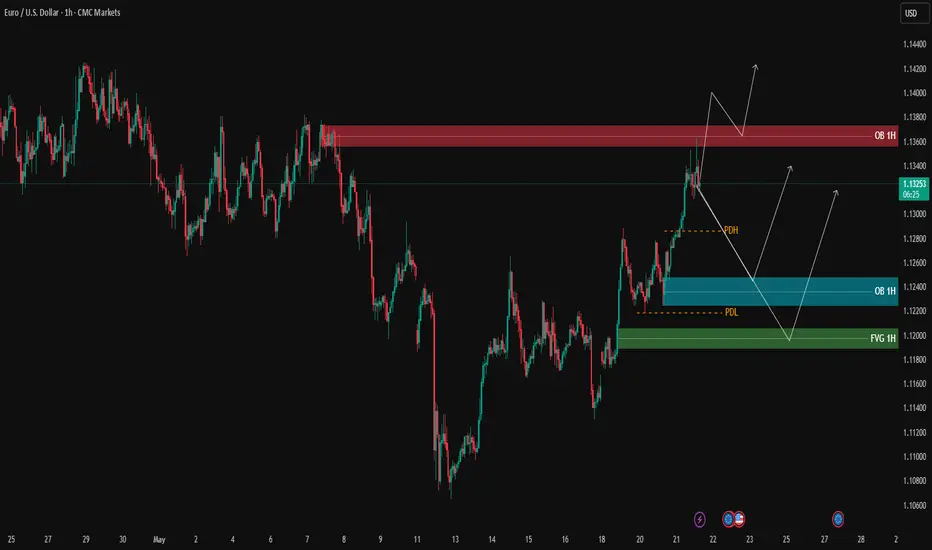
EURUSD – Testing 1H Supply Zone, Awaiting Confirmation | ProfitaAfter a strong bullish rally breaking previous highs, EURUSD is now reacting to the 1H supply zone (OB 1H) marked in red.
We’re seeing an initial bearish rejection from this zone. If sellers maintain control, price may retrace toward the lower demand areas:
Blue OB 1H zone (1.12200 – 1.12450)
Green FVG 1H further below
However, if buyers manage to push price above the red OB and close a candle above it, continuation to the upside remains a valid scenario.
📌 Key Levels
🟢 Support Zones:
1.12200 – 1.12450
1.11780 – 1.12000
🔴 Resistance:
1.13500 – 1.13800
⚠️ Note:
Watch for lower-timeframe (M5/M3) confirmations for entry. Only act on clear setups inside the zones.
🔍 Insight by ProfitaminFX
Can EUR/USD hold above the 1.13 threshold?The EUR/USD exchange rate faced selling pressure during the European trading session, falling to around 1.13. The price movement was dragged down by the significantly lower-than-expected Eurozone preliminary PMI data for May, with the composite PMI dropping from 49.5 in April to 50.4, indicating signs of contraction in overall business activity.
From a technical perspective on the daily chart, EUR/USD is currently near the 1.13 level, showing signs of technical adjustment pressure. After forming a high at 1.1572, the price pulled back. The upper band of the Bollinger Bands is at 1.1494, the middle band at 1.13, and the lower band at 1.1110. The current exchange rate is trading precisely near the middle Bollinger Band, a level that typically carries significant support or resistance significance.
In the market, there are no absolutes, and neither upward nor downward trends are set in stone. Therefore, the ability to judge the balance between market gains and losses is your key to success. Let money become our loyal servant.

EURUSD: Bulls Will Push
The price of EURUSD will most likely increase soon enough, due to the demand beginning to exceed supply which we can see by looking at the chart of the pair.
Disclosure: I am part of Trade Nation's Influencer program and receive a monthly fee for using their TradingView charts in my analysis.
❤️ Please, support our work with like & comment! ❤️

EURUSD: Will Go Down! Short!
My dear friends,
Today we will analyse EURUSD together☺️
The in-trend continuation seems likely as the current long-term trend appears to be strong, and price is holding below a key level of 1.12922 So a bearish continuation seems plausible, targeting the next low. We should enter on confirmation, and place a stop-loss beyond the recent swing level.
❤️Sending you lots of Love and Hugs❤️

EURUSD - The Bears Are Getting Started!Hello TradingView Family / Fellow Traders. This is Richard, also known as theSignalyst.
📈EURUSD has been bullish trading within the rising blue channel.
However, it is currently retesting the upper bound of both red and blue channels.
🏹 The highlighted red circle is a strong area to look for sell setups as it is the intersection of the upper trendlines and orange resistance zone.
📚 As per my trading style:
As #EURUSD is around the red circle zone, I will be looking for bearish reversal setups (like a double top pattern, trendline break , and so on...)
📚 Always follow your trading plan regarding entry, risk management, and trade management.
Good luck!
All Strategies Are Good; If Managed Properly!
~Rich
Disclosure: I am part of Trade Nation's Influencer program and receive a monthly fee for using their TradingView charts in my analysis.

EURO - Price may make a movement up and then dropHi guys, this is my overview for EURUSD, feel free to check it and write your feedback in comments👊
A few days ago price traded between $1.0870 level inside a flat, where it after fell to bottom part and made an upward impulse.
Price exited from flat, breaking $1.0870 level too, and then made a correction, after which continued to grow.
Later, Euro reached $1.1425 level, breaking recently $1.1155 level recently, and soon price broke $1.1425 level too.
Next, price started to traded inside pennant, where it dropped from resistance line to support line, breaking $1.1425 level again.
Euro fell to support line, after which started to grow and in a short time, rose to resistance line.
Now, I think that Euro may make a movement up and then start to decline to $1.1235 support line of pennant.
If this post is useful to you, you can support me with like/boost and advice in comments❤️
Disclaimer: As part of ThinkMarkets’ Influencer Program, I am sponsored to share and publish their charts in my analysis.

breaking above its previous swing high.GBP/USD Technical – Break of Structure, Liquidity Sweep, and Potential Downside Movement
The GBP/USD currency pair recently demonstrated significant bullish strength by breaking above its previous swing high, which resulted in a clear Break of Structure (BOS). This move indicated a continuation of the upward trend as the market pushed higher. However, the latest price action suggests a shift in sentiment that traders should be aware of.
Despite the earlier bullish momentum, the market has now swept the previous daily swing high—meaning it briefly moved above that level only to close back below it. This kind of price behavior often signals a potential liquidity grab rather than a sustained breakout. Such a move is frequently followed by a reversal or corrective move to the downside, as it indicates that institutional participants may have been targeting stop-losses or resting liquidity before driving the price in the opposite direction.
Given this, there is a growing possibility that the market may retrace further downward. A likely target could be the previously marked swing low, where additional liquidity may be resting. Moreover, beneath this level lies a Bullish Price Rebalance (BPR) zone, which could serve as an area of interest for a potential bullish reaction if the market taps into it.
At this stage, it's crucial to monitor price action closely and wait for further confirmations before taking any directional bias. Watching how the market behaves near the previous swing low and the underlying BPR zone can offer valuable insight into the next probable move.
As always, conduct your own thorough research (DYOR) before making any trading decisions. This is not financial advice and is intended solely for educational and analytical purposes.

EURUSD Will Go Lower From Resistance! Sell!
Please, check our technical outlook for EURUSD.
Time Frame: 7h
Current Trend: Bearish
Sentiment: Overbought (based on 7-period RSI)
Forecast: Bearish
The market is approaching a key horizontal level 1.130.
Considering the today's price action, probabilities will be high to see a movement to 1.121.
P.S
The term oversold refers to a condition where an asset has traded lower in price and has the potential for a price bounce.
Overbought refers to market scenarios where the instrument is traded considerably higher than its fair value. Overvaluation is caused by market sentiments when there is positive news.
Disclosure: I am part of Trade Nation's Influencer program and receive a monthly fee for using their TradingView charts in my analysis.
Like and subscribe and comment my ideas if you enjoy them!

Euro Extends Rally Ahead of PMI DataEUR/USD trades near 1.1340 during Asian hours, close to two-week highs, extending gains for a fourth session ahead of Eurozone PMI data expected to show improved growth for May.
The U.S. dollar remains under pressure as markets await Thursday’s S&P Global PMI. Moody’s downgraded the U.S. credit rating to Aa1, matching earlier cuts by Fitch and S&P, citing rising debt, projected to reach 134% of GDP by 2035, and a nearly 9% deficit.
Trump’s tax-cut plan cleared the House Rules Committee, but the DXY still trades lower near 99.50.
The key resistance is located at 1.1390, and the first support stands at 1.1260.

EURUSD Pullback in Play – Next Stop: $1.1337EURUSD ( FX:EURUSD ) is moving in the Resistance zone($1.1310-$1.1162) while the upper line of the descending channel has been broken.
According to Elliott Wave theory , a breakout of the descending channel can at least confirm the end of a corrective wave . The corrective wave structure was a Double Three Correction(WXY) .
I expect EURUSD to rise to at least $1.1337 after completing a pullback to the upper line of the descending channel .
Note: If EURUSD touches $1.11590, we can expect further declines.
Please respect each other's ideas and express them politely if you agree or disagree.
Euro/U.S. Dollar Analyze (EURUSD), 4-hour time frame.
Be sure to follow the updated ideas.
Do not forget to put a Stop loss for your positions (For every position you want to open).
Please follow your strategy and updates; this is just my Idea, and I will gladly see your ideas in this post.
Please do not forget the ✅' like '✅ button 🙏😊 & Share it with your friends; thanks, and Trade safe.

DeGRAM | EURUSD reached the upper boundary of the channel📊 Technical Analysis
● Price is capped by the H4 supply at 1.130-1.135 and the roof of a year-long downward channel; the latest test printed a bearish pin (red arrow).
● Inside, a smaller blue rising channel has just broken south—turning 1.128 into fresh resistance—and leaves room to the mid-channel support at 1.121, then the lower rail / 1.113.
💡 Fundamental Analysis
● ECB’s Villeroy repeated that a June cut is “very likely” while Fed minutes stressed rates may stay restrictive; widening yield gap revives USD demand.
✨ Summary
Fade 1.128-1.131; targets 1.121 ➜ 1.113, extension 1.106. Short view void on a close above 1.135.
-------------------
Share your opinion in the comments and support the idea with like. Thanks for your support!

STRUCTURE SHIFT OR FALSE BREAKOUT? MAJOR MOVE LOADING? EURUSD 22/05 – STRUCTURE SHIFT OR FALSE BREAKOUT? MAJOR MOVE LOADING?
🌐 MACRO OUTLOOK
The market remains caught between dovish expectations and hawkish reality. While recent US CPI and PPI came in weaker than expected, Fed officials have refrained from confirming any imminent rate cuts, keeping the dollar resilient in the medium term.
Meanwhile, the ECB’s cautious stance and ongoing inflation risks across the eurozone continue to cap euro strength. The divergence in tone between the Fed and the ECB adds to the short-term volatility and uncertainty around EURUSD’s direction.
📉 TECHNICAL ANALYSIS (H1 + H4 Timeframe)
EURUSD has faked a breakout above the 1.1310–1.1320 resistance zone and is now pulling back to the key structure support around 1.1279 — a critical short-term level.
📌 Key Observations:
Bearish engulfing candle formed on H1 after price rejected the upper zone → potential reversal signal.
EMA 13 is crossing below EMA 34 → suggesting short-term downside pressure.
A confirmed H1 close below 1.1279 opens room for deeper retracement towards 1.1234 (previous demand/FVG area).
If momentum builds, we could see a broader correction toward 1.1148 in the coming days.
⚙️ TRADE STRATEGY FOR TODAY
🔻 PRIMARY SCENARIO – SELL THE RALLY
Entry Zone: 1.1315 – 1.1318 (near FVG + fake breakout zone)
Stop Loss: 1.1360
Take Profit Targets:
→ TP1: 1.1279
→ TP2: 1.1234
→ TP3: 1.1148
🔹 ALTERNATE SCENARIO – BUY SCALP ON STRONG REACTION
Buy Entry: 1.1234 – 1.1230 (only with bullish M15 confirmation)
Stop Loss: 1.1210
Take Profit: 1.1279 → 1.1300
🧠 STRATEGIC INSIGHT
A D1 candle close below 1.1234 will confirm a structure break and likely initiate a deeper downward trend.
On the flip side, if 1.1234 holds and US jobless claims disappoint later today, EURUSD may recover back to test 1.131x.
Market sentiment is highly reactive — stay flexible and prioritize price action confirmation.
📌 FINAL THOUGHTS:
EURUSD is at a pivotal point — either confirming a new downtrend or bouncing back within the current range. This is a trader’s market: clear key levels, disciplined risk management, and adaptive execution are essential.
📈 Follow for real-time chart updates, FVG mapping, and more daily trading setups.
Stay smart, stay sharp. Risk management first.

EURUSD BULLISH OR BEARISH DETAILED ANALYSISEURUSD has followed our expectations beautifully, bouncing strongly off a key support zone near 1.1270. This zone was previously a tough resistance which the pair broke through, and it’s now acting as a strong demand area. The latest bullish engulfing candle from this region signals solid buying pressure, confirming that bulls are stepping in to protect this structure. I’m now targeting a move toward the 1.17 level, which aligns with the previous high and the next major resistance on the chart.
From a macro perspective, the euro is showing resilience amid recent ECB policy comments, where officials have adopted a cautious but steady tone. Inflation remains persistent enough to delay aggressive rate cuts, keeping EUR demand intact. Meanwhile, the dollar is seeing renewed selling interest as market expectations shift toward a Fed pause, especially after softer US economic indicators including retail sales and jobless claims. This divergence is likely to support further upside in EURUSD.
Technically, this is a classic textbook retest of broken resistance turned support, backed by momentum indicators such as RSI now bouncing from mid-range and MACD showing signs of a potential bullish crossover. Volume has spiked at the support zone, confirming institutional participation. As long as EURUSD holds above 1.1270, I remain bullish and see this move extending toward 1.17 over the coming sessions.
This setup presents a strong risk-to-reward opportunity with momentum aligning with structure. The breakout and retest scenario is fully intact, and fundamentals are now favoring a continuation to the upside. Traders and swing holders should keep this on their radar as EURUSD looks ready to climb further.

EUR-USD Potential Long! Buy!
Hello,Traders!
EUR-USD is trading in an
Uptrend and the pair made
A breakout of the key horizontal
Level of 1.1300 which is confirmed
So now the price is consolidating
Above the new support
And after a potential retest
Of the support level we are
Likely to see a further
Bullish move up
Buy!
Comment and subscribe to help us grow!
Check out other forecasts below too!
Disclosure: I am part of Trade Nation's Influencer program and receive a monthly fee for using their TradingView charts in my analysis.

GBP/CAD Poised for Breakout – What’s Next After 1.8600?1. TECHNICAL CONTEXT (Daily Chart)
GBP/CAD has been trading within a well-defined ascending channel since early 2025. After hitting the lower bound of the channel around 1.8050 in May, price bounced sharply and regained strength, pushing back above the key 1.8400–1.8450 zone, now confirmed as new support.
Currently, price is approaching the 1.8600 area, which represents:
The upper boundary of the April–May consolidation range
A clear supply zone visible on the weekly chart
A technical resistance cluster (previous closes + Fibonacci levels)
The RSI shows growing momentum, yet not overbought, suggesting potential upside extension toward 1.8779, the monthly high.
Key Technical Levels:
Resistance: 1.8600 – 1.8779 (extended target)
Support: 1.8401 (weekly) and 1.8250 (mid-range level)
Primary Trend: Bullish
Structure: Active ascending channel
2. INSTITUTIONAL POSITIONING (COT REPORT – May 13, 2025)
CAD:
Non-Commercials (speculators) are heavily net short:
23,250 longs vs 105,466 shorts = -82,216 net
Weekly increase: +18,084 new shorts → clear rise in bearish pressure
Commercials (hedgers) are net long, typical of risk hedging, indicating an opposing view to speculators
GBP:
Non-Commercials are net long:
89,540 longs vs 62,324 shorts = +27,216 net, despite a minor weekly reduction (-4,844)
Commercials are net short, likely hedging strength in the pound
COT Takeaway:
Speculators are clearly favoring GBP strength vs CAD, while CAD is under heavy short pressure. This supports further upside in GBP/CAD.
3. RETAIL SENTIMENT
80% of retail traders are short GBP/CAD, with an average entry at 1.8551
20% long, with average entry at 1.8147
This extreme retail skew represents a contrarian bullish signal: the market may push higher to trigger stop-losses on poorly positioned shorts.
4. SEASONALITY
CAD in May:
Mixed behavior with a slight bearish/neutral tendency on 10y and 2y averages
Monthly average: as low as -0.0097 (10-year data)
GBP in May:
Historically one of the weakest months for the British pound
Average returns range between -0.015 and -0.0226
That said, 2025 appears to diverge from seasonal norms, with GBP showing relative strength across the board.
Seasonality Takeaway:
While seasonality favors CAD over GBP in May, this year’s price action and positioning override that pattern.
TRADING SUMMARY
🔹 Primary Bias: Moderately Bullish
🔹 Technical Outlook: Positive structure above key support at 1.8400
🔹 COT Insight: Supports upside due to aggressive CAD short buildup
🔹 Retail Sentiment: Skewed short → potential short squeeze
🔹 Seasonality: Bearish for GBP, but currently outweighed by fundamentals/positioning
SCENARIOS
📈 Bullish Scenario (preferred):
Break and hold above 1.8600 → acceleration toward 1.8779
Midway target: 1.8670 (psychological level)
Technical stop: Below 1.8400 (or trailing SL on breakout)
📉 Corrective Scenario:
Failure at 1.8600 → pullback to 1.8401 (bullish retest)
Deeper weakness only confirmed on break below 1.8250, which would invalidate the ascending channel
CONCLUSION
GBP/CAD is in a structurally bullish setup, backed by speculative favor toward GBP and an extreme short bias on CAD. Despite the unfavorable seasonality for GBP, the technical trend and positioning data justify a bullish outlook with a target at 1.8779, contingent on a confirmed break above 1.8600.

EURUSD H4 | Bullish Reversal Based on the H4 chart analysis, the price is approaching our buy entry level at 1.2265, a pullback support that aligns with the 38.2% Fibonacci retracement.
Our take profit is set at 1.1426, an overlap resistance.
The stop loss is placed at 1.1193, a pullback resistance.
High Risk Investment Warning
Trading Forex/CFDs on margin carries a high level of risk and may not be suitable for all investors. Leverage can work against you.
Stratos Markets Limited (tradu.com):
CFDs are complex instruments and come with a high risk of losing money rapidly due to leverage. 63% of retail investor accounts lose money when trading CFDs with this provider. You should consider whether you understand how CFDs work and whether you can afford to take the high risk of losing your money.
Stratos Europe Ltd (tradu.com):
CFDs are complex instruments and come with a high risk of losing money rapidly due to leverage. 63% of retail investor accounts lose money when trading CFDs with this provider. You should consider whether you understand how CFDs work and whether you can afford to take the high risk of losing your money.
Stratos Global LLC (tradu.com):
Losses can exceed deposits.
Please be advised that the information presented on TradingView is provided to Tradu (‘Company’, ‘we’) by a third-party provider (‘TFA Global Pte Ltd’). Please be reminded that you are solely responsible for the trading decisions on your account. There is a very high degree of risk involved in trading. Any information and/or content is intended entirely for research, educational and informational purposes only and does not constitute investment or consultation advice or investment strategy. The information is not tailored to the investment needs of any specific person and therefore does not involve a consideration of any of the investment objectives, financial situation or needs of any viewer that may receive it. Kindly also note that past performance is not a reliable indicator of future results. Actual results may differ materially from those anticipated in forward-looking or past performance statements. We assume no liability as to the accuracy or completeness of any of the information and/or content provided herein and the Company cannot be held responsible for any omission, mistake nor for any loss or damage including without limitation to any loss of profit which may arise from reliance on any information supplied by TFA Global Pte Ltd.
The speaker(s) is neither an employee, agent nor representative of Tradu and is therefore acting independently. The opinions given are their own, constitute general market commentary, and do not constitute the opinion or advice of Tradu or any form of personal or investment advice. Tradu neither endorses nor guarantees offerings of third-party speakers, nor is Tradu responsible for the content, veracity or opinions of third-party speakers, presenters or participants.

Mid-Week FOREX Forecast: Will The USD Remain Weak?In this video, we will update Sunday's forecasts mid-week, and look for valid setup for the rest of the week ahead. The following FX markets will be analyzed:
In this video, we will analyze the following FX Majors markets:
USD Index
EUR
GBP
AUD
NZD
CAD
CHF
JPY
The expected short term bearishness in the USD came, but will it continue for the rest of the week? Wait patiently for the market to tip its hand, and trade accordingly. Have a plan in place if the protected low at 99.172 holds or folds.
Enjoy!
May profits be upon you.
Leave any questions or comments in the comment section.
I appreciate any feedback from my viewers!
Like and/or subscribe if you want more accurate analysis.
Thank you so much!
Disclaimer:
I do not provide personal investment advice and I am not a qualified licensed investment advisor.
All information found here, including any ideas, opinions, views, predictions, forecasts, commentaries, suggestions, expressed or implied herein, are for informational, entertainment or educational purposes only and should not be construed as personal investment advice. While the information provided is believed to be accurate, it may include errors or inaccuracies.
I will not and cannot be held liable for any actions you take as a result of anything you read here.
Conduct your own due diligence, or consult a licensed financial advisor or broker before making any and all investment decisions. Any investments, trades, speculations, or decisions made on the basis of any information found on this channel, expressed or implied herein, are committed at your own risk, financial or otherwise.
