Bearish drop?EUR/USD is rising towards the resistance level which is a pullback resistance that lines up with the 50% Fibonacci retracement and could drop from this level to our take profit.
Entry: 1.1765
Why we like it:
There is a pullback resistance that lines up with the 50% Fibonacci retracement.
Stop loss: 1.1807
Why we like it:
There is a pullback support level.
Take profit: 1.1712
Why we like it:
There is a pullback support level.
Enjoying your TradingView experience? Review us!
Please be advised that the information presented on TradingView is provided to Vantage (‘Vantage Global Limited’, ‘we’) by a third-party provider (‘Everest Fortune Group’). Please be reminded that you are solely responsible for the trading decisions on your account. There is a very high degree of risk involved in trading. Any information and/or content is intended entirely for research, educational and informational purposes only and does not constitute investment or consultation advice or investment strategy. The information is not tailored to the investment needs of any specific person and therefore does not involve a consideration of any of the investment objectives, financial situation or needs of any viewer that may receive it. Kindly also note that past performance is not a reliable indicator of future results. Actual results may differ materially from those anticipated in forward-looking or past performance statements. We assume no liability as to the accuracy or completeness of any of the information and/or content provided herein and the Company cannot be held responsible for any omission, mistake nor for any loss or damage including without limitation to any loss of profit which may arise from reliance on any information supplied by Everest Fortune Group.
Eurusd-4

XAUUSD : Bull or Bear ? (READ THE CAPTION)By analyzing the gold chart on the 4-hour timeframe, we can see that the price continued its correction yesterday, dropping to as low as $3327. However, gold rebounded and is currently trading around the $3344 level.
The key condition for further bullish movement is a stable hold above $3338. If this level holds, the next potential upside targets are $3366 and $3399 respectively.
Please support me with your likes and comments to motivate me to share more analysis with you and share your opinion about the possible trend of this chart with me !
Best Regards , Arman Shaban

EURUSD: Expecting Bullish Continuation! Here is Why:
The analysis of the EURUSD chart clearly shows us that the pair is finally about to go up due to the rising pressure from the buyers.
Disclosure: I am part of Trade Nation's Influencer program and receive a monthly fee for using their TradingView charts in my analysis.
❤️ Please, support our work with like & comment! ❤️

EURUSD 30Min Engaged ( Bullish Entry Detected )————-
➕ Objective: Precision Volume Execution
Time Frame: 30-Minute Warfare
Entry Protocol: Only after volume-verified breakout
🩸 Bullish Wave Coming From : 1.18050
➗ Hanzo Protocol: Volume-Tiered Entry Authority
➕ Zone Activated: Dynamic market pressure detected.
The level isn’t just price — it’s a memory of where they moved size.
Volume is rising beneath the surface — not noise, but preparation.
🔥 Tactical Note:
We wait for the energy signature — when volume betrays intention.
The trap gets set. The weak follow. We execute.
EURUSD: Move Up Expected! Long!
My dear friends,
Today we will analyse EURUSD together☺️
The recent price action suggests a shift in mid-term momentum. A break above the current local range around 1.17930v will confirm the new direction upwards with the target being the next key level of 1.17985 and a reconvened placement of a stop-loss beyond the range.
❤️Sending you lots of Love and Hugs❤️

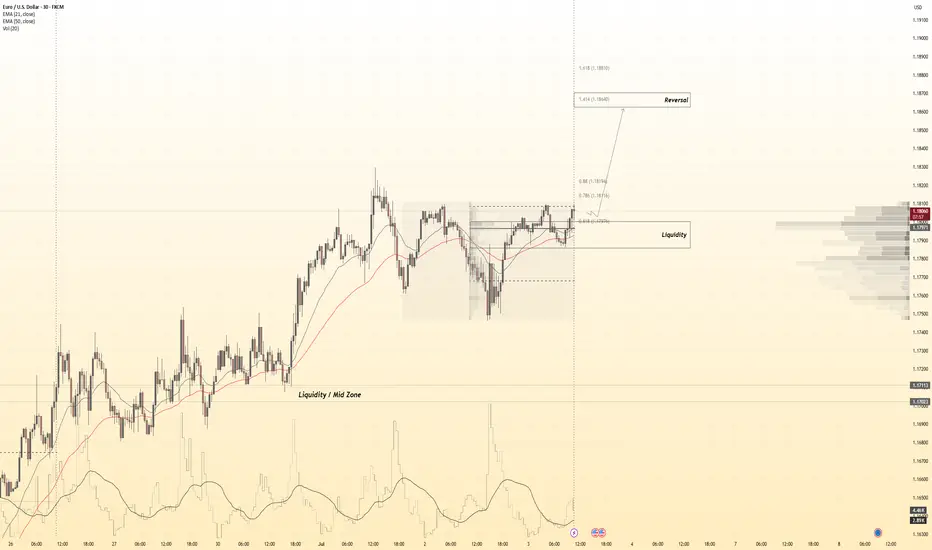
Nearing the Top: A Final Push or Smart Money Liquidity Trap?EUR/USD – Nearing the Top: A Final Push or Smart Money Liquidity Trap?
🌍 MACRO OUTLOOK – EURO CLIMBS WHILE USD TREADS ON UNCERTAIN POLITICAL GROUND:
EUR/USD is trading just below the 1.1700 mark as investors remain cautious about the US dollar's long-term credibility. Growing concerns over the Federal Reserve’s independence — should the “Trump 2.0” scenario unfold — have weighed heavily on USD sentiment across global markets.
Meanwhile, the Euro is gaining support thanks to a relatively hawkish tone from the European Central Bank (ECB). Policymakers appear reluctant to ease policy prematurely, which supports the Euro through expectations of prolonged higher interest rates.
However, with no major catalyst in play yet, traders are watching closely for mid-tier US data and any upcoming statements from ECB officials that might set the tone for the next directional breakout.
📊 TECHNICAL ANALYSIS – H4 TIMEFRAME:
Market Structure: EUR/USD remains in a well-defined ascending price channel. However, the pair is now testing the upper band near the 1.1804 resistance, a key liquidity zone where sellers previously stepped in.
EMA Alignment: Price is trading above the EMA 13/34/89/200 cluster — a strong sign of sustained bullish momentum.
Momentum Indicators:
RSI is hovering near 70 — potential overbought territory.
ADX remains above 25 — confirming trend strength but signaling caution at extended highs.
FVG (Fair Value Gap): A visible unfilled gap between 1.1600 and 1.1640 could act as a magnetic zone for price to revisit before the next impulse move.
🔹 Key Resistance: 1.1804 – 1.1835
🔹 Key Support: 1.1640 – 1.1600 (gap zone)
🔹 Major Demand Zone: 1.1499 – 1.1515
🎯 TRADE PLAN:
Scenario 1 – Buy the Dip (Primary Bias):
Entry: 1.1600 – 1.1640
Stop Loss: 1.1550
Targets: 1.1750 → 1.1800 → 1.1850
Scenario 2 – Buy Deep Pullback:
Entry: 1.1499 – 1.1515
Stop Loss: 1.1450
Targets: 1.1640 → 1.1700
Scenario 3 – Countertrend Sell at Key Resistance (High Risk):
Entry: 1.1804 – 1.1830
Stop Loss: 1.1860
Targets: 1.1720 → 1.1650
📌 Strategic Insight:
EUR/USD may be setting up for either a breakout continuation above 1.1800 or a temporary reversal to sweep liquidity from the lower zones. Momentum favors bulls, but chasing highs without confirmation is risky. Focus on clean retracements and volume-supported entries.
💬 If EUR/USD drops back into the 1.1600 zone, will you load up for another leg higher — or wait for confirmation of trend strength? Share your view in the comments!
EURUSD - Macro Trend Shift Soon?Hello TradingView Family / Fellow Traders. This is Richard, also known as theSignalyst.
📈From a macro perspective, EURUSD has been bearish trading within the falling red channel.
Medium-term, EURUSD has been in a correction phase trading within the rising channel in orange.
Moreover, the green zone is a massive monthly resistance.
🏹 Thus, the highlighted red circle is a strong area to look for sell setups as it is the intersection of the upper red and orange trendlines and resistance.
📚 As per my trading style:
As #EURUSD is around the red circle zone, I will be looking for bearish reversal setups (like a double top pattern, trendline break , and so on...)
📚 Always follow your trading plan regarding entry, risk management, and trade management.
Good luck!
All Strategies Are Good; If Managed Properly!
~Rich
Disclosure: I am part of Trade Nation's Influencer program and receive a monthly fee for using their TradingView charts in my analysis.

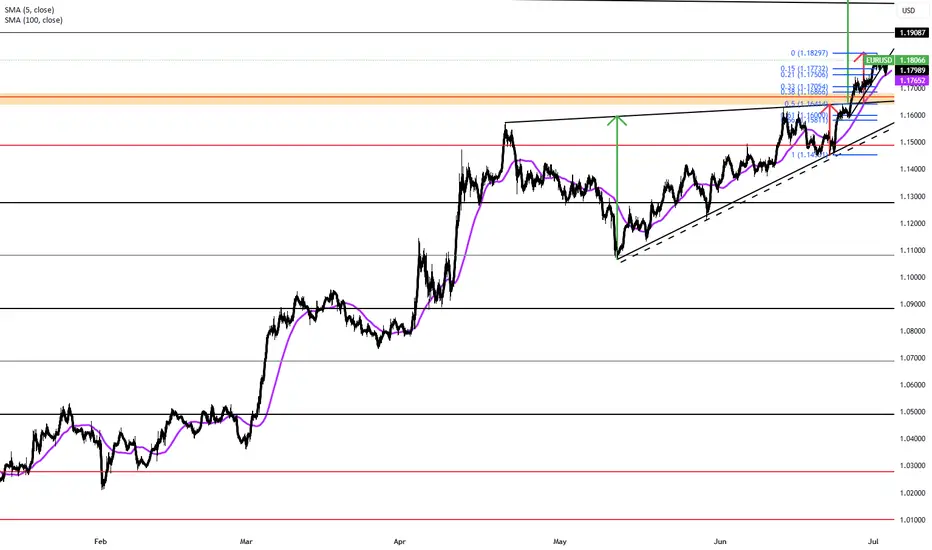
EURUSD BULISH OR BEARISH DETAILED ANALYSISEURUSD has been playing out exactly as forecasted, now trading confidently above the key 1.17 handle. Price action has respected prior structure levels perfectly, with the recent bullish impulse forming clean higher highs and higher lows. After a minor corrective move and successful retest of the previous breakout zone, we’re now seeing continuation momentum build toward the 1.21 target. This pattern is a textbook bullish flag followed by a clean breakout and retest, confirming the strength behind this current upside leg.
Fundamentally, the euro has gained strength due to growing divergence between the ECB and the Fed. With inflation in the Eurozone stabilizing and recent data indicating a modest recovery in manufacturing and services PMI, there's increasing speculation the ECB may hold rates longer, while the Fed is seen leaning toward eventual rate cuts as US labor data softens. The June NFP miss and downward revisions in prior data have weakened the USD’s position, creating a favorable environment for EURUSD bulls.
The technical confluence with macro fundamentals is striking. Risk sentiment is improving across global markets as inflation fears ease and rate clarity emerges. The euro remains supported by strong capital inflows and demand for yield stability. Additionally, EURUSD has cleared multi-month resistance zones with conviction, signaling institutional interest and momentum-based positioning. The recent candle formations suggest buyers are in firm control.
We remain on track for the 1.21 level, which aligns with prior swing highs and a key Fibonacci extension target. Any pullback toward the 1.16–1.1650 region should be viewed as a high-probability buying opportunity. With the DXY under pressure and euro zone resilience improving, EURUSD continues to be one of the top-performing major pairs heading into Q3. Stay patient and ride the wave—this move has more room to run.

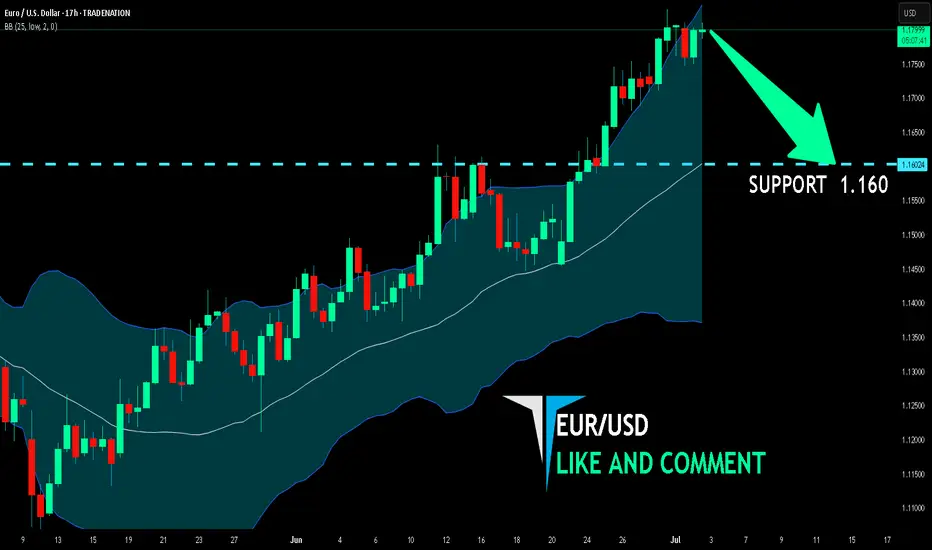
EUR/USD BEST PLACE TO SELL FROM|SHORT
Hello, Friends!
EUR/USD pair is trading in a local downtrend which know by looking at the previous 1W candle which is red. On the 17H timeframe the pair is going up. The pair is overbought because the price is close to the upper band of the BB indicator. So we are looking to sell the pair with the upper BB line acting as resistance. The next target is 1.160 area.
Disclosure: I am part of Trade Nation's Influencer program and receive a monthly fee for using their TradingView charts in my analysis.
✅LIKE AND COMMENT MY IDEAS✅
EUR/USD Steady Near 1.1800 as Fed Cut Bets RiseEUR/USD held steady for a second session near 1.1800 in early Thursday trading. The pair could gain momentum as the US dollar weakens on rising expectations of a Fed rate cut after ADP data disappointed.
June’s ADP Employment Change showed a surprise 33,000 drop, its first decline in over two years, well below forecasts of 95,000. May’s figure was also revised down to a 29,000 gain.
Attention now turns to the upcoming US Nonfarm Payrolls, Average Hourly Earnings, ISM Services PMI, and S&P Global US PMI.
Key levels: Resistance at 1.1830; support at 1.1730.
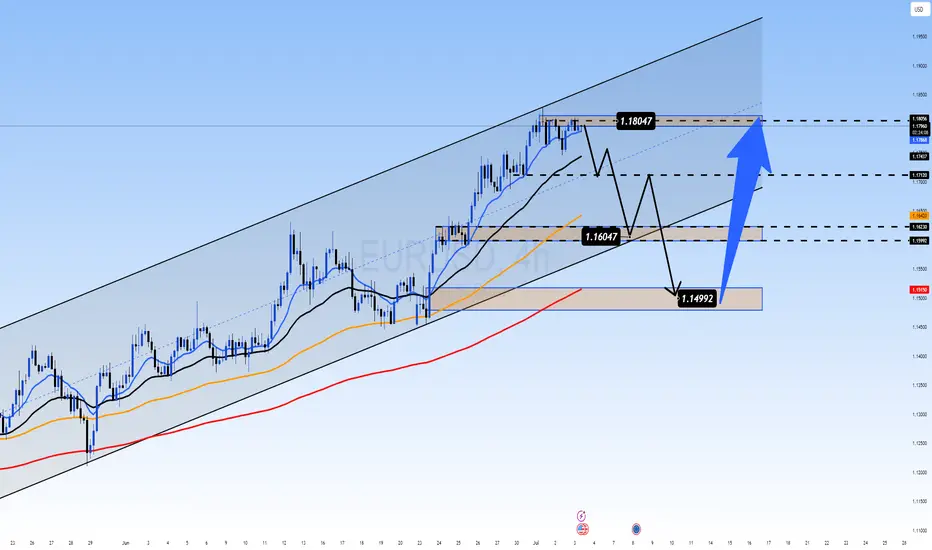
Golden Opportunity with EURUSDEURUSD is maintaining a strong bullish structure, with a key support zone around 1.16600. Currently, the price is consolidating just below the 1.18100 resistance and may experience a short-term pullback before continuing higher.
Bullish Supporting Factors:
– The US dollar is weakening amid expectations that the Fed will act cautiously ahead of the upcoming jobs report.
– Eurozone PMI has shown signs of recovery, lending further strength to the euro.
Suggested Strategy:
Wait for buy opportunities around the 1.16600 – 1.17000 area if bullish reversal signals appear. The target remains 1.18100 and potentially higher if upward momentum continues.

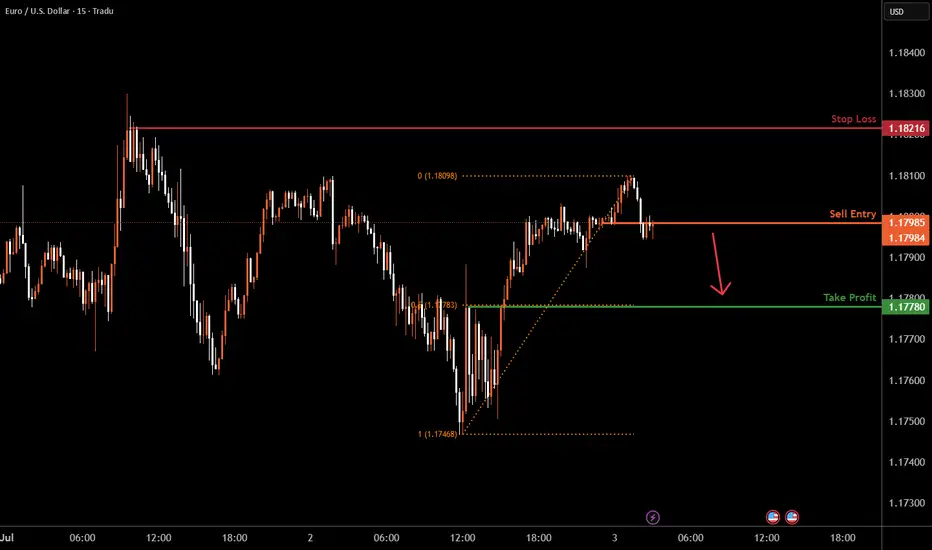
EURUSD M15 I Bearish Fall Based on the M15 chart, the price is testing our sell entry level at1.1798, a pullback resistance.
Our take profit is set at 1.17780 an overlap support that aligns with the 50% Fib retracement.
The stop loss is set at 1.1821, a swing high resistance.
High Risk Investment Warning
Trading Forex/CFDs on margin carries a high level of risk and may not be suitable for all investors. Leverage can work against you.
Stratos Markets Limited (tradu.com ):
CFDs are complex instruments and come with a high risk of losing money rapidly due to leverage. 63% of retail investor accounts lose money when trading CFDs with this provider. You should consider whether you understand how CFDs work and whether you can afford to take the high risk of losing your money.
Stratos Europe Ltd (tradu.com ):
CFDs are complex instruments and come with a high risk of losing money rapidly due to leverage. 63% of retail investor accounts lose money when trading CFDs with this provider. You should consider whether you understand how CFDs work and whether you can afford to take the high risk of losing your money.
Stratos Global LLC (tradu.com ):
Losses can exceed deposits.
Please be advised that the information presented on TradingView is provided to Tradu (‘Company’, ‘we’) by a third-party provider (‘TFA Global Pte Ltd’). Please be reminded that you are solely responsible for the trading decisions on your account. There is a very high degree of risk involved in trading. Any information and/or content is intended entirely for research, educational and informational purposes only and does not constitute investment or consultation advice or investment strategy. The information is not tailored to the investment needs of any specific person and therefore does not involve a consideration of any of the investment objectives, financial situation or needs of any viewer that may receive it. Kindly also note that past performance is not a reliable indicator of future results. Actual results may differ materially from those anticipated in forward-looking or past performance statements. We assume no liability as to the accuracy or completeness of any of the information and/or content provided herein and the Company cannot be held responsible for any omission, mistake nor for any loss or damage including without limitation to any loss of profit which may arise from reliance on any information supplied by TFA Global Pte Ltd.
The speaker(s) is neither an employee, agent nor representative of Tradu and is therefore acting independently. The opinions given are their own, constitute general market commentary, and do not constitute the opinion or advice of Tradu or any form of personal or investment advice. Tradu neither endorses nor guarantees offerings of third-party speakers, nor is Tradu responsible for the content, veracity or opinions of third-party speakers, presenters or participants.
EURUSD: Uptrend Targeting 1.18600EURUSD is maintaining a solid bullish structure after breaking above the 1.17300 zone. The pair is currently consolidating around 1.1800 and may see a minor pullback before pushing toward the 1.18600 target.
The main support comes from a weaker USD following Fed Chair Powell’s “patient” remarks, along with strong PMI data from the EU. EURUSD has now posted 10 consecutive days of gains, signaling strong upward momentum.
As long as price holds above the FVG zone near 1.1780, the bullish trend remains intact, with 1.18600 as the next potential upside target.

EurUsd - This is the deadly breakout!EurUsd - FX:EURUSD - is about to fly:
(click chart above to see the in depth analysis👆🏻)
EurUsd has been rallying about +15% over the past couple of months. Additionally the breakout at the current resistance trendline is about to be confirmed. Subsequently EurUsd is setting up for another major move higher, which will be painful for all European traders.
Levels to watch: $1.23, $1.11
Keep your long term vision🙏🙏
Philip (BasicTrading)

EUR/USD Wave 5 Topped? Correction Incoming to 1.076FX_IDC:EURUSD PEPPERSTONE:EURUSD OANDA:EURUSD
📈 Chart Breakdown
🔢 Elliott Impulse Wave Completed:
Waves (1) to (5) appear to form a clean 5-wave impulse structure upward.
Final wave (5) is diverging on the oscillator (RSI), signaling potential bullish exhaustion.
🧾 ABC Correction Expected:
After the 5-wave impulse, you project an ABC corrective move:
Wave A: initial drop
Wave B: partial recovery
Wave C: deeper move likely toward the 1.07680 support (blue horizontal line)
⚠️ Bearish RSI Divergence:
The label "Div" confirms bearish divergence between price and RSI → typical at end of Wave (5).
🧠 Summary:
Structure: 5-wave impulse + projected 3-wave correction
Bias: Short-term bearish targeting 1.07680
Confirmation: Look for break below support or trendline + momentum shift

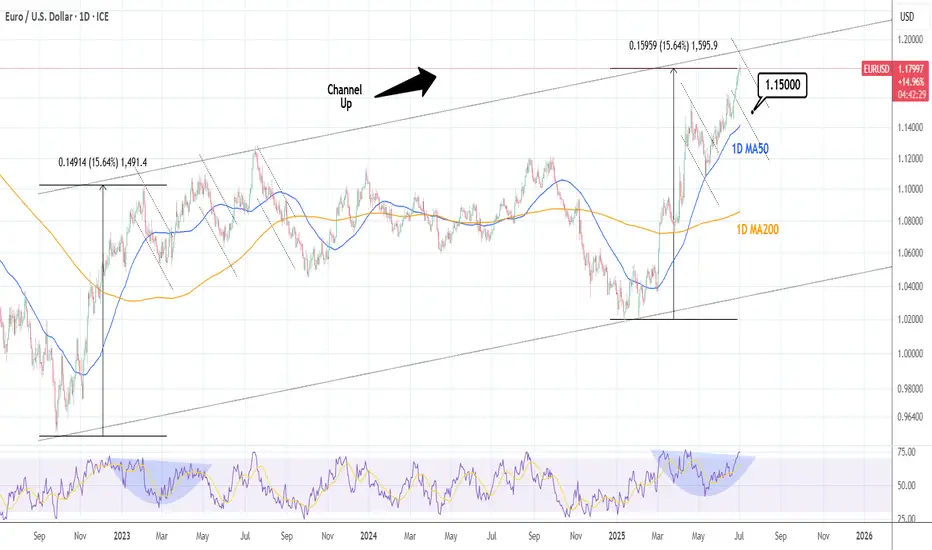
EURUSD: Correction to 1D MA50 possible.EURUSD is vastly overbought on its 1D technical outlook (RSI = 74.017, MACD = 0.011, ADX = 27.363) having completed a +15.64% rise from the February 3rd 2025 Low. That was a technical HL bottom on the 3 year Channel Up and the same amount of price increase was seen on its first bullish wave. When it peaked it made three successive highs over a 6 month period (Feb-July 2023) before starting a long term bearish sentiment creation. For now, we can expect at least a 1D MA50 test on the short-term (TP = 1.15000).
## If you like our free content follow our profile to get more daily ideas. ##
## Comments and likes are greatly appreciated. ##
EURUSD: The Market Is Looking Down! Short!
My dear friends,
Today we will analyse EURUSD together☺️
The recent price action suggests a shift in mid-term momentum. A break below the current local range around 1.17808 will confirm the new direction downwards with the target being the next key level of 1.17671.and a reconvened placement of a stop-loss beyond the range.
❤️Sending you lots of Love and Hugs❤️

EURUSD Expected Growth! BUY!
My dear followers,
This is my opinion on the EURUSD next move:
The asset is approaching an important pivot point 1.1774
Bias -Bullish
Technical Indicators: Supper Trend generates a clear long signal while Pivot Point HL is currently determining the overall Bullish trend of the market.
Goal - 1.1792
About Used Indicators:
For more efficient signals, super-trend is used in combination with other indicators like Pivot Points.
Disclosure: I am part of Trade Nation's Influencer program and receive a monthly fee for using their TradingView charts in my analysis.
———————————
WISH YOU ALL LUCK

EURUSD 30Min Engaged ( Bearish Entry Detected )➕ Objective: Precision Volume Execution
Time Frame: 30-Minute Warfare
Entry Protocol: Only after volume-verified breakout
🩸 Bearish Wave Coming From : 1.17750
➗ Hanzo Protocol: Volume-Tiered Entry Authority
➕ Zone Activated: Dynamic market pressure detected.
The level isn’t just price — it’s a memory of where they moved size.
Volume is rising beneath the surface — not noise, but preparation.
🔥 Tactical Note:
We wait for the energy signature — when volume betrays intention.
The trap gets set. The weak follow. We execute.
EURUSD 30Min Engaged ( Bullish Entry Detected )

EURUSD Will Go Down From Resistance! Short!
Please, check our technical outlook for EURUSD.
Time Frame: 1h
Current Trend: Bearish
Sentiment: Overbought (based on 7-period RSI)
Forecast: Bearish
The market is approaching a key horizontal level 1.177.
Considering the today's price action, probabilities will be high to see a movement to 1.171.
P.S
We determine oversold/overbought condition with RSI indicator.
When it drops below 30 - the market is considered to be oversold.
When it bounces above 70 - the market is considered to be overbought.
Disclosure: I am part of Trade Nation's Influencer program and receive a monthly fee for using their TradingView charts in my analysis.
Like and subscribe and comment my ideas if you enjoy them!
Euro H4 | Falling toward a pullback supportThe Euro (EUR/USD) is falling towards a pullback support and could potentially bounce off this level to climb higher.
Buy entry is at 1.1744 which is a pullback support that aligns with the 23.6% Fibonacci retracement.
Stop loss is at 1.1660 which is a level that lies underneath a swing-low support and the 38.2% Fibonacci retracement.
Take profit is at 1.1829 which is a swing-high resistance.
High Risk Investment Warning
Trading Forex/CFDs on margin carries a high level of risk and may not be suitable for all investors. Leverage can work against you.
Stratos Markets Limited (tradu.com ):
CFDs are complex instruments and come with a high risk of losing money rapidly due to leverage. 63% of retail investor accounts lose money when trading CFDs with this provider. You should consider whether you understand how CFDs work and whether you can afford to take the high risk of losing your money.
Stratos Europe Ltd (tradu.com ):
CFDs are complex instruments and come with a high risk of losing money rapidly due to leverage. 63% of retail investor accounts lose money when trading CFDs with this provider. You should consider whether you understand how CFDs work and whether you can afford to take the high risk of losing your money.
Stratos Global LLC (tradu.com ):
Losses can exceed deposits.
Please be advised that the information presented on TradingView is provided to Tradu (‘Company’, ‘we’) by a third-party provider (‘TFA Global Pte Ltd’). Please be reminded that you are solely responsible for the trading decisions on your account. There is a very high degree of risk involved in trading. Any information and/or content is intended entirely for research, educational and informational purposes only and does not constitute investment or consultation advice or investment strategy. The information is not tailored to the investment needs of any specific person and therefore does not involve a consideration of any of the investment objectives, financial situation or needs of any viewer that may receive it. Kindly also note that past performance is not a reliable indicator of future results. Actual results may differ materially from those anticipated in forward-looking or past performance statements. We assume no liability as to the accuracy or completeness of any of the information and/or content provided herein and the Company cannot be held responsible for any omission, mistake nor for any loss or damage including without limitation to any loss of profit which may arise from reliance on any information supplied by TFA Global Pte Ltd.
The speaker(s) is neither an employee, agent nor representative of Tradu and is therefore acting independently. The opinions given are their own, constitute general market commentary, and do not constitute the opinion or advice of Tradu or any form of personal or investment advice. Tradu neither endorses nor guarantees offerings of third-party speakers, nor is Tradu responsible for the content, veracity or opinions of third-party speakers, presenters or participants.

Hellena | EUR/USD (4H): LONG to the resistance area 1.18466.Dear colleagues, I believe that the upward movement continues. The five-wave impulse is not over yet, and I see that the price is now in the upward wave “3” of the higher order and in the upward wave “3” of the lower order.
Therefore, I expect a small correction to the 1.16165 area, after which I expect the price to reach at least the 1.18466 resistance area.
Manage your capital correctly and competently! Only enter trades based on reliable patterns!

EURUSD SELL TRADEOpportunity to sell on EURUSD
Entry: 1.18000
Stop loss: 1.18200
Take profit 📈 1.17400
Comment your opinion
For fund management. Contact me on X @shajudeakinoba1
