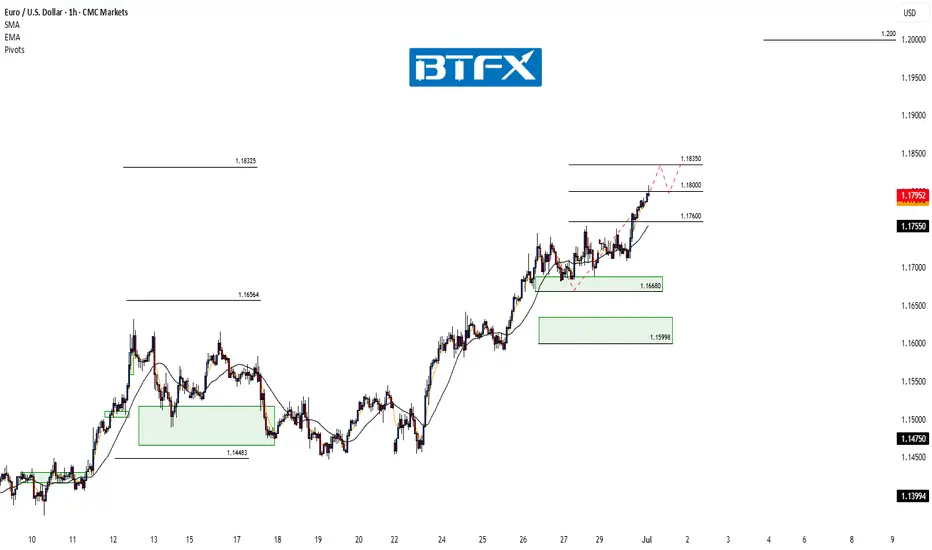
EURUSD is in a strong uptrendEURUSD is in a strong uptrend, Price just broke the resistance zone of 1.175.
All the bullish momentum is heading towards the resistance zone of 1.188.
If there is a close of the h4 candle below the resistance zone of 1.175, there will likely be a Pullback to 1.163 to find more buying momentum towards the target at the resistance zone of 1.188
📈 Key Levels
Support: 1.175-1.163
Resistance: 1.188
📊 Recommended Trade Setups
BUY EURUSD 1.175-1.173 Stoploss 1.170
BUY EURUSD 1.163-1.161 Stoploss 1.158
SELL EURUSD 1.188-1.190 Stoploss 1.1930
Eurusd-4
SUI/USDT Short Setup (2025-07-25)SUI/USDT Short setup for day traders.
Please enter with confirmation in 5M time frame.
⚠️ This Analysis will be updated ...
👤 Sadegh Ahmadi: GPTradersHub
📅 2025.Jul.2
⚠️(DYOR)
❤️ If you apperciate my work , Please like and comment , It Keeps me motivated to do better

Sintra Signals: Central Banks Stay Cautious The ECB Forum in Sintra brought together the heads of the world’s most influential central banks—Lagarde (ECB), Powell (Fed), Bailey (BOE), Ueda (BOJ), and Rhee (BOK).
Across the board, central banks are remaining cautious and data-driven, with no firm commitments on timing for rate changes.
Fed Chair Powell said the U.S. economy is strong, with inflation manageable despite expected summer upticks. He noted tariffs have delayed potential rate cuts and confirmed the Fed is proceeding meeting by meeting.
BOE’s Bailey highlighted signs of softening in the UK economy and said policy remains restrictive but will ease over time. He sees the path of rates continuing downward.
BOJ’s Ueda noted headline inflation is above 2%. Any hikes will depend on underlying core inflation which remains below target.

Bullish bounce off pullback support?EUR/USD is falling towards the support level which is a pullback support that aligns with the 38.2% and the 61.8% Fibonacci retracement and could bounce from this level to our take profit.
Entry: 1.1742
Why we like it:
There is a pullback support level that lines up with the 38.2% and the 61.8% Fibonacci retracement.
Stop loss: 1.1698
Why we like it:
There is a pullback support that is slightly below the 50% Fibonacci retracement.
Take profit: 1.1814
Why we like it:
There is a pullback resistance.
Enjoying your TradingView experience? Review us!
Please be advised that the information presented on TradingView is provided to Vantage (‘Vantage Global Limited’, ‘we’) by a third-party provider (‘Everest Fortune Group’). Please be reminded that you are solely responsible for the trading decisions on your account. There is a very high degree of risk involved in trading. Any information and/or content is intended entirely for research, educational and informational purposes only and does not constitute investment or consultation advice or investment strategy. The information is not tailored to the investment needs of any specific person and therefore does not involve a consideration of any of the investment objectives, financial situation or needs of any viewer that may receive it. Kindly also note that past performance is not a reliable indicator of future results. Actual results may differ materially from those anticipated in forward-looking or past performance statements. We assume no liability as to the accuracy or completeness of any of the information and/or content provided herein and the Company cannot be held responsible for any omission, mistake nor for any loss or damage including without limitation to any loss of profit which may arise from reliance on any information supplied by Everest Fortune Group.

EURO - Price can start to decline from resistance line of wedgeHi guys, this is my overview for EURUSD, feel free to check it and write your feedback in comments👊
Some days ago price grew to $1.1500 level and even broke it, after which started to decline in wedge.
Price declined to support line, breaking two levels, after which it turned around and started to move up.
Soon, EUR broke $1.1215 level and then rose more, after which made a correction to support line.
Then price in a short time rose to $1.1500 level, broke it one more time, and tried to grow more, but failed.
But recently it turned around and quickly rose to resistance line of wedge and now trades near.
In my mind, Euro can bounce from resistance line and fall to $1.1520 support line of wedge pattern.
If this post is useful to you, you can support me with like/boost and advice in comments❤️
Disclaimer: As part of ThinkMarkets’ Influencer Program, I am sponsored to share and publish their charts in my analysis.

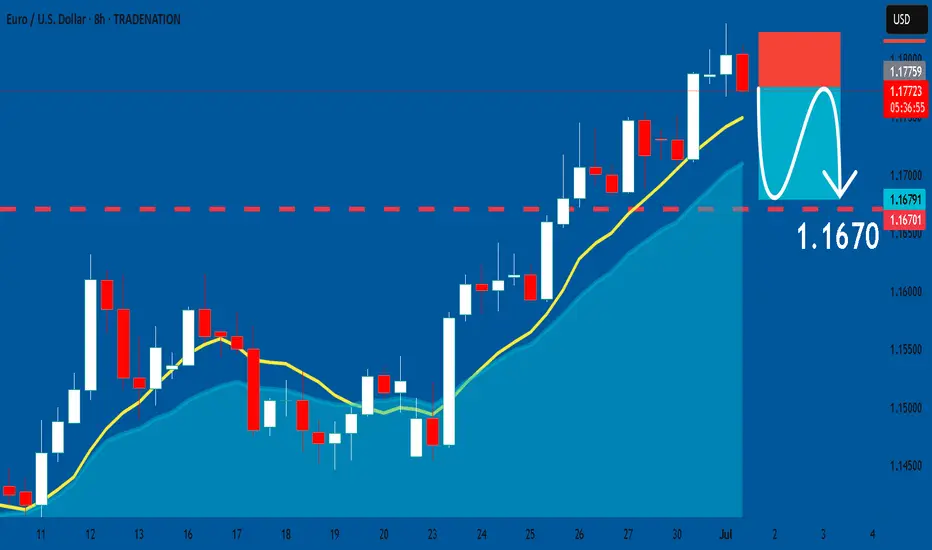
EURUSD: Short Signal Explained
EURUSD
- Classic bearish setup
- Our team expects bearish continuation
SUGGESTED TRADE:
Swing Trade
Short EURUSD
Entry Point - 1.1775
Stop Loss - 1.1822
Take Profit - 1.1670
Our Risk - 1%
Start protection of your profits from lower levels
Disclosure: I am part of Trade Nation's Influencer program and receive a monthly fee for using their TradingView charts in my analysis.
❤️ Please, support our work with like & comment! ❤️
Gold Bounces from Demand Zone – Next Targets in Sight!By analyzing the gold chart on the 4-hour timeframe, we can see that today, price once again dipped into our key demand zone (Bullish Rejection Block) between $3245 and $3262, where it faced strong buying pressure and rallied up to $3296.
Currently, gold is trading around $3281, and as long as price holds above $3273, we expect further upside. The next potential targets are $3294, $3300, and $3309.
🎥 If you enjoyed this video analysis and found it helpful, please show your support with a LIKE and COMMENT below!
These video-style breakdowns take time and effort, and I’ll only continue them with your support 🙌
Your engagement is my biggest motivation to keep going 💛
Thanks for being part of the journey!

EUR/JPY Potential Bullish ContinuationEUR/JPY Potential Bullish Continuation 📈🔍
📊 Technical Overview:
The EUR/JPY chart presents a bullish channel structure, indicating an overall upward trend. Price action respected the channel boundaries with multiple confirmations before the latest bearish correction.
🔹 Structure Highlights:
🔵 Ascending Channel: Price moved steadily within an upward-sloping channel.
🟠 Support Rebound: A strong bullish candle formed on June 20th after touching the lower boundary — a clear support confirmation.
🔴 Recent Rejection: On July 1st, price tested the upper channel resistance and faced rejection, forming a bearish engulfing candle.
🟫 Support Zone Marked: Around the 167.800 level, this zone has been tested multiple times, indicating a possible demand area.
🔁 Current Scenario:
The pair has broken down from the internal trendline (light brown line) and is heading toward the support zone. A bullish bounce from this area may lead to a rally toward the Target Point at ~172.000 🎯.
📌 Key Levels:
Support Zone: 167.600 – 168.000
Resistance Zone: 170.500 – 172.000
Current Price: 168.994
📈 Outlook:
If support holds and bullish momentum returns, there's potential for a move toward the target area at the top of the channel. However, a break below the support zone could invalidate the bullish scenario and suggest a deeper correction.
🧠 Conclusion:
Wait for bullish confirmation near support before considering long positions. A clean break and retest of the support zone could signal a continuation of the upward trend.

EURUSD: Target Is Up! Long!
My dear friends,
Today we will analyse EURUSD together☺️
The recent price action suggests a shift in mid-term momentum. A break above the current local range around 1.18033 will confirm the new direction upwards with the target being the next key level of 1.18161 and a reconvened placement of a stop-loss beyond the range.
❤️Sending you lots of Love and Hugs❤️

EURUSD analysis - 1H FVG and OB SetupsEUR/USD is in a strong bullish move right now.
We are waiting patiently for the price to reach our marked green (OB) and blue (FVG) zones before looking for clean buy opportunities. Always remember to let price tap into our key areas so we can enter on lower timeframes for precise, low-risk entries.
The first resistance ahead is around 1.2100, which will be our immediate target if the bullish momentum continues.
Stay patient, let the price come to your zones, and execute with discipline.
—
📊 ProfitaminFX | Gold, BTC & EUR/USD
📚 Daily setups & educational trades
📱 IG: @profitamin.f

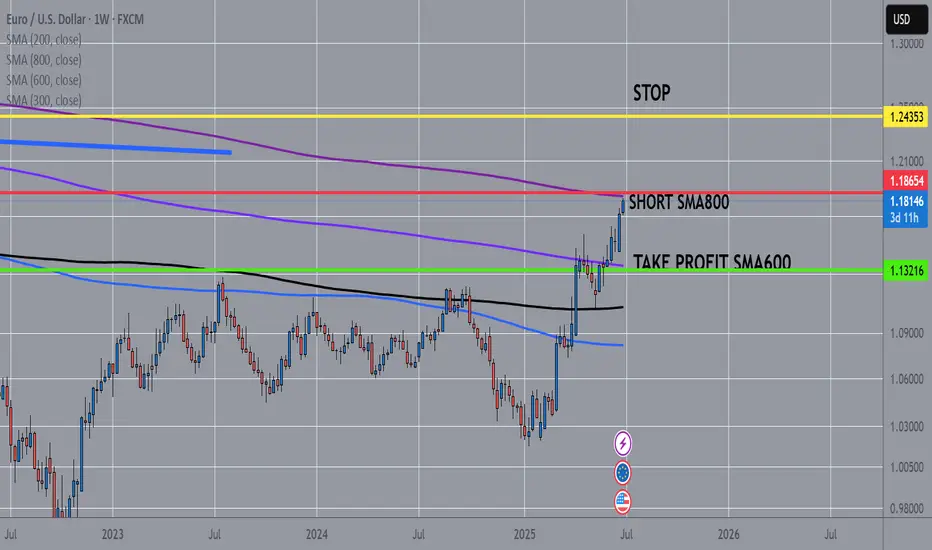
EURUSD Major event Short Weekly ChartWe may be on the verge of a major event in the forex market.
The EUR/USD is approaching its 800-week moving average, a level that historically marks significant turning points.
A sharp reversal is likely, with an initial target at the 600-week moving average, and potentially a much deeper decline beyond that.
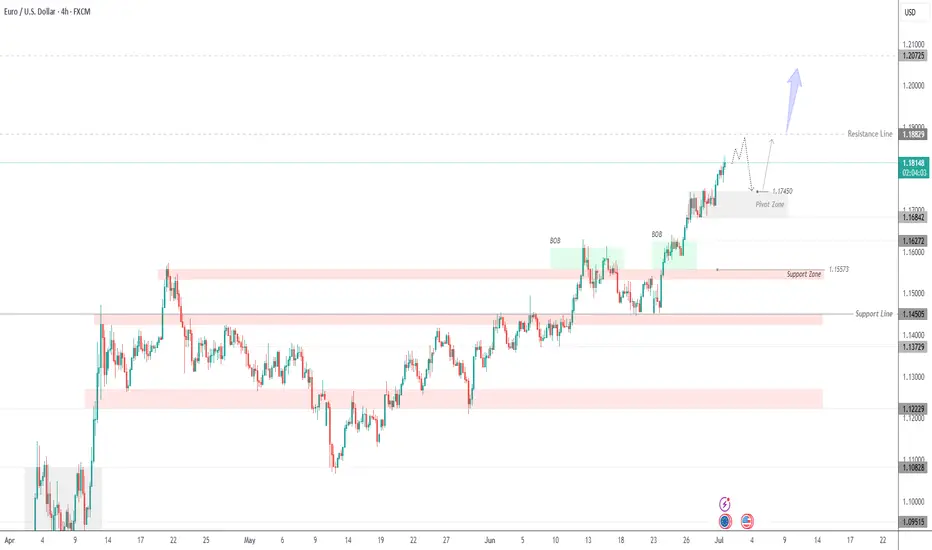
Euro Continues Bullish Trend | Eyes on 1.1882 & 1.2075EUR/USD – Strong Bullish Structure | Watching 1.1745 Pivot Zone for Reentry
The Euro continues to trade in a well-defined bullish trend, supported by institutional demand and clear price structure.
After breaking above the 1.1684 resistance zone, EUR/USD extended toward 1.1818 and now approaches the next resistance at 1.1882. This level may act as a temporary cap, but if breached with momentum, the pair could target the 1.2075 zone next.
Bullish Order Blocks (BOBs) marked on the chart highlight previous accumulation zones where buyers stepped in aggressively. These areas are still valid for demand-based pullbacks.
Key Area to Watch – 1.1745 Pivot Zone:
This level serves as a potential reentry point if the price retraces. As long as EUR/USD holds above this zone, bullish momentum remains intact. A confirmed bounce here could resume the uptrend toward 1.1882 and beyond.
However, a clean break below 1.1745 could open the door for a deeper correction toward 1.1627 or even 1.1557, which is the next major support zone.
Key Levels:
Resistance: 1.1882, 1.2075
Pivot Zone: 1.1745
Support: 1.1627, 1.1557
EURUSD Bullish continuation supported at 1.1640The EURUSD currency pair continues to exhibit a bullish price action bias, supported by a sustained rising trend. Recent intraday movement reflects a sideways consolidation breakout, suggesting potential continuation of the broader uptrend.
Key Technical Level: 1.1640
This level marks the prior consolidation range and now acts as pivotal support. A corrective pullback toward 1.1640 followed by a bullish rejection would reinforce the bullish trend, targeting the next resistance levels at:
1.1830 – Near-term resistance
1.1900 – Minor swing high
1.1940 – Longer-term bullish objective
On the other hand, a decisive daily close below 1.1640 would invalidate the bullish setup, shifting the outlook to bearish in the short term. This could trigger a deeper retracement toward:
1.1590 – Initial support
1.1530 – Key downside target
Conclusion:
As long as 1.1640 holds as support, the technical outlook remains bullish, favoring long positions on dips. A confirmed break below this level would signal a shift in sentiment and open the door to a corrective pullback phase.
This communication is for informational purposes only and should not be viewed as any form of recommendation as to a particular course of action or as investment advice. It is not intended as an offer or solicitation for the purchase or sale of any financial instrument or as an official confirmation of any transaction. Opinions, estimates and assumptions expressed herein are made as of the date of this communication and are subject to change without notice. This communication has been prepared based upon information, including market prices, data and other information, believed to be reliable; however, Trade Nation does not warrant its completeness or accuracy. All market prices and market data contained in or attached to this communication are indicative and subject to change without notice.

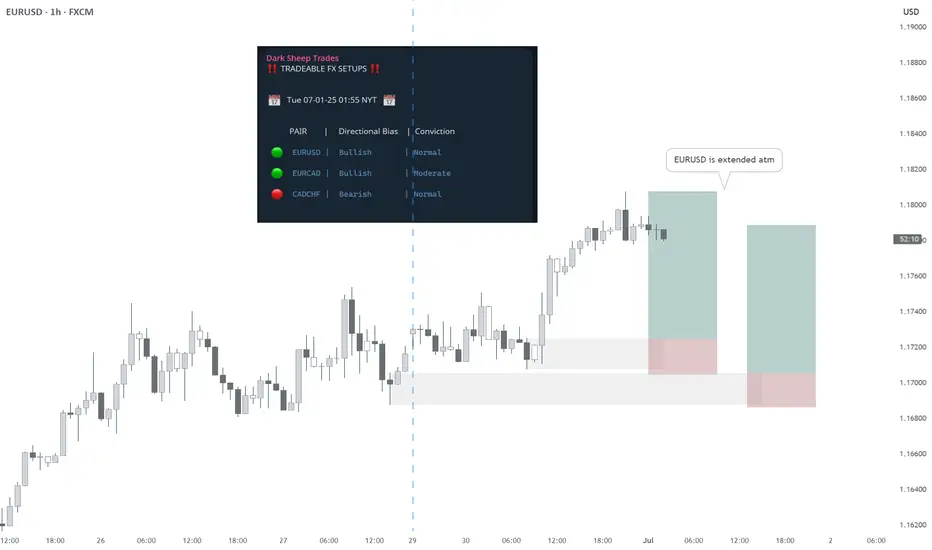
EURUSD BUY - Statistically-backed FX shortlistEURUSD BUY
Daily Outlook: Statistically-backed FX shortlist
@darksheeptrades
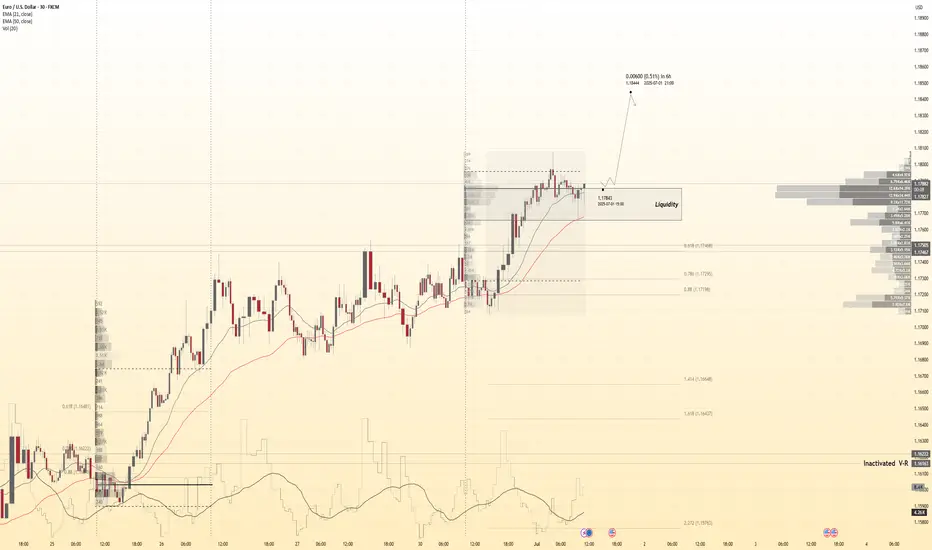
EURUSD 30Min Engaged ( Bullish Entry Detected )➕ Objective: Precision Volume Execution
Time Frame: 30-Minute Warfare
Entry Protocol: Only after volume-verified breakout
🩸 Bullish Wave Coming From : 1.17850
➗ Hanzo Protocol: Volume-Tiered Entry Authority
➕ Zone Activated: Dynamic market pressure detected.
The level isn’t just price — it’s a memory of where they moved size.
Volume is rising beneath the surface — not noise, but preparation.
🔥 Tactical Note:
We wait for the energy signature — when volume betrays intention.
The trap gets set. The weak follow. We execute.
EURUSD 30Min Engaged ( Bullish Entry Detected )
Fundamental Market Analysis for July 1, 2025 EURUSDEvent to pay attention to today:
01.07 16:30 EET. USD - Federal Reserve Chairman Jerome Powell Speaks
01.07 16:30 EET. EUR - ECB President Christine Lagarde Speaks
01.07 17:00 EET. USD - ISM Manufacturing PMI
EUR/USD is trading in negative territory near 1.1790 in the early European session on Tuesday. The US dollar (USD) is weakening against the euro (EUR) amid growing budget concerns and uncertainty surrounding trade deals.
Four people familiar with the negotiations said US President Donald Trump's administration is seeking to phase in deals with the most involved countries as they rush to reach an agreement by the July 9 deadline. Uncertainty over trade agreements continued to weigh on sentiment and sell the US dollar.
Investors are concerned about the US Senate's attempts to pass Trump's tax and spending cuts bill, which faces intra-party disagreement over a projected $3.3 trillion increase in the national debt. Fiscal concerns have dampened optimism and contributed to the decline in the US dollar. This, in turn, serves as a tailwind for the major pair.
German inflation, as measured by the Harmonized Index of Consumer Prices (HICP), eased to 2.0% y/y in June from 2.1% in the previous reading. The figure was below expectations of 2.2%.
On a month-on-month basis, HICP rose 0.1% in June vs. 0.2% previously, below the market consensus forecast of 0.3%. Softer-than-expected German inflation data may limit near-term growth.
Trade recommendation: BUY 1.1795, SL 1.1725, TP 1.1880

GBPJPY H4 XABCD Short at Market TP Below Market🔸Hello traders, let's review the 4 hour chart for GBPJPY. Strong gains off the lows recently, however price getting overextended and expecting reversal later at/near PRZ/D.
🔸Speculative XABCD structure defined by point X 199 point A 188 point B 195.20 point C 186.80 point D/PRZ 198.40/80 .
🔸Currently most points validated, point D/PRZ validated as well.
Short sell at market SL over point D/PRZ TP details see chart
🔸Recommended strategy for GJ traders: Short Sell at Market
SL over point D/PRZ TP1 193.30 TP2 191.00 TP3 188.80.
🎁Please hit the like button and
🎁Leave a comment to support our team!
RISK DISCLAIMER:
Trading Futures , Forex, CFDs and Stocks involves a risk of loss.
Please consider carefully if such trading is appropriate for you.
Past performance is not indicative of future results.
Always limit your leverage and use tight stop loss.

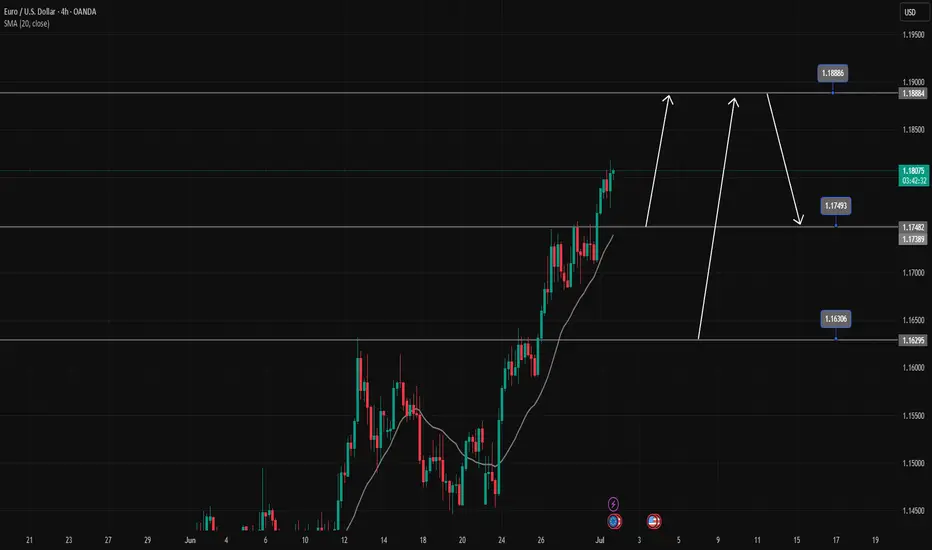
EUR/USD Weekly – Two Long Setups Hello guys!
It is my perspective on eurusd!
Before we even reach the major resistance zone around 1.2050–1.2100, I’ve highlighted two long-term opportunities that may unfold as the price continues to climb.
✔ First Long Position:
It looks like a more conservative entry. The price is already above it. You can set a pending position!
It was likely aiming to catch the momentum as the price broke above the previous structure.
TP is near the descending trendline, around 1.2050–1.2100. a smart place to exit before major resistance hits.
✔ Second Long Position:
Positioned slightly lower. probably in case of a pullback or retest into the broken zone.
This one offers better risk-reward, but requires patience and a cleaner retracement.
Both longs are short-to mid-term swing ideas, aiming to ride the bullish leg into the bigger trendline rejection zone, where I’d personally be more cautious or even look for reversal setups.

BTC - Consolidation, Manipulation & DistributionMarket Context
The current price action unfolds within the broader structure of a bullish leg that began after a sharp reversal near 97,000. This impulsive rally created a clear Fair Value Gap on the 4-hour chart—left behind as price surged upward with minimal resistance. Following this move, the market entered a consolidation phase, forming a range that has now broken to the upside. This kind of breakout often attracts breakout traders, but in this case, the context signals something more calculated.
Buy Side Liquidity Sweep Following Consolidation
The breakout above the consolidation range led directly into a Buy Side Liquidity Sweep, as price ran the highs just above the marked range. These highs acted as a magnet for liquidity—stop losses from short sellers and buy stops from breakout traders were likely pooled in that area. The quick rejection following this sweep suggests the move was not backed by genuine demand, but rather served the purpose of liquidity collection by larger players.
Manipulation and Distribution
This is a textbook example of manipulation into liquidity. Price was engineered to move upward into a zone of interest, taking out the Buy Side Liquidity before sharply reversing. The strong rejection signals distribution—institutions likely offloaded positions into the influx of late buyers. This kind of pattern often precedes a larger markdown, particularly when followed by lower timeframe bearish structure breaks.
Unfilled Fair Value Gap as a Draw
Beneath the price lies an unfilled Fair Value Gap, a zone of imbalance left behind by the earlier impulsive move. These areas often act as magnets for price, especially once liquidity objectives to the upside have been completed. Now that the sweep has occurred and distribution is underway, there is a strong probability that price will begin to seek rebalancing within this Gap. The area between 104,000 and 103,500 stands out as a high-probability target for the next leg down.
Execution Insight
If you're looking to enter short, it may be wise to wait for confirmation on a lower timeframe—such as a bearish break of structure or an internal Gap forming during the retracement. A 5-minute timeframe can often give early signs of rejection or supply stepping in. Being patient and allowing the market to reveal intent is crucial, especially after liquidity-driven moves like this.
Final Thoughts
Price doesn’t move randomly—it seeks liquidity and fills inefficiencies. This chart beautifully illustrates that logic, from engineered consolidation to a manipulative sweep, and now potentially toward rebalancing.
If you found this breakdown helpful, I’d really appreciate a like—it helps support the work and keeps this kind of content going. Let me know in the comments what you think, or if you’re seeing it differently. I'm always up for a good discussion.

Another RR2 Position On EURUSDThesis: EUR/USD is showing signs of exhaustion near the 1.1800 psychological resistance, with price rejecting the upper band of a recent range.
Entry: 🔻 Sell at 1.17883 (current price action confirms rejection)
Stop-Loss: 🔺 1.17943 – Above recent swing high and psychological resistance
Take-Profit: ✅ 1.17767 – Targeting the lower bound of the recent range and prior support
Risk-Reward Ratio: ~1:2 – High conviction setup with tight risk and extended downside potential

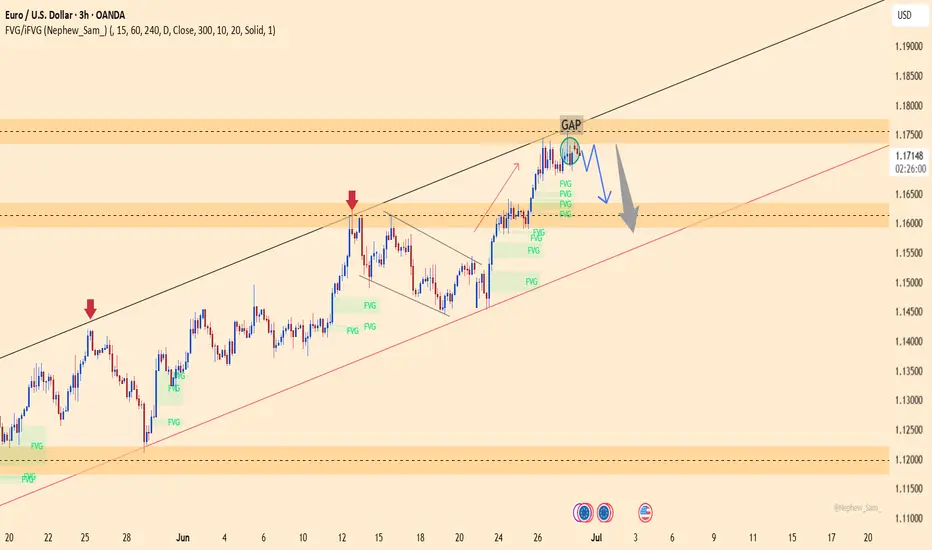
EURUSD – Bearish Pressure IntensifiesEURUSD is currently facing rejection at the GAP resistance area near 1.17350, combined with a lower high structure forming within the ascending channel. Price action shows clear signs of weakness after filling the GAP, and the aligned FVG zones below suggest a potential for deeper downside.
If the price remains capped below 1.17350, there is a high probability of a pullback toward the 1.16300 support area — which aligns with the long-term ascending trendline. A break below this level could extend the bearish move toward the deeper region near 1.14500.
Supporting Fundamentals:
Strong US Core PCE → reinforces expectations that the Fed will keep rates higher for longer.
Weak EU manufacturing PMI → puts pressure on the euro.
FOMC minutes and NFP — if hawkish — could strengthen the USD and weigh further on EURUSD.
EURUSD M15 I Bearish Reversal Based on the M15 chart, the price is approaching our sell entry level at 1.1788, a pullback resistance that aligns with the 38.2% Fib retracement.
Our take profit is set at 1.1753, a pullback support that aligns closely with the 50% Fib retracement.
The stop loss is set at 1.18080 a swing high resistance.
High Risk Investment Warning
Trading Forex/CFDs on margin carries a high level of risk and may not be suitable for all investors. Leverage can work against you.
Stratos Markets Limited (tradu.com ):
CFDs are complex instruments and come with a high risk of losing money rapidly due to leverage. 63% of retail investor accounts lose money when trading CFDs with this provider. You should consider whether you understand how CFDs work and whether you can afford to take the high risk of losing your money.
Stratos Europe Ltd (tradu.com ):
CFDs are complex instruments and come with a high risk of losing money rapidly due to leverage. 63% of retail investor accounts lose money when trading CFDs with this provider. You should consider whether you understand how CFDs work and whether you can afford to take the high risk of losing your money.
Stratos Global LLC (tradu.com ):
Losses can exceed deposits.
Please be advised that the information presented on TradingView is provided to Tradu (‘Company’, ‘we’) by a third-party provider (‘TFA Global Pte Ltd’). Please be reminded that you are solely responsible for the trading decisions on your account. There is a very high degree of risk involved in trading. Any information and/or content is intended entirely for research, educational and informational purposes only and does not constitute investment or consultation advice or investment strategy. The information is not tailored to the investment needs of any specific person and therefore does not involve a consideration of any of the investment objectives, financial situation or needs of any viewer that may receive it. Kindly also note that past performance is not a reliable indicator of future results. Actual results may differ materially from those anticipated in forward-looking or past performance statements. We assume no liability as to the accuracy or completeness of any of the information and/or content provided herein and the Company cannot be held responsible for any omission, mistake nor for any loss or damage including without limitation to any loss of profit which may arise from reliance on any information supplied by TFA Global Pte Ltd.
The speaker(s) is neither an employee, agent nor representative of Tradu and is therefore acting independently. The opinions given are their own, constitute general market commentary, and do not constitute the opinion or advice of Tradu or any form of personal or investment advice. Tradu neither endorses nor guarantees offerings of third-party speakers, nor is Tradu responsible for the content, veracity or opinions of third-party speakers, presenters or participants.

EUR/USD Extends Rally – Watching Resistance at 1.18000Hi Everyone,
We anticipated a retest of the 1.17400 level coming into this week, setting the stage for further upside toward our highlighted targets at 1.17600 and 1.18000. Monday delivered, with a sharp move higher that saw EUR/USD break cleanly above 1.17400 and extend to 1.17600, bringing the 1.18000 level into focus.
As previously noted, we expect dynamic resistance around the 1.18000 area and will provide further updates on the projected path for EUR/USD should price test or breach this level.
The longer-term outlook remains bullish, with expectations for the rally to extend towards the 1.2000 level, provided the price holds above the key support at 1.10649.
We will continue to update you throughout the week with how we’re managing our active ideas and positions. Thanks again for all the likes/boosts, comments and follows — we appreciate the support!
All the best for a good end to the week. Trade safe.
BluetonaFX