EURUSD Is Weaker vs USD. Look For Sells!Welcome back to the Weekly Forex Forecast for the week of July 21-25th.
In this video, we will analyze the following FX market:
EURUSD
Expecting the USD to continue to push higher, which would further drag the EURO down. Look to take advantage of this dynamic and wait for sell setups!
Enjoy!
May profits be upon you.
Leave any questions or comments in the comment section.
I appreciate any feedback from my viewers!
Like and/or subscribe if you want more accurate analysis.
Thank you so much!
Disclaimer:
I do not provide personal investment advice and I am not a qualified licensed investment advisor.
All information found here, including any ideas, opinions, views, predictions, forecasts, commentaries, suggestions, expressed or implied herein, are for informational, entertainment or educational purposes only and should not be construed as personal investment advice. While the information provided is believed to be accurate, it may include errors or inaccuracies.
I will not and cannot be held liable for any actions you take as a result of anything you read here.
Conduct your own due diligence, or consult a licensed financial advisor or broker before making any and all investment decisions. Any investments, trades, speculations, or decisions made on the basis of any information found on this channel, expressed or implied herein, are committed at your own risk, financial or otherwise.
EURUSD

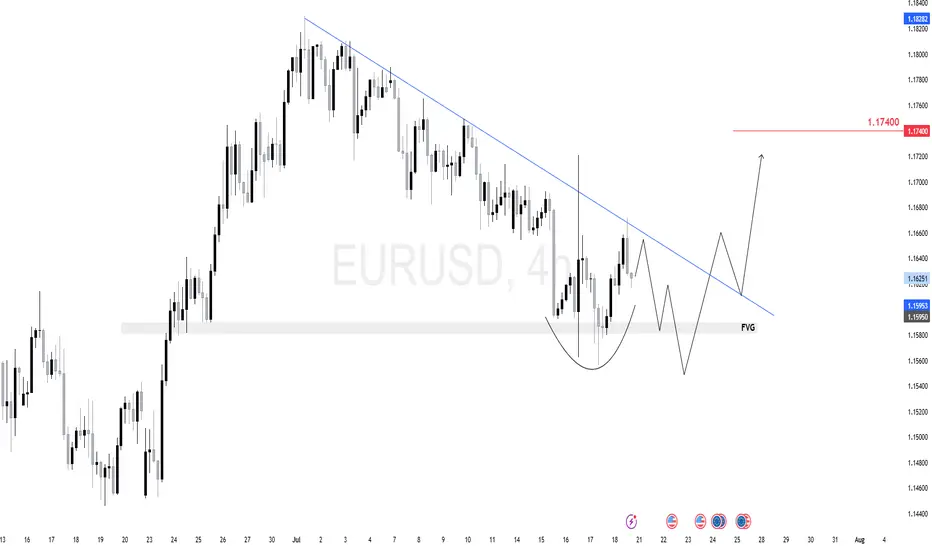
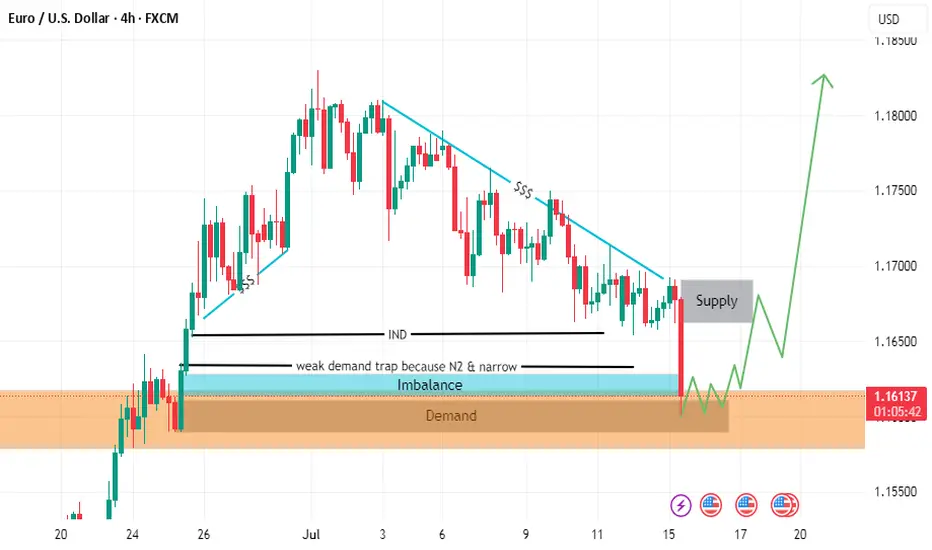
$EU (EURUSD) 4HEURUSD is forming a potential inverse head-and-shoulders just above a 4H fair value gap (FVG).
We expect one more dip toward the 1.1580–1.1595 zone to complete the right shoulder and tap demand.
From there, a breakout above the descending trendline can target 1.1740 next.
The key here is watching the reaction after the FVG test — if buyers step in strong, we ride it up.
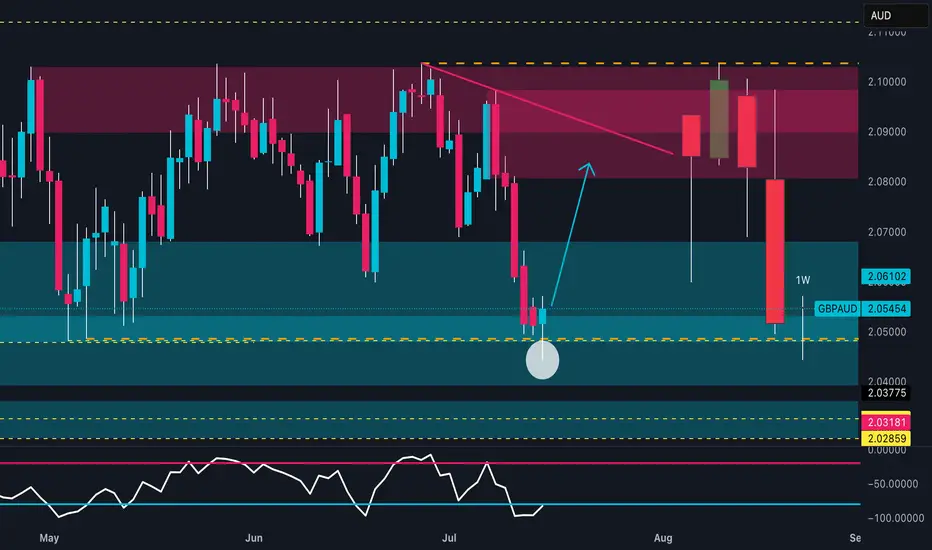
GBPAUD: Weekly Reversal | COT & Seasonality Support Bullish📊 Technical Outlook
Price strongly reacted from a key weekly demand zone between 2.0400 and 2.0500, showing clear absorption of bearish pressure. The RSI is rebounding from the 30 area, signaling early reversal potential.
The next technical target lies between 2.08900 and 2.10000, within a well-defined supply zone.
An early bullish reversal is in progress, with potential for a swing move toward the red zone.
🧠 Commitment of Traders (COT Report – 08/07/2025)
GBP: Non-commercial traders are net long, with positioning growing across the board: +869 longs / -926 shorts. Commercials reduce shorts and increase longs → Bullish bias.
AUD: Non-commercials are clearly short (-2,267 longs / +1,957 shorts). Commercials are increasing long exposure (+2,629), but still in the minority → Bearish bias.
➡️ The COT spread confirms a GBP long vs AUD short bias.
📅 Seasonality (July)
GBP: Historically strong in July, with average monthly gains across all timeframes (especially the 2Y window).
AUD: Less favorable seasonal profile in July; flat to slightly negative across all time horizons.
➡️ Seasonality supports GBP strength.
📉 Retail Sentiment
58% Long / 42% Short on GBPAUD
➡️ Retail traders are still heavily long → a shakeout of weak long hands is possible before the real rally begins.
🎯 Strategic Conclusion
GBP shows bullish convergence across technical, COT, and seasonal factors. AUD presents clear weakness.
The current price zone offers a clean entry point for longs, targeting the 2.08900–2.10000 supply zone.
EURJPY Hits Major Weekly Supply | Is the Bull Run Over?EUR/JPY – Institutional Macro Context (COT)
EUR (Euro)
Non-commercials net longs increased by +16,146 → strong buying.
Commercials added +25,799 long positions.
✅ Bias: Moderately bullish.
JPY (Japanese Yen)
Non-commercials decreased longs by -4,432.
Commercials cut -20,405 long contracts.
❌ Bias: Bearish pressure remains on JPY.
Conclusion (COT): EUR remains fundamentally strong, JPY structurally weak. Institutional flows favor long EUR/JPY, but positioning is stretched.
Seasonality (July)
EURJPY shows strong bullish seasonality in July, especially over the 2Y and 5Y averages (+1.03% and +0.66% respectively).
✅ Seasonality bias: Bullish.
Retail Sentiment
89% of traders are short on EUR/JPY.
Contrarian bias = bullish confirmation.
Technical Analysis (Weekly View)
Price is pushing into a major weekly supply zone around 172.50–173.00.
RSI still elevated but showing signs of weakening momentum.
Potential double top structure forming in confluence with liquidity grab.
First downside target sits around 169.50 (daily demand zone).
Awaiting a reaction in supply and confirmation for short.
Trading Plan (Top-Down)
Wait for price to reject the 172.50–173.00 area
Watch for bearish confirmation on Daily (engulfing or lower high)
Target: 169.50 zone
Risk: tight above 173.20 (invalidating supply zone)

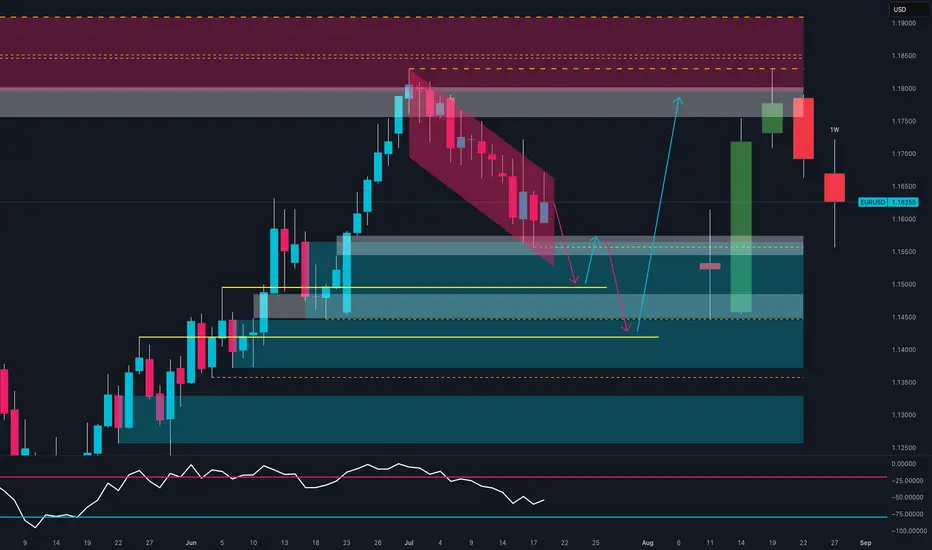
Smart Money Reloading: Will EUR/USD Explode from Demand Zone?📊 Technical Context (Daily)
EUR/USD is currently in a corrective phase following the strong June rebound from the 1.1450 area, which culminated in a high near the 1.1850 supply zone.
The recent bearish move has pushed the pair back into a key demand area between 1.1450 and 1.1550, a zone that has acted as support multiple times in the past.
The latest weekly candle shows a potential bullish exhaustion signal (long lower wick), with the RSI hovering in oversold territory.
📌 Primary scenario: Possible consolidation above 1.1550 followed by a bullish continuation toward 1.1750–1.1800.
📌 Alternative scenario: Break of the recent lows could lead to a deeper retest of the 1.1350 zone.
📈 COT (Commitment of Traders)
Non-commercial positioning shows growing bullish interest in the euro:
EUR: +971 new longs, -6,654 shorts → strong increase in net long exposure.
USD Index: -267 longs, +92 spreads → signs of institutional indecision on the dollar.
This suggests a favorable shift toward the euro by smart money.
💡 Retail Sentiment
Retail traders remain heavily short on EUR/USD (63% short) with an average entry price of 1.1579.
This reinforces the contrarian bullish case, as retail traders are trapped short in a potential reversal zone.
📆 Seasonality
Historically, July has been a bullish month for EUR/USD:
➕ 2Y average return: +0.0287
➕ 5Y average return: +0.0166
This supports a seasonal bullish bias aligning with the current technical setup.
✅ Operational Outlook
EUR/USD is trading at a technically and macroeconomically significant area. The confluence of:
Weekly demand zone being tested
RSI in oversold conditions
COT positioning favoring the euro
Retail sentiment skewed short
Bullish seasonality
…makes a bullish bounce plausible in the coming weeks, with a first target at 1.1750. Invalidation level below 1.1450.
📌 Bias: Moderately Bullish
📍 Technical Activation Zone: Above 1.1550 with confirmed bullish price action
EURUSD is Nearing an Important Support!!Hey Traders, in today's trading session we are monitoring EURUSD for a buying opportunity around 1.15400 zone, EURUSD is trading in an uptrend and currently is in a correction phase is in a correction phase in which it is approaching the trend at 1.15400 support and resistance area.
Trade safe, Joe.

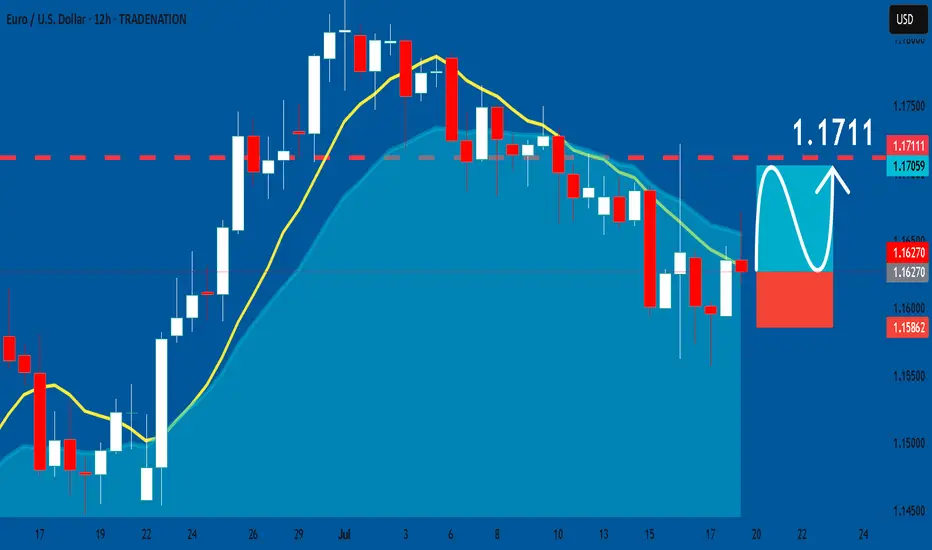
EURUSD: Long Trade with Entry/SL/TP
EURUSD
- Classic bullish setup
- Our team expects bullish continuation
SUGGESTED TRADE:
Swing Trade
Long EURUSD
Entry Point - 1.1627
Stop Loss - 1.1586
Take Profit - 1.1711
Our Risk - 1%
Start protection of your profits from lower levels
Disclosure: I am part of Trade Nation's Influencer program and receive a monthly fee for using their TradingView charts in my analysis.
❤️ Please, support our work with like & comment! ❤️
EURUSD – WEEKLY FORECAST Q3 | W30 | Y25📊 EURUSD – WEEKLY FORECAST
Q3 | W30 | Y25
Weekly Forecast 🔍📅
Here’s a short diagnosis of the current chart setup 🧠📈
Higher time frame order blocks have been identified — these are our patient points of interest 🎯🧭.
It’s crucial to wait for a confirmed break of structure 🧱✅ before forming a directional bias.
This keeps us disciplined and aligned with what price action is truly telling us.
📈 Risk Management Protocols
🔑 Core principles:
Max 1% risk per trade
Only execute at pre-identified levels
Use alerts, not emotion
Stick to your RR plan — minimum 1:2
🧠 You’re not paid for how many trades you take, you’re paid for how well you manage risk.
🧠 Weekly FRGNT Insight
"Trade what the market gives, not what your ego wants."
Stay mechanical. Stay focused. Let the probabilities work.
FRGNT FOREX ANALYSIS 📊


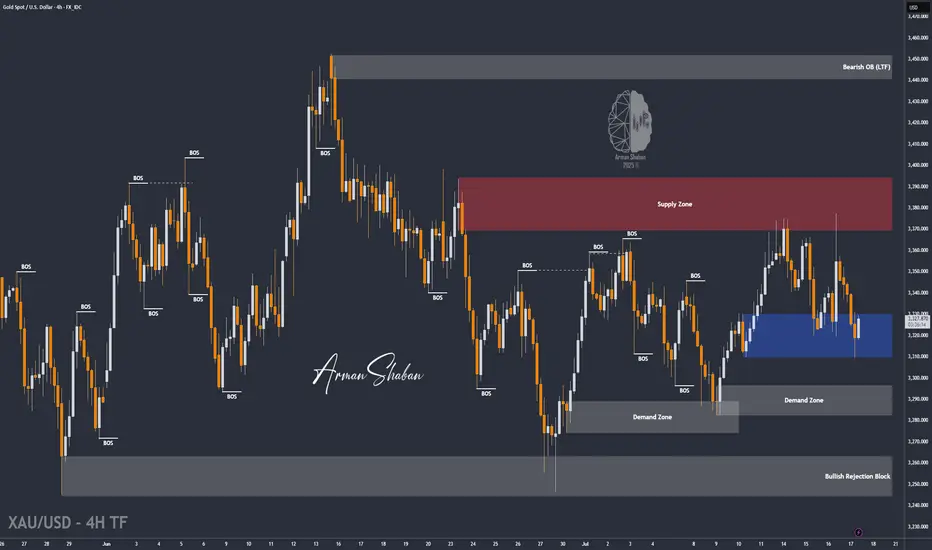
XAU/USD | First LONG to $3345, Then a Potential DROP Below $3300By analyzing the gold chart on the 4-hour timeframe, we can see that last night the price first tapped into the $3340 level, showing an initial push up to $3352. However, the drop intensified soon after, breaking the $3340 resistance and, according to the second scenario, falling to $3310. Upon reaching this key demand level, buying pressure kicked in, pushing the price back up to $3325. Now, the key question is whether gold can hold the $3310 support. If this level holds, we can expect a rise toward $3331 as the first target and $3345 as the second. After this move, a rejection from the $3345 area could trigger another drop, possibly pushing gold below $3300. So, first LONG, then SHORT!
THE LATEST VIDEO ANALYSIS :
Please support me with your likes and comments to motivate me to share more analysis with you and share your opinion about the possible trend of this chart with me !
Best Regards , Arman Shaban
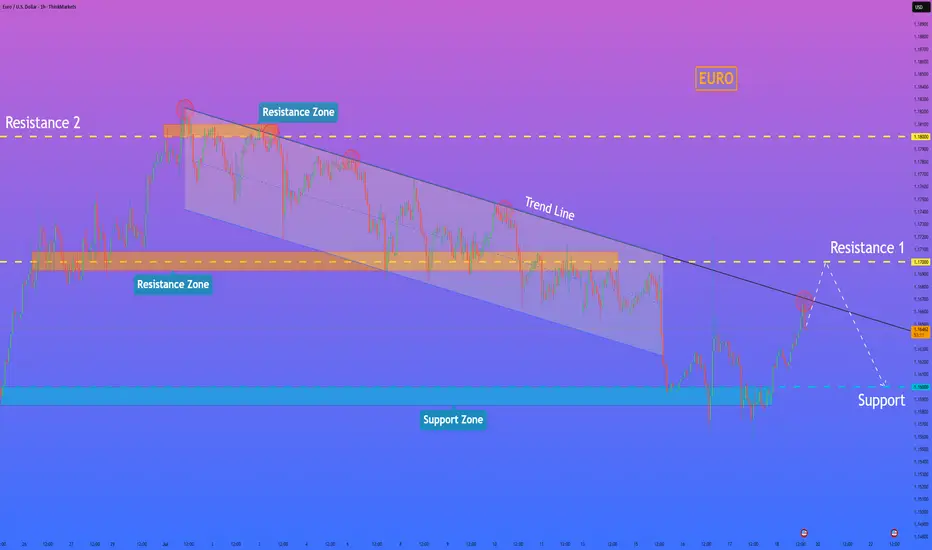
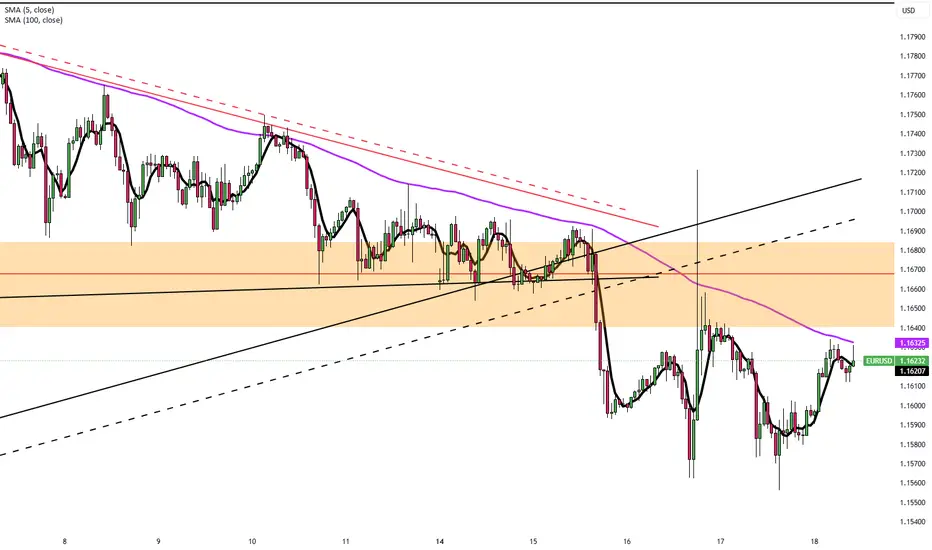
HelenP. I Euro will reach resistance level and then start fallHi folks today I'm prepared for you Euro analytics. For an extended period, the euro was trading within a clearly defined downward channel, consistently respecting its boundaries and moving under bearish pressure. Recently, however, the price staged an aggressive breakout from this structure, pushing above the upper trend line with a strong impulse. This move signaled a potential shift in momentum, as buyers appeared to take control and drive the price away from the major support zone near the 1.1600 level. Currently, following this upward breakout, the price is approaching a critical test at resistance 1. This area, centered around the 1.1700 level, is significant as it previously acted as a key pivot point and support inside the downward channel. The current price action is a classic scenario where old support is being retested as new resistance, which will determine the validity of the recent bullish move. Despite the recent breakout, I expect the upward momentum to fail as the price challenges the resistance zone 1 around 1.1700. I anticipate a rejection from this level, which would confirm the breakout as a false move and re-establish the dominant bearish trend. The primary target for the subsequent decline is the major support level at 1.1600. For this reason, my goal is set at the 1.1600 level. If you like my analytics you may support me with your like/comment ❤️
Disclaimer: As part of ThinkMarkets’ Influencer Program, I am sponsored to share and publish their charts in my analysis.
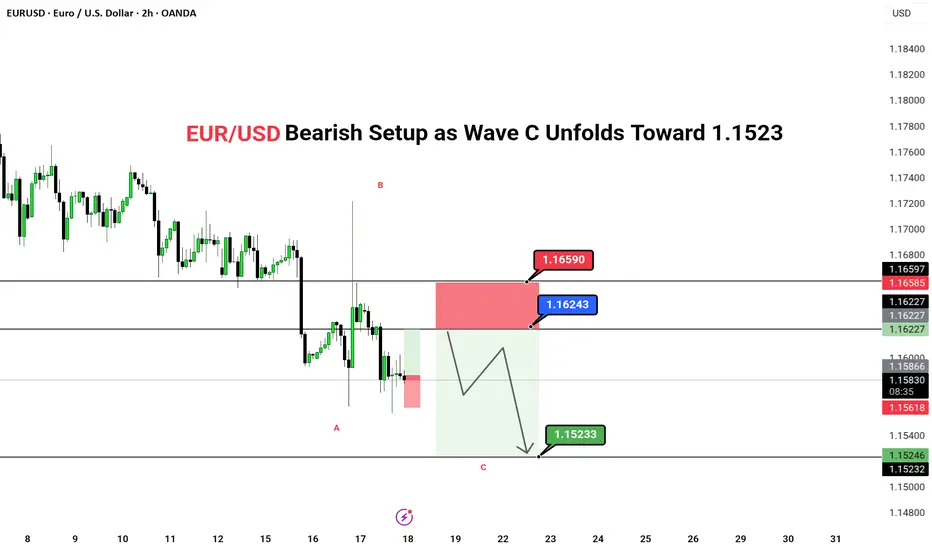
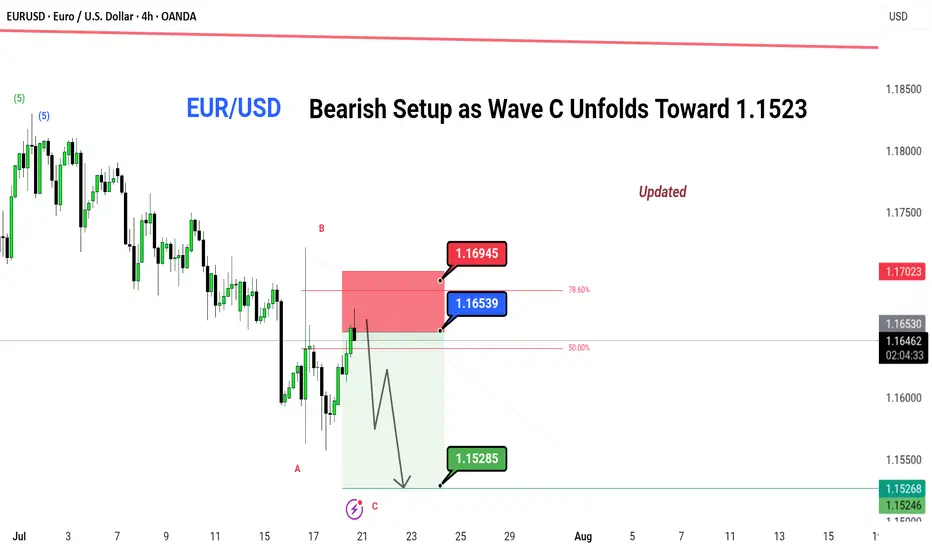
EUR/USD – Bearish Setup as Wave C Unfolds Toward 1.1523📉 EUR/USD – Bearish Setup as Wave C Unfolds Toward 1.1523
Price has retraced into the key 78.6% fib zone after completing Wave B. With clear rejection from the supply area and lower highs forming, Wave C is now in play. Expecting bearish continuation with potential downside targets around 1.1523.
🔻 SHORT BIAS (Wave C in Play)
📍 Entry Zone: 1.16530–1.16945
🎯 Target: 1.15285
⛔ Invalidation: Above 1.17023
📊 Timeframe: 4H
📈 Pattern: ABC Zig-Zag Correction
📌 Updated Analysis by: @greenfire_forex
🧠 Note: Wait for confirmation before entering. Risk management is key.
#EURUSD #ElliottWave #BearishSetup #ABCPattern #WaveC #PriceAction #ForexAnalysis #TradingView
---
Let me know if any correction , would like to suggest
EURUSD Will Collapse! SELL!
My dear subscribers,
This is my opinion on the EURUSD next move:
The instrument tests an important psychological level 1.1663
Bias - Bearish
Technical Indicators: Supper Trend gives a precise Bearish signal, while Pivot Point HL predicts price changes and potential reversals in the market.
Target - 1.1632
About Used Indicators:
On the subsequent day, trading above the pivot point is thought to indicate ongoing bullish sentiment, while trading below the pivot point indicates bearish sentiment.
Disclosure: I am part of Trade Nation's Influencer program and receive a monthly fee for using their TradingView charts in my analysis.
———————————
WISH YOU ALL LUCK
EURUSD: Bears Are Winning! Short!
My dear friends,
Today we will analyse EURUSD together☺️
The market is at an inflection zone and price has now reached an area around 1.16557 where previous reversals or breakouts have occurred.And a price reaction that we are seeing on multiple timeframes here could signal the next move down so we can enter on confirmation, and target the next key level of 1.16419..Stop-loss is recommended beyond the inflection zone.
❤️Sending you lots of Love and Hugs❤️

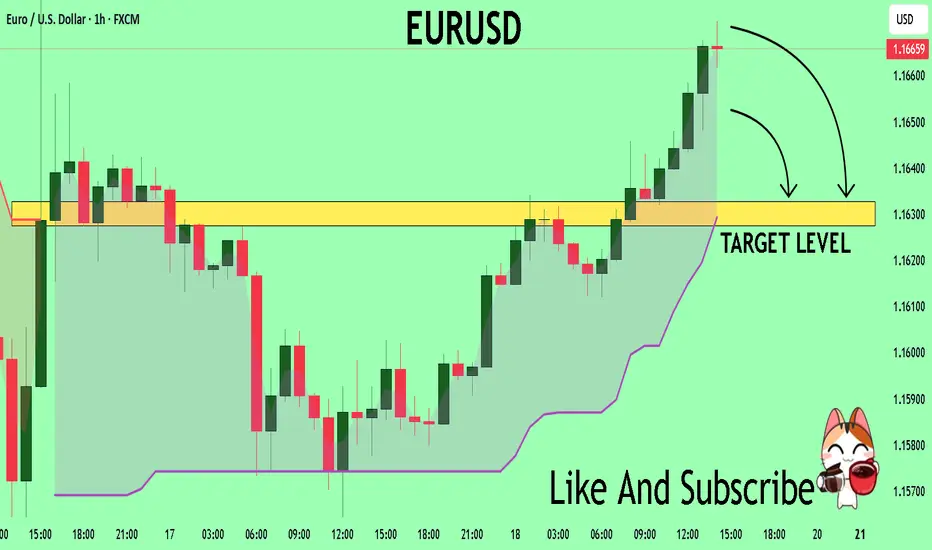
EUR/USD Forecast – Bears in Control Ahead of US Jobless DataEUR/USD Forecast – Bears in Control Ahead of US Jobless Data
🌐 Macro View: Dollar Regains Strength Amid Uncertainty
EUR/USD remains under selling pressure as the greenback finds renewed strength following midweek weakness. The market is bracing for fresh U.S. jobless claims data, expected to show a slight rise to 235K. A print below 220K could reignite USD demand, while a surprise above 240K may offer a temporary lifeline for the euro.
Amid geopolitical and economic turbulence, the euro continues to underperform as investors shift to the dollar for safety and yield advantage.
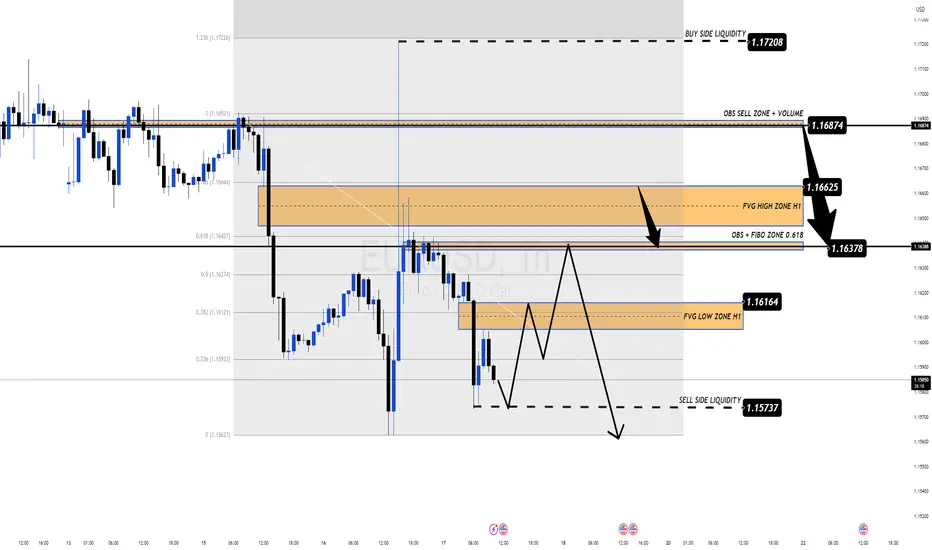
📉 Technical Outlook – MMF & Smart Money Perspective
The recent breakdown below 1.1600 confirms the bearish momentum. Based on the MMF (Market Momentum Flow) methodology, price action is currently moving within a controlled distribution structure, suggesting further downside potential.
Key zones identified from H1 structure:
OBS + FVG High Zone (1.1662 – 1.1687): Strong supply zone + volume imbalance.
1.1637: Mid-key level and possible liquidity magnet.
1.1616 – 1.1573: Ideal area for sweeping sell-side liquidity before any sustainable bounce.
If price reclaims 1.1662, intraday bullish correction may be in play. However, as long as 1.1687 holds, bears remain in control.
🧭 Trade Plan for Today
🔴 SELL ZONE: 1.1662 – 1.1687 (FVG + OBS Volume Zone)
SL: 1.1710
TP: 1.1637 → 1.1616 → 1.1590 → 1.1573
✅ Preferred entry zone aligned with high-volume imbalance & MMF rejection pattern.
🟢 BUY ZONE (Scalp Only): 1.1575 – 1.1580 (Sell-side Liquidity Zone)
SL: 1.1550
TP: 1.1612 → 1.1630 → 1.1645
⚠️ Use with caution — only upon clear price reaction at lower liquidity sweep area.
🔍 Strategy Insight
This is a classic scenario of a controlled pullback within a larger bearish structure. Patience is key — let price tap into imbalanced zones before executing. Given today's U.S. data, volatility may spike during the New York session, so risk management is crucial.
💬 What’s Your Take?
Do you expect EUR/USD to retest the 1.1550s zone, or could a surprise from U.S. job data flip the narrative?
👇 Drop your analysis below & follow for more MMF-based setups.
EUR/USD Flexing Strength- Is the Next Big Coming? EUR/USD Market Update – Bullish Setup at 1.16440
EUR/USD is trading around 1.16440, maintaining its bullish momentum in the current uptrend.
🔹 Current Price: 1.16440
🔹 Support Zone: 1.1600 – 1.1620
🔹 Resistance Zone: 1.1680 – 1.1700
🔹 Trend: Strong bullish structure with clear upward momentum
The pair is holding above key support and aiming for the next resistance at 1.1700. A breakout above this level could open the door to further upside. Traders watching for a retest near support or breakout entry above resistance.
🎯 Trading Plan:
Buy on dips above 1.1620 or wait for a confirmed breakout above 1.1680 with volume.
#EURUSD #ForexAnalysis #BullishSetup #ResistanceSupport #TechnicalAnalysis #PriceAction #TrendTrading #SmartTrader #FXSignals

EURUSD long Lion SETUPhello everyone
the price is in a strong demand area
as liquidity has been withdrawn
and the fair value gap has been filled
but we are waiting for formation pattern on a smaller frame in order to enter an upward wave.
we also have resistance area
so in short. I expect an upside go upppp
Hellena | EUR/USD (4H): LONG to the resistance area 1.18280.The previous idea was aimed at updating the maximum of 1.18280, but the correction turned out to be too deep.
Therefore, I am proposing a new idea. I believe that wave “3” has formed, and now we should see the completion of the correction in wave “4,” after which I expect to see an upward movement in wave “5.” My target is at least the high of wave “3” — the resistance area of 1.18280.
As for the correction, I think it could reach the 1.15459 area, but I recommend working with pending orders.
Manage your capital correctly and competently! Only enter trades based on reliable patterns!

EUR/USD Drops to $1.16 Amid Strong U.S. DataThe euro declined to $1.16 on Thursday, reaching its lowest level in almost a month as the U.S. dollar regained strength. The dollar’s rise followed solid U.S. inflation data and President Trump’s comments suggesting he will keep Fed Chair Jerome Powell in place, reducing expectations for near-term Fed rate cuts. Meanwhile, markets continued to monitor U.S.-EU trade negotiations ahead of the August 1 deadline.
Resistance for the pair is at 1.1670, while support is at 1.1580.
EURUSD Will Go Down! Short!
Please, check our technical outlook for EURUSD.
Time Frame: 3h
Current Trend: Bearish
Sentiment: Overbought (based on 7-period RSI)
Forecast: Bearish
The price is testing a key resistance 1.161.
Taking into consideration the current market trend & overbought RSI, chances will be high to see a bearish movement to the downside at least to 1.155 level.
P.S
Please, note that an oversold/overbought condition can last for a long time, and therefore being oversold/overbought doesn't mean a price rally will come soon, or at all.
Disclosure: I am part of Trade Nation's Influencer program and receive a monthly fee for using their TradingView charts in my analysis.
Like and subscribe and comment my ideas if you enjoy them!

EURUSD Will Go Lower! Sell!
Here is our detailed technical review for EURUSD.
Time Frame: 4h
Current Trend: Bearish
Sentiment: Overbought (based on 7-period RSI)
Forecast: Bearish
The market is approaching a significant resistance area 1.168.
Due to the fact that we see a positive bearish reaction from the underlined area, I strongly believe that sellers will manage to push the price all the way down to 1.159 level.
P.S
Please, note that an oversold/overbought condition can last for a long time, and therefore being oversold/overbought doesn't mean a price rally will come soon, or at all.
Disclosure: I am part of Trade Nation's Influencer program and receive a monthly fee for using their TradingView charts in my analysis.
Like and subscribe and comment my ideas if you enjoy them!

EURUSD H1 I Bearish Reversal Based on the H1 chart, the price is approaching our sell entry level at 1.1641,an overlap resistance.
Our take profit is set at 1.1601, a pullback support.
The stop loss is set at 1.1670, a swing high resistance.
High Risk Investment Warning
Trading Forex/CFDs on margin carries a high level of risk and may not be suitable for all investors. Leverage can work against you.
Stratos Markets Limited (tradu.com ):
CFDs are complex instruments and come with a high risk of losing money rapidly due to leverage. 66% of retail investor accounts lose money when trading CFDs with this provider. You should consider whether you understand how CFDs work and whether you can afford to take the high risk of losing your money.
Stratos Europe Ltd (tradu.com ):
CFDs are complex instruments and come with a high risk of losing money rapidly due to leverage. 66% of retail investor accounts lose money when trading CFDs with this provider. You should consider whether you understand how CFDs work and whether you can afford to take the high risk of losing your money.
Stratos Global LLC (tradu.com ):
Losses can exceed deposits.
Please be advised that the information presented on TradingView is provided to Tradu (‘Company’, ‘we’) by a third-party provider (‘TFA Global Pte Ltd’). Please be reminded that you are solely responsible for the trading decisions on your account. There is a very high degree of risk involved in trading. Any information and/or content is intended entirely for research, educational and informational purposes only and does not constitute investment or consultation advice or investment strategy. The information is not tailored to the investment needs of any specific person and therefore does not involve a consideration of any of the investment objectives, financial situation or needs of any viewer that may receive it. Kindly also note that past performance is not a reliable indicator of future results. Actual results may differ materially from those anticipated in forward-looking or past performance statements. We assume no liability as to the accuracy or completeness of any of the information and/or content provided herein and the Company cannot be held responsible for any omission, mistake nor for any loss or damage including without limitation to any loss of profit which may arise from reliance on any information supplied by TFA Global Pte Ltd.
The speaker(s) is neither an employee, agent nor representative of Tradu and is therefore acting independently. The opinions given are their own, constitute general market commentary, and do not constitute the opinion or advice of Tradu or any form of personal or investment advice. Tradu neither endorses nor guarantees offerings of third-party speakers, nor is Tradu responsible for the content, veracity or opinions of third-party speakers, presenters or participants.

EUR/USD Bearish Setup as Wave C Unfolds Toward 1.1523EUR/USD Bearish Setup as Wave C Unfolds Toward 1.1523
🔴 SHORT BIAS
📅 Updated: July 18
---
🔍 Description
EUR/USD appears to be unfolding a classic ABC corrective structure, with Wave B now likely completed below the key 1.1624–1.1659 resistance zone. The price action has shown clear rejection in this supply area, opening room for Wave C to extend lower toward the 1.1523 target.
This setup aligns with a broader correction within a downtrend, with technicals and short-term flows pointing toward further downside pressure. The 2H timeframe offers swing traders a favorable risk-reward scenario, with invalidation clearly above 1.1659.
---
📊 Technical Structure (2H)
✅ Wave A completed
✅ Wave B rejected at resistance
✅ Wave C expected to unfold
📌 Downside Target
First & Final: 1.15233
🔻 Invalidation Zone
Above: 1.16590 (Break invalidates short bias)