XAU/USD : Gold at a Turning Point – Rejection or Breakout Ahead?By analyzing the TVC:GOLD (XAUUSD) chart on the 4-hour timeframe, we can see that price climbed to $3330 today, entering a key supply zone, which triggered a pullback down to $3310. Gold is now trading around $3317, and I’m watching several potential setups closely.
Scenario 1:
If gold stabilizes below $3320, we could see a bearish move toward $3296.
Scenario 2:
If price breaks above the $3333 resistance, it may enter the next supply zone between $3341 and $3351, which could trigger a strong rejection—potentially offering a 100 to 400 pip move.
Now let’s break down the key levels to watch:
Supply zones: $3320, $3333, $3342, $3358
Demand zones: $3303, $3296, $3289, $3278
Monitor how price reacts to each of these zones — they may provide excellent opportunities.
EURUSD

EURUSD Testing Patience – Bearish Trend Not Over YetEURUSD – Overview
EURUSD continues to trade under pressure amid bearish momentum, respecting key technical levels.
The price maintains bearish momentum as long as it trades below 1.1745, with downside targets at 1.1627 and 1.1557.
A retest of 1.1745 is possible and considered normal in this structure. However, if the price stabilizes below 1.1684, it will likely continue dropping toward the support targets.
To shift back to a bullish bias, the pair must break and hold above 1.1745.
Pivot Line: 1.1695
Support Levels: 1.1627 – 1.1557
Resistance Levels: 1.1745 – 1.1810
previous idea:
EURUSD POTENTIAL BUY SETUP 4HLooking at EURUSD, Price is moving in a descending channel. EU on the high timeframe is bullish as Dollar is weak. I am expecting EU to fall into the marked FVG to clear the lows and take internal liquidity from the marked FVG before moving higher and take the Buyside Liquidity as marked.
Potential Entry= 1.6350
Stop loss= 1.15650
Take Profit = 1.18250
Please wait for price to come into the marked potential area to take this trade and manage your risk accordingly. Follow me for more updates and trades.

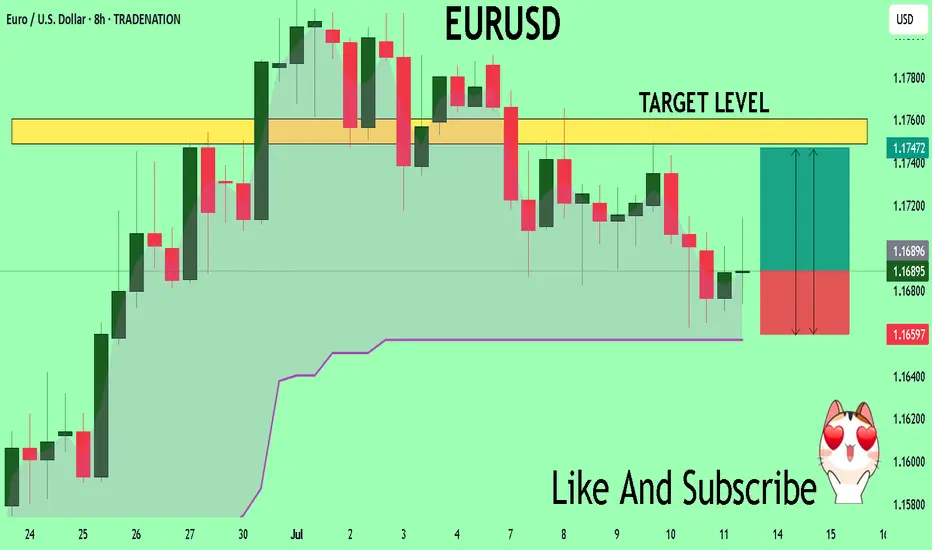
EUR/USD –Bullish Flag After Long Term Trend Shift: Is 1.20 Next?📌 In my previous EUR/USD analysis, I mentioned that the long-term trend likely reversed, and we could see a move toward the 1.23 zone in the medium to longer term.
That view is playing out.
Recently, the pair printed a new local high above 1.18, confirming the trend change.
📉 After this rise, EUR/USD pulled back –but the structure is clearly corrective: overlapping and a classic bullish flag formation.
What's next?
This correction looks close to completion, and bulls may soon return to push toward the key 1.20 level.
Trading Plan:
The 1.1620–1.1650 area stands out as a strong confluence zone – ideal for looking for buying opportunities.
The trend has changed. The setup is forming. Now it’s about timing.
Disclosure: I am part of TradeNation's Influencer program and receive a monthly fee for using their TradingView charts in my analyses and educational articles.

EURUSD Will Go Down From Resistance! Short!
Here is our detailed technical review for EURUSD.
Time Frame: 2h
Current Trend: Bearish
Sentiment: Overbought (based on 7-period RSI)
Forecast: Bearish
The market is trading around a solid horizontal structure 1.177.
The above observations make me that the market will inevitably achieve 1.172 level.
P.S
We determine oversold/overbought condition with RSI indicator.
When it drops below 30 - the market is considered to be oversold.
When it bounces above 70 - the market is considered to be overbought.
Disclosure: I am part of Trade Nation's Influencer program and receive a monthly fee for using their TradingView charts in my analysis.
Like and subscribe and comment my ideas if you enjoy them!

EURUSD and GBPUSD are preparing to continue the upward trendAfter a significant rise in the EURUSD and GBPUSD, they have formed a descending price channel, and it is expected that this channel will be broken to complete the upward trend, because there is no sign of weakness yet, and the Main Lows have not yet been broken.

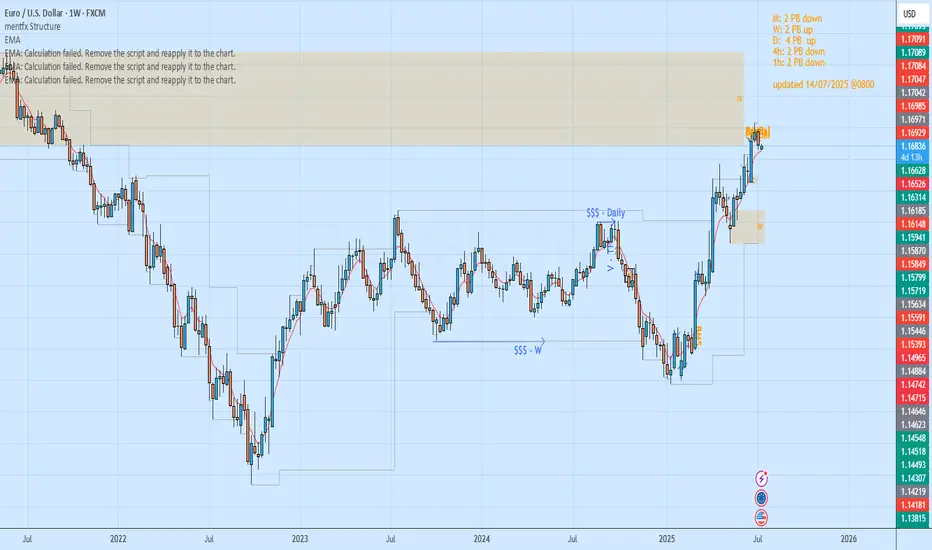
Which Way to GoHello students and traders, let us jump into a quick top down analysis of the EURUSD.
On the Monthly, we see that price is in a down swing. We have seen price recently go bullish, all the way into the Monthly zone, from where it has begun to reverse bearish. We expect price to hold bearish and continue to melt towards our Monthly liquidity target.
Weekly & Daily:
On the weekly and daily Time frames, we have a bullish setup. This bullish setup is what has helped in driving prices all the way up and into the Monthly refined reversal zone. The weekly timeframe is curently seeing a bearish reversal. With the price hitting the monthly zone, there is a low likelihood of price continuing bullish. The bearishness might just continue for a while.
4 hour and 1 Hour
On the smaler timeframes of the 1 and 4 hour timeframe, market is in a bearish swing. We see prices making lower highs and lower lows, a clear sign of a downtrend. We expect this bearishness to hold. Where that happens, we will see market in the longrun and on the lower time frames experience bearish reversals, with price untimately targetting the Monthly liquidity target.
EURUSD - OPPORTUNITY TO PLAY BOTH SIDES OF DESCENDING CHANNEL CMCMARKETS:EURUSD
TRADING IDEA - EURUSD MOVES WITHIN A DESCENDING CHANNEL - OPPORTUNITY TO PLAY BOTH SIDES
EURUSD has been trading within a descending channel since the beginning of the month. Nearby the upper border of the channel there is SMA200 on a 30-m timeframe, pushing on the pair. Generally speaking, all major moving averages are pushing on the EURUSD, the short-term bearish trend continues, so I decided to open
🔽 a market sell order at 1.16688 with
❌a stop loss at 1.16985 and
🤑a take profit at 1.16324
Later I expect a rebound from the lower border with a potential uprise towards upper border of the descending channel.

Fundamental Market Analysis for July 14, 2025 EURUSDThe euro remains under pressure: on Monday the pair slipped to 1.16750 after the European Commission extended its pause on retaliatory tariffs against the United States until 1 August. With no resolution in sight, the trade dispute keeps European exporters on edge and turns the dollar into a safe-haven choice for investors looking to limit risk.
Additional support for the greenback comes from rising real yields. The 10-year U.S. Treasury rate is holding above 4.40 %, locking in a wide spread over German Bunds. That has led futures traders to price in just one 25 bp Federal Reserve rate cut for the rest of the year, reducing the euro’s relative appeal.
Macro data from the euro area offer little relief. German industrial production rose only 0.2 % m/m in May, while the July ZEW expectations index slid back into negative territory. With the ECB having already delivered a June cut and projecting lower inflation ahead, inward capital flows to the eurozone remain subdued.
Trading recommendation: SELL 1.16750, SL 1.17050, TP 1.16200

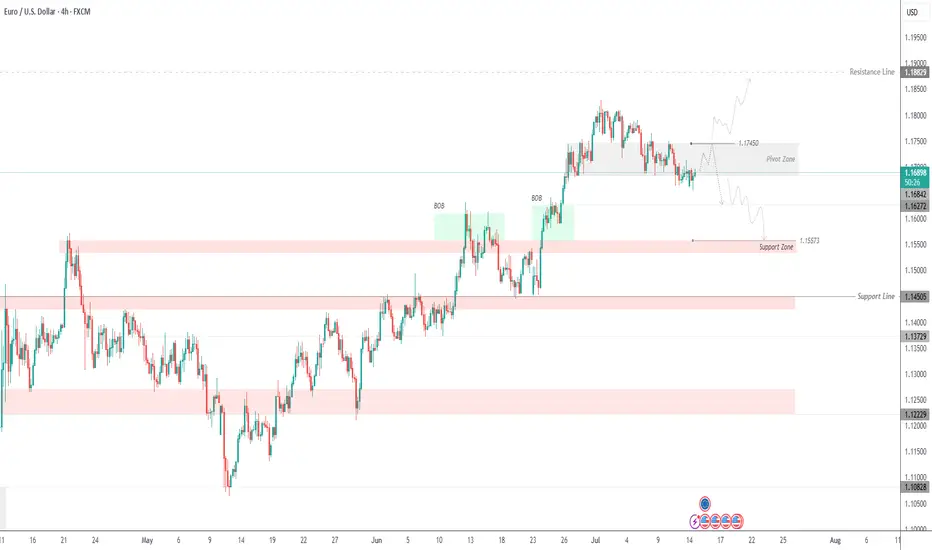
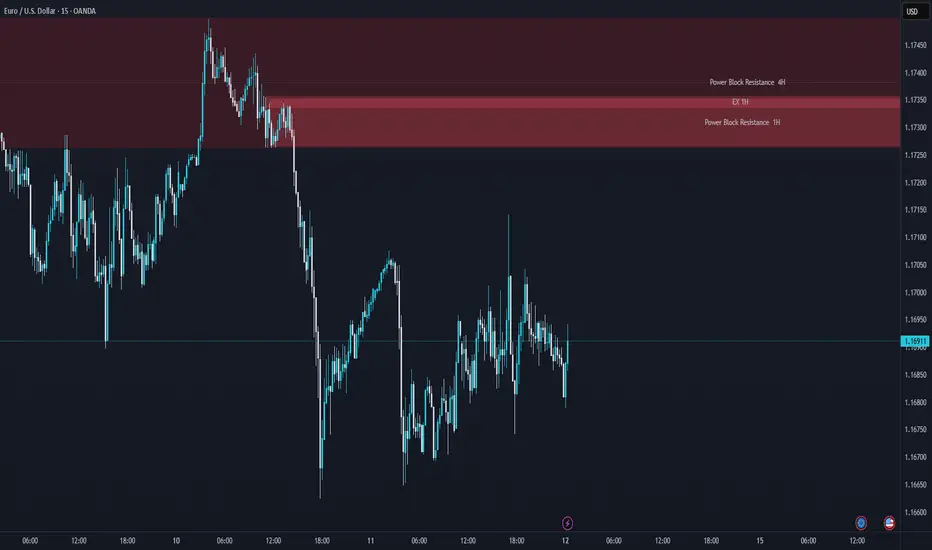
EUR/USD Holding Support — Watching for Bullish ReactionHi Everyone,
Since our last update, EUR/USD continues to range near the 1.16680 support level. We’re watching for buying interest to emerge above the key 1.16450 zone, which has acted as a critical level for the broader structure.
Should price manage to stabilise and form a base here, there’s potential for a move back towards the highlighted resistance area around 1.17450. A clear reaction from support could confirm renewed buying interest and set the stage for a retest of last week’s highs.
Our broader outlook remains unchanged: as long as price holds above 1.16450, we continue to look for the pair to build momentum for another move higher in the coming sessions. A decisive break above last week’s high could attract fresh buying interest, paving the way for a push towards the 1.19290 area and ultimately 1.20000.
We'll be watching closely to see if this recovery gains traction and whether buyers can sustain the move above resistance. The longer-term view remains bullish, provided price continues to respect the key support zone.
We’ll keep updating you through the week as the structure unfolds and share how we’re managing our active positions.
Thanks again for all the likes/boosts, comments and follows — we really appreciate the support!
All the best for the rest of the week. Trade safe.
BluetonaFX

EUR/USD Sells from 1.17200 back downWeekly Outlook: EUR/USD (EU)
This week, my bias on EUR/USD is similar to GBP/USD, as both pairs have been following a consistent bearish trend. Based on this structure, I’ll be watching to see if price begins a retracement back into an area of supply.
I’ve marked out the 8-hour supply zone, which sits at a premium level and was responsible for the last break of structure to the downside. If price retraces into this zone, I’ll look for potential sell confirmations on the lower time frames.
If price doesn’t tap into the supply zone first, I’ll then shift my focus to the 8-hour demand zone below. In that case, I’ll watch closely for signs of accumulation and a bullish reaction from this level, which could signal the start of a rally.
Confluences for EUR/USD Sells:
✅ Bearish trend has been consistent for the past few weeks.
✅ Breaks of structure have formed new supply zones to trade from.
✅ Liquidity exists below current price, which may be targeted first.
✅ The lower demand zone remains unmitigated, suggesting further downside movement.
📌 On the way down toward demand, I expect price to form another break of structure to the downside. The plan is to ride the sells down into demand, then look for potential buy opportunities if price begins to accumulate and react.
Let’s stay sharp and disciplined — have a solid trading week, everyone! 📊

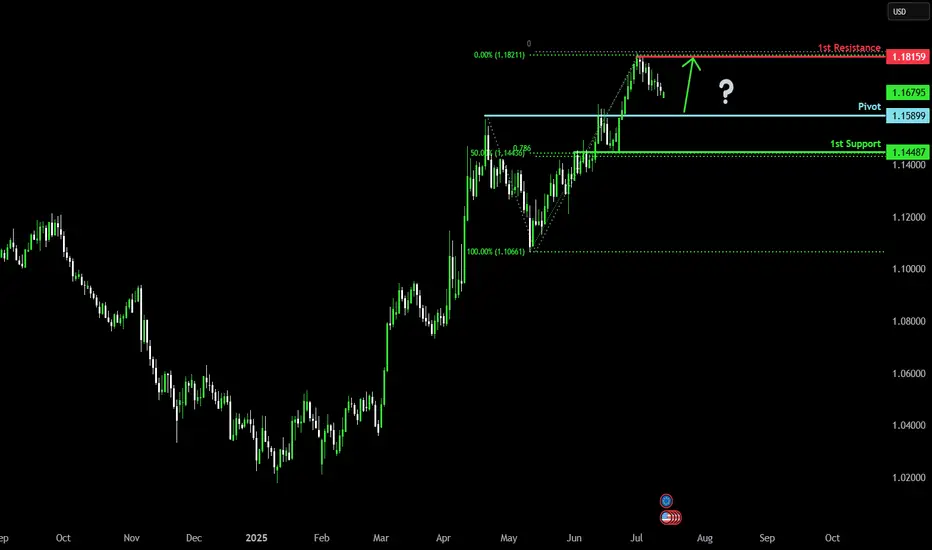
Bullish continuation?The Fiber (EUR/USD) is falling towards the pivot, which has been identified as a pullback support and could bounce to the 1st resistance.
Pivot: 1.1589
1st Support: 1.1448
1st Resistance: 1.1815
Risk Warning:
Trading Forex and CFDs carries a high level of risk to your capital and you should only trade with money you can afford to lose. Trading Forex and CFDs may not be suitable for all investors, so please ensure that you fully understand the risks involved and seek independent advice if necessary.
Disclaimer:
The above opinions given constitute general market commentary, and do not constitute the opinion or advice of IC Markets or any form of personal or investment advice.
Any opinions, news, research, analyses, prices, other information, or links to third-party sites contained on this website are provided on an "as-is" basis, are intended only to be informative, is not an advice nor a recommendation, nor research, or a record of our trading prices, or an offer of, or solicitation for a transaction in any financial instrument and thus should not be treated as such. The information provided does not involve any specific investment objectives, financial situation and needs of any specific person who may receive it. Please be aware, that past performance is not a reliable indicator of future performance and/or results. Past Performance or Forward-looking scenarios based upon the reasonable beliefs of the third-party provider are not a guarantee of future performance. Actual results may differ materially from those anticipated in forward-looking or past performance statements. IC Markets makes no representation or warranty and assumes no liability as to the accuracy or completeness of the information provided, nor any loss arising from any investment based on a recommendation, forecast or any information supplied by any third-party.
Bullish bounce off 50% Fibonacci support?EUR/USD is falling towards the support level which is a pullback support that lines up with the 50% Fibonacci support and could bounce from this level to our take profit.
Entry: 1.1632
Why we like it:
There is a pullback support that lines up with the 50% Fibonacci retracement.
Stop loss: 1.1582
Why we like it:
There is an overlap support that is slightly below the 61.8% Fibonacci retracement.
Take profit: 1.1738
Why we like it:
There is an overlap resistance.
Enjoying your TradingView experience? Review us!
Please be advised that the information presented on TradingView is provided to Vantage (‘Vantage Global Limited’, ‘we’) by a third-party provider (‘Everest Fortune Group’). Please be reminded that you are solely responsible for the trading decisions on your account. There is a very high degree of risk involved in trading. Any information and/or content is intended entirely for research, educational and informational purposes only and does not constitute investment or consultation advice or investment strategy. The information is not tailored to the investment needs of any specific person and therefore does not involve a consideration of any of the investment objectives, financial situation or needs of any viewer that may receive it. Kindly also note that past performance is not a reliable indicator of future results. Actual results may differ materially from those anticipated in forward-looking or past performance statements. We assume no liability as to the accuracy or completeness of any of the information and/or content provided herein and the Company cannot be held responsible for any omission, mistake nor for any loss or damage including without limitation to any loss of profit which may arise from reliance on any information supplied by Everest Fortune Group.

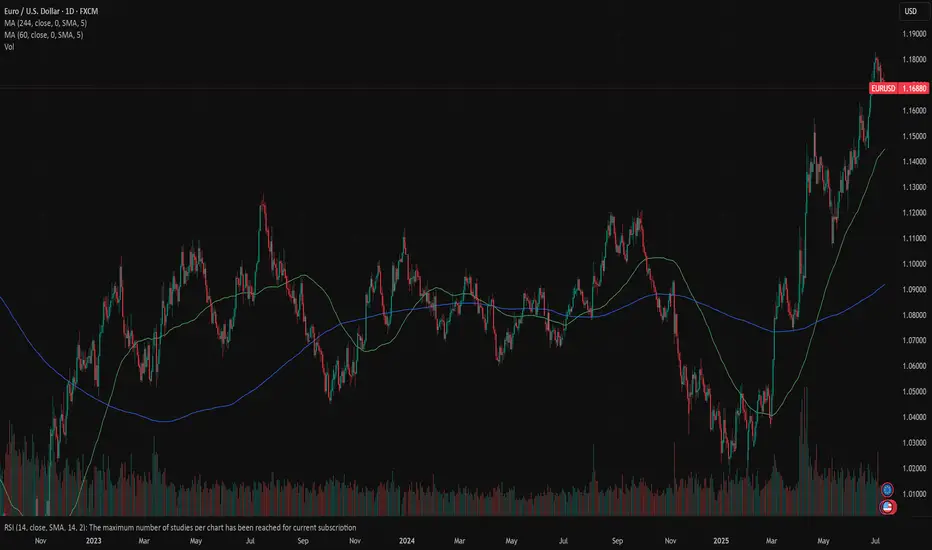
EURUSD: focus on inflationThis week was calm when it comes to currently important US macro data. The most important event was related to the release of the FOMC meeting minutes from the June session. There was no new information revealed in the Minutes, which has not already been communicated with the public. The Fed is aimed to maintain flexibility around future rate cuts. They will most probably remain on hold until the economic data more clearly supports a slowdown. Analysts continue to be of the opinion that the Fed will most probably make the next rate cut somewhere in late 2025 and into 2026. Such opinion is supported with ongoing risks of both rising inflation and unemployment due to introduced trade tariffs, putting challenge to Fed officials.
Industrial Production in Germany during May increased by 1,2% for the month, which was much better from estimated 0%. Retail Sales in the Euro Zone dropped in May by -0,7%, bringing the indicator to the yearly level of 1,8%. Balance of Trade in Germany in May reached euro 18,4B, better from expected euro 15,5B. Inflation rate in Germany, final for June, was standing at the level of 0% for the month and 2% for the year. Both figures were in line with market expectations. Wholesale prices in Germany in June were higher by 0,2% and 0,9% on a yearly basis.
Markets favored US Dollar during the previous week, where the eurusd was traded within a range from 1,1790 down to 1,1670. The RSI moved from the overbought market side, ending the week at the level of 57. As long as the indicator is holding above the level of 50, there will be no indication that the market has started to clearly eye the oversold market side. At the same time, the MA50 continues to strongly diverge from MA200, within an indication of a potential slowdown in the coming period, as well as potential crossovers.
Although this week was a relatively calm one, the week ahead brings some important US macro data, including June inflation, PPI and University of Michigan Consumer Sentiment data. Considering current market sensitivity on any negative movements in inflation figures, the week ahead might bring some increased volatility on financial markets. As per current charts, eurusd has some space for a further move toward the downside, at least till the level of 1,1650. There is also potential for a short term reversal indicated on charts, with some potential that 1,1750 might be tested during the week.
Important news to watch during the week ahead are:
EUR: Industrial Production in the Euro Zone in May, ZEW Economic Sentiment Index in July in the EuroZone and Germany,
USD: Inflation Rate in June, Producers Price Index in June, Retail Sales in June, Building Permits preliminary for June, Housing Starts in June, Michigan Consumer Sentiment preliminary for July.
Week of 7/13/25: EURUSD AnalysisLast week's candle was a bearish engulfing meaning that most likely price will continue lower this week as a daily trend retracement. Waiting for LTF bearish price action before entering.
Major News:
Tuesday - CPI
Wednesday - PPI
Thursday - Unemployment

EUR-USD Will Keep Growing! Buy!
Hello,Traders!
EUR-USD keep trading in
An uptrend along the rising support
So as the pair is approaching
A the support we will be
Expecting a bullish rebound
And a move up on Monday
Buy!
Comment and subscribe to help us grow!
Check out other forecasts below too!
Disclosure: I am part of Trade Nation's Influencer program and receive a monthly fee for using their TradingView charts in my analysis.

EURUSD: Long Signal with Entry/SL/TP
EURUSD
- Classic bullish formation
- Our team expects pullback
SUGGESTED TRADE:
Swing Trade
Long EURUSD
Entry - 1.1689
Sl - 1.1627
Tp - 1.1799
Our Risk - 1%
Start protection of your profits from lower levels
Disclosure: I am part of Trade Nation's Influencer program and receive a monthly fee for using their TradingView charts in my analysis.
❤️ Please, support our work with like & comment! ❤️

Bearish Signal | Technical + Custom AlgoSmart Trend Signal | Technical Analysis + Custom Algorithm
This signal is the result of a combination of classic technical trend analysis and a proprietary software I personally developed.
Two Brains, One Trade: Why You Freeze Under PressureBy MJTrading:
In trading, your biggest opponent isn’t volatility.
It’s your own neural wiring.
Every trader operates with two main systems:
🧠 System 2 – Rational, deliberate, planning (Prefrontal Cortex)
🧠 System 1 – Emotional, instinctive, fast (Amygdala & Limbic Brain)
Before entry, System 2 is in control. You feel calm, logical.
But the moment money is at risk—especially in drawdown or after a missed TP—System 1 takes over.
💥 Stress hormones spike
💥 Focus narrows
💥 Long-term thinking disappears
💥 You freeze, or act impulsively
You knew what to do.
But you didn’t do it.
Because in that moment, your rational mind wasn’t driving anymore.
⚖️ Set & Forget vs. Floating Managers
Different trading personalities react differently under pressure:
🔹 Set & Forget Traders
Rely on automation or predefined exits to bypass emotional hijack.
They reduce cognitive load, but often feel regret when price goes “a little more.”
🔹 Floating Management Traders
Rely on intuition and live feeling. They stay with the chart, adjusting based on flow.
When calm and trained, they shine.
But under pressure, they’re more vulnerable to emotional loops:
– hesitation
– premature exits
– revenge tweaks
– system betrayal
🧘♂️ What can you do?
✔️ Pre-plan decisions
Make the hard calls before emotions kick in.
✔️ Mental rehearsal
Visualize trade management scenarios—yes, like athletes do.
✔️ Create fallback protocols
So if you freeze, your system still knows what to do.
🧠 For Those Who Want to Go Deeper:
“Thinking, Fast and Slow” by Daniel Kahneman
Understand System 1 & 2 thinking—and how cognitive bias shapes all decisions, not just trades.
“The Hour Between Dog and Wolf” by John Coates
A stunning look at how biology, hormones, and risk-taking collide in traders' brains.
🔓 Final Thought:
If your strategy works in theory, but breaks in real-time—
It’s time to work on your neural execution layer.
Because in trading, you don’t rise to your level of analysis—
you fall to your level of emotional wiring.
— MJTrading
#NeuroTrading #TraderTypes #TradingPsychology #SetAndForget #FloatingManagement #MindOverMarkets #EURUSD #MJTrading
Previous psychology Ideas:

EURUSD: Detailed Support & Resistance Analysis 🇪🇺🇺🇸
Here is my latest structure analysis and important
supports and resistances for EURUSD for next week.
Consider these structures for pullback/breakout trading.
❤️Please, support my work with like, thank you!❤️
I am part of Trade Nation's Influencer program and receive a monthly fee for using their TradingView charts in my analysis.

EURUSD - Still Orderflow remains bearishLooking at EU. The 1H Orderflow is still maintaining that bearish intent. My area is set now for where i want to take a potential sell to the downside seeing as everything else is pretty much mitigated.
The only issue with this potential sell of is that we never really had a sweep of liquidity before we rolled over and moved to the downside.
We do have a level of inducement before our POI but i think in an ideal world i would love to see us build up a bit more liquidity before the POI just to induce the early sellers before making that move to the downside.
For now. On the lower TF's i will be looking to take short term long positions back up to our POI before looking for the longer terms short. to our 4H POI in which i will be looking to get long once again.
Any questions feel free to give me a message

EURUSD Trading Opportunity! BUY!
My dear subscribers,
This is my opinion on the EURUSD next move:
The instrument tests an important psychological level 1.1689
Bias - Bullish
Technical Indicators: Supper Trend gives a precise Bullish signal, while Pivot Point HL predicts price changes and potential reversals in the market.
Target - 1.1748
My Stop Loss - 1.1659
About Used Indicators:
On the subsequent day, trading above the pivot point is thought to indicate ongoing bullish sentiment, while trading below the pivot point indicates bearish sentiment.
Disclosure: I am part of Trade Nation's Influencer program and receive a monthly fee for using their TradingView charts in my analysis.
———————————
WISH YOU ALL LUCK
EURUSD H4 RISES 🔄 Disrupted EUR/USD Analysis (4H)
📉 Current Structure:
Price is hovering around 1.17298, showing hesitation at the resistance of a potential bearish flag.
While the chart labels this zone as “bullish,” there are signs of market indecision, possibly a fakeout trap.
⚠️ Key Disruptions:
1. Bullish Trap Risk:
The price formed a short-term M-pattern (double top inside the orange circle), indicating bearish exhaustion rather than continuation.
The expected breakout to the upside may fail if bulls don’t sustain volume.
2. Support Area Weakness:
The support zone around 1.17000 has been tested multiple times. If it breaks, it could turn into a strong resistance, flipping the sentiment.
3. Macro Influence:
Upcoming EUR and USD economic events (noted by icons) could cause high volatility and break structure unexpectedly.
A strong USD report could reverse bullish momentum, sending EUR/USD toward 1.16500 or lower.
4. Bearish Continuation Scenario:
If the market breaks down from the current consolidation, expect targets at:
