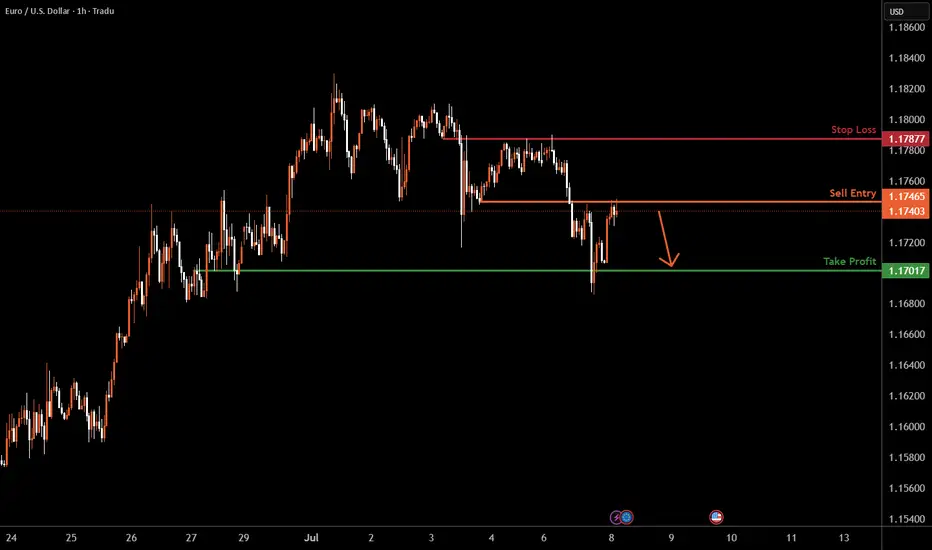
EURUSD H1 I Bearish Reversal Based on the H1chart analysis, we can see that the price is testing our sell entry at 1.1745 which is an overlap resistance.
Our take profit will be at 1.1701, an overlap support level.
The stop loss will be placed at 1.1787, an overlap resistance.
High Risk Investment Warning
Trading Forex/CFDs on margin carries a high level of risk and may not be suitable for all investors. Leverage can work against you.
Stratos Markets Limited (tradu.com ):
CFDs are complex instruments and come with a high risk of losing money rapidly due to leverage. 63% of retail investor accounts lose money when trading CFDs with this provider. You should consider whether you understand how CFDs work and whether you can afford to take the high risk of losing your money.
Stratos Europe Ltd (tradu.com ):
CFDs are complex instruments and come with a high risk of losing money rapidly due to leverage. 63% of retail investor accounts lose money when trading CFDs with this provider. You should consider whether you understand how CFDs work and whether you can afford to take the high risk of losing your money.
Stratos Global LLC (tradu.com ):
Losses can exceed deposits.
Please be advised that the information presented on TradingView is provided to Tradu (‘Company’, ‘we’) by a third-party provider (‘TFA Global Pte Ltd’). Please be reminded that you are solely responsible for the trading decisions on your account. There is a very high degree of risk involved in trading. Any information and/or content is intended entirely for research, educational and informational purposes only and does not constitute investment or consultation advice or investment strategy. The information is not tailored to the investment needs of any specific person and therefore does not involve a consideration of any of the investment objectives, financial situation or needs of any viewer that may receive it. Kindly also note that past performance is not a reliable indicator of future results. Actual results may differ materially from those anticipated in forward-looking or past performance statements. We assume no liability as to the accuracy or completeness of any of the information and/or content provided herein and the Company cannot be held responsible for any omission, mistake nor for any loss or damage including without limitation to any loss of profit which may arise from reliance on any information supplied by TFA Global Pte Ltd.
The speaker(s) is neither an employee, agent nor representative of Tradu and is therefore acting independently. The opinions given are their own, constitute general market commentary, and do not constitute the opinion or advice of Tradu or any form of personal or investment advice. Tradu neither endorses nor guarantees offerings of third-party speakers, nor is Tradu responsible for the content, veracity or opinions of third-party speakers, presenters or participants.
EURUSD
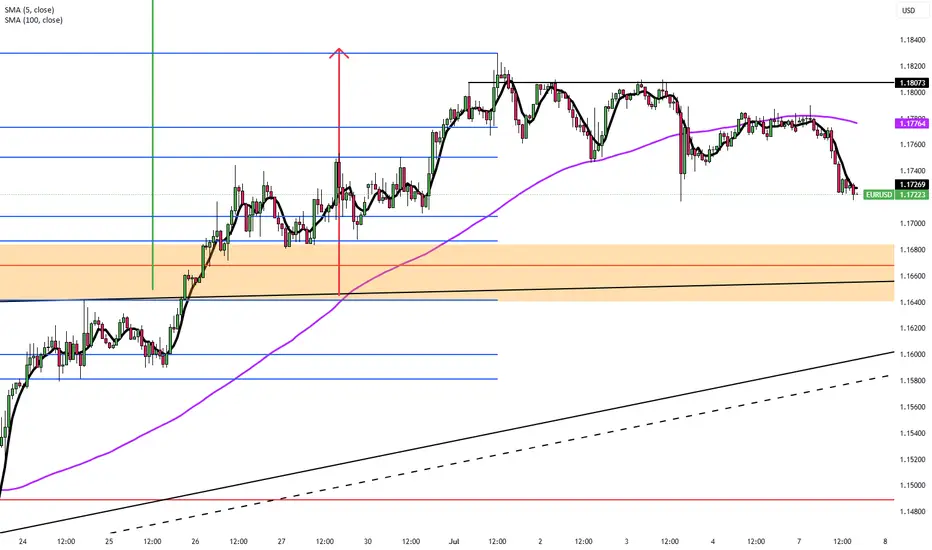
EUR/USD Update: Breakout Potential Above Recent HighsHi Everyone,
Monday played out as expected; a bounce off the highlighted support area appears to have provided enough momentum for a retest of the 1.18000 level. Price could briefly dip below the 1.16680 support; however, our outlook will remain unchanged as long as we hold above the 1.16450 level.
We maintain the view that a decisive break above last week’s high could attract additional buyers, paving the way for a move towards the 1.19290 level and ultimately the 1.20000 level.
We’ll share further updates on the projected path for EUR/USD if price breaks above this key resistance.
The longer-term outlook remains bullish, with expectations for the rally to extend towards the 1.2000 level, provided the price holds above the key support at 1.10649.
We will continue to update you throughout the week with how we’re managing our active ideas and positions. Thanks again for all the likes/boosts, comments and follows — we appreciate the support!
All the best for a good end to the week. Trade safe.
BluetonaFX

EURUSD - Potential sell at LDN or NY openLooking for sell from the POI highlighted
We have raided buy side liquidity so now its time to look at the origin of the move and see if we can further capitalise on a similar set up I took yesterday in order to bank a lovely 8.5% profit on this single trade.
Will post the trade below

EUR/USD Technical ReversalThe daily EUR/USD chart shows a clear rejection at the 1.1830 resistance, aligned with the 0% Fibonacci level, following a sustained upward move. The rejection candlestick pattern, combined with the formation of an ascending channel, suggests buyer exhaustion and a potential start of a correction.
Fibonacci projections indicate key support zones at 1.1198 (38.2%), 1.1000 (50%), and 1.0800 (61.8%). A sustained break below the ascending trendline and the intermediate support zone (highlighted in yellow) would reinforce the correction scenario, with a potential target at 1.0176 (100% Fibonacci).
Decreasing volume and the lack of new significant highs further support the reversal hypothesis. Momentum analysis (RSI and MACD, if present) should be monitored for additional confirmation of the weakening bullish trend.
From a fundamental perspective, the correction may be triggered by divergences in ECB and Fed monetary policies, as well as recent macroeconomic data favoring the US dollar.
EUR/USD is showing clear technical signs of reversal after rejection at a key resistance. Loss of the 1.10 and 1.08 supports could accelerate the correction toward 1.0176. Close monitoring of upcoming candles and momentum indicators is recommended for confirmation of the move.

Bearish drop for the Fiber?The price is rising towards the pivot which acts as an overlap resistance and could drop to the 1st support.
Entry: 1.1743
1st Support: 1.1631
1st Resistance: 1.1833
Risk Warning:
Trading Forex and CFDs carries a high level of risk to your capital and you should only trade with money you can afford to lose. Trading Forex and CFDs may not be suitable for all investors, so please ensure that you fully understand the risks involved and seek independent advice if necessary.
Disclaimer:
The above opinions given constitute general market commentary, and do not constitute the opinion or advice of IC Markets or any form of personal or investment advice.
Any opinions, news, research, analyses, prices, other information, or links to third-party sites contained on this website are provided on an "as-is" basis, are intended only to be informative, is not an advice nor a recommendation, nor research, or a record of our trading prices, or an offer of, or solicitation for a transaction in any financial instrument and thus should not be treated as such. The information provided does not involve any specific investment objectives, financial situation and needs of any specific person who may receive it. Please be aware, that past performance is not a reliable indicator of future performance and/or results. Past Performance or Forward-looking scenarios based upon the reasonable beliefs of the third-party provider are not a guarantee of future performance. Actual results may differ materially from those anticipated in forward-looking or past performance statements. IC Markets makes no representation or warranty and assumes no liability as to the accuracy or completeness of the information provided, nor any loss arising from any investment based on a recommendation, forecast or any information supplied by any third-party.

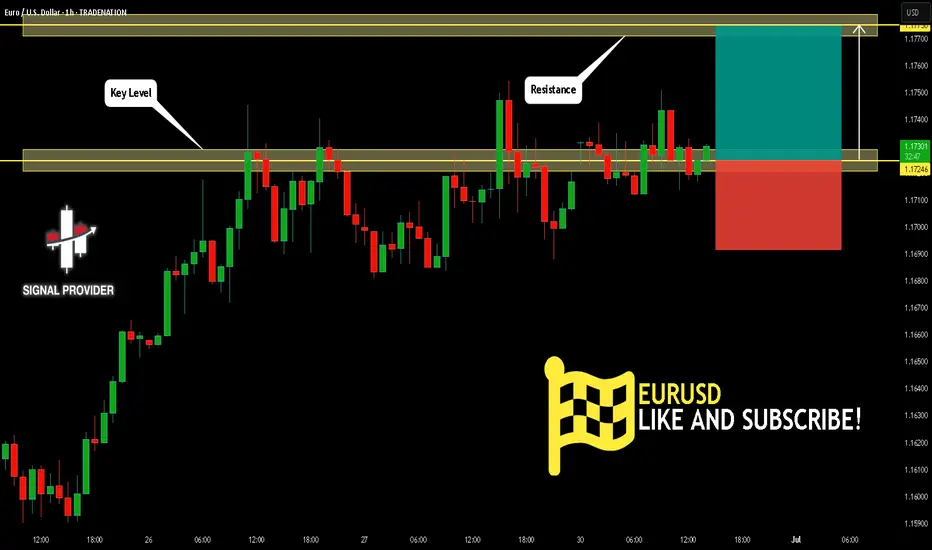
EURUSD Bounce on the 4H MA100 eyes 1.2000.The EURUSD pair has been trading within a Channel Up pattern since the May 12 Low. Right now it is expanding its 3rd Bearish Leg of this structure, with the previous two reaching at least either the 4H MA100 (green trend-line) or the 0.5 Fibonacci retracement level before rebounding.
As a result, we expect a rebound soon around the 1.16500 level to start the new Bullish Leg. The last two peaked on the 1.5 Fibonacci extension, which gives us a clear Target at 1.2000.
Notice also that every time the 4H MACD formed a Bullish Cross below the 0.0 mark, it was a confirmed buy signal. Use that to your advantage.
-------------------------------------------------------------------------------
** Please LIKE 👍, FOLLOW ✅, SHARE 🙌 and COMMENT ✍ if you enjoy this idea! Also share your ideas and charts in the comments section below! This is best way to keep it relevant, support us, keep the content here free and allow the idea to reach as many people as possible. **
-------------------------------------------------------------------------------
Disclosure: I am part of Trade Nation's Influencer program and receive a monthly fee for using their TradingView charts in my analysis.
💸💸💸💸💸💸
👇 👇 👇 👇 👇 👇

EURUSD I Technical & Fundamental Forecast Welcome back! Let me know your thoughts in the comments!
** EURUSD Analysis - Listen to video!
We recommend that you keep this pair on your watchlist and enter when the entry criteria of your strategy is met.
Please support this idea with a LIKE and COMMENT if you find it useful and Click "Follow" on our profile if you'd like these trade ideas delivered straight to your email in the future.
Thanks for your continued support!Welcome back! Let me know your thoughts in the comments!

EURUSD: The Market Is Looking Up! Long!
My dear friends,
Today we will analyse EURUSD together☺️
The market is at an inflection zone and price has now reached an area around 1.17341 where previous reversals or breakouts have occurred.And a price reaction that we are seeing on multiple timeframes here could signal the next move up so we can enter on confirmation, and target the next key level of 1.17512.Stop-loss is recommended beyond the inflection zone.
❤️Sending you lots of Love and Hugs❤️

EURUSD Buyers In Panic! SELL!
My dear friends,
My technical analysis for EURUSD is below:
The market is trading on 1.1775 pivot level.
Bias - Bearish
Technical Indicators: Both Super Trend & Pivot HL indicate a highly probable Bearish continuation.
Target - 1.1648
Recommended Stop Loss - 1.1840
About Used Indicators:
A pivot point is a technical analysis indicator, or calculations, used to determine the overall trend of the market over different time frames.
Disclosure: I am part of Trade Nation's Influencer program and receive a monthly fee for using their TradingView charts in my analysis.
———————————
WISH YOU ALL LUCK

EURUSD: Growth & Bullish Forecast
Balance of buyers and sellers on the EURUSD pair, that is best felt when all the timeframes are analyzed properly is shifting in favor of the buyers, therefore is it only natural that we go long on the pair.
Disclosure: I am part of Trade Nation's Influencer program and receive a monthly fee for using their TradingView charts in my analysis.
❤️ Please, support our work with like & comment! ❤️
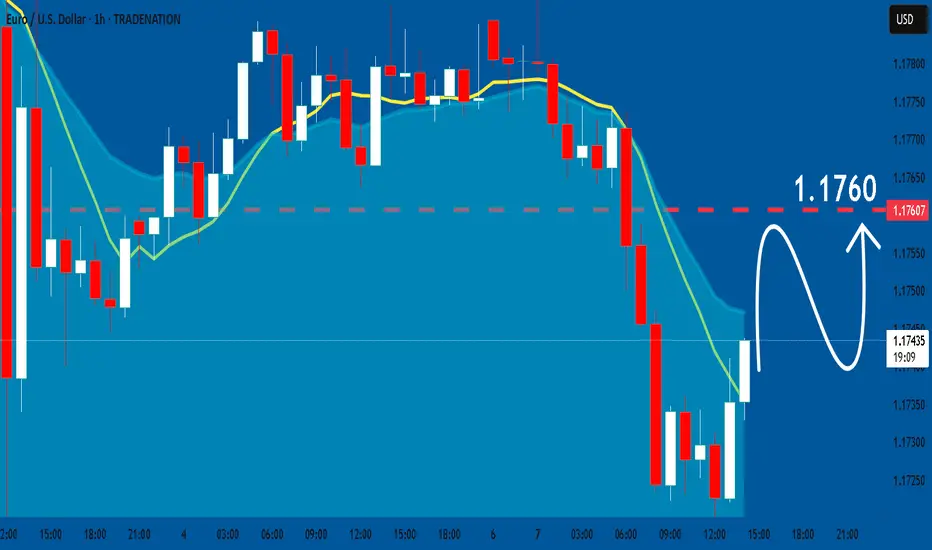
US Jobs Data Supports Fed Dovish SignalsThe EUR/USD stayed in a narrow range around 1.1760 during Friday’s Asian session, with limited movement as US markets were closed for Independence Day.
The US dollar gained modestly after Thursday’s NFP data showed 147,000 new jobs in June, beating the expected 110,000.
However, private sector job growth slowed, adding only 74,000 jobs in June versus a three-month average of 115,000. This trend supports Fed officials like Vice Chair Bowman, who recently called for rate cuts due to labor market risks.
Resistance for the pair is at 1.1830, while support is at 1.1730.
XAU/USD : Get Ready for Another Fall ! (READ THE CAPTION)By analyzing the gold chart on the 4-hour timeframe, we can see that, as expected from our previous analysis, when the price was trading around $3327, it climbed to the supply zone at $3345. After reaching this key level, strong selling pressure emerged, leading to a sharp drop in gold today down to $3296.
This move played out exactly as anticipated, and now, if the price stabilizes below $3330, we could expect further downside pressure on gold.
The Main Analysis :

What’s EURUSD Telling Us on the 30-Minute Chart?🌅 Good morning, my friends,
EURUSD just made a pullback within the last 30 minutes, so I entered a sell position based on that move.
🎯 Targets:
- TP1: 1.17607
- TP2: 1.17475
- TP3: 1.17174
🛑 Stop Loss: 1.17938
📊 Risk/Reward Ratio: 2.00
Your likes and support are what keep me motivated to share these analyses consistently.
Huge thanks to everyone who shows love and appreciation! 🙏

GBPJPY BULLISH OR BEARIS DETAILED ANALYSISGBPJPY has successfully broken out of a long-term falling wedge on the weekly chart, and the bullish momentum is unfolding as expected. Price has rallied from 190.00 to the current 197.00 level, delivering solid profits from the breakout zone. This continuation setup is extremely strong, with the market respecting the wedge breakout structure and forming higher highs. As long as we hold above the 190.00 support, the bullish bias remains fully intact, with 205.00 as the next key upside target.
Fundamentally, the British pound remains well-supported due to the Bank of England’s hawkish stance. Despite softer inflation data, the BoE has signaled a cautious approach to rate cuts compared to other central banks, maintaining underlying GBP strength. On the other side, the Japanese yen continues to weaken as the Bank of Japan sticks with its ultra-loose monetary policy. Yen weakness is further fueled by rising US and UK bond yields, widening the yield differential and attracting carry trades into GBPJPY.
Technically, the breakout is unfolding with textbook precision. Price has cleared descending resistance, retested it, and is now building a new leg higher. The volume profile is supporting this bullish breakout, and market structure is confirming further upside. The 200.00 psychological level may act as a minor resistance, but once cleared, 205.00 is well within range and aligns with major Fibonacci extensions.
GBPJPY is also benefiting from increased volatility in risk-on sentiment, as equity markets remain firm and bond yields rise globally. Traders are favoring high-yielding currencies like GBP while shorting low-yielders like JPY. With the fundamentals and technicals now strongly aligned, this trade is well-positioned to deliver continued profits toward 205.00 and beyond.

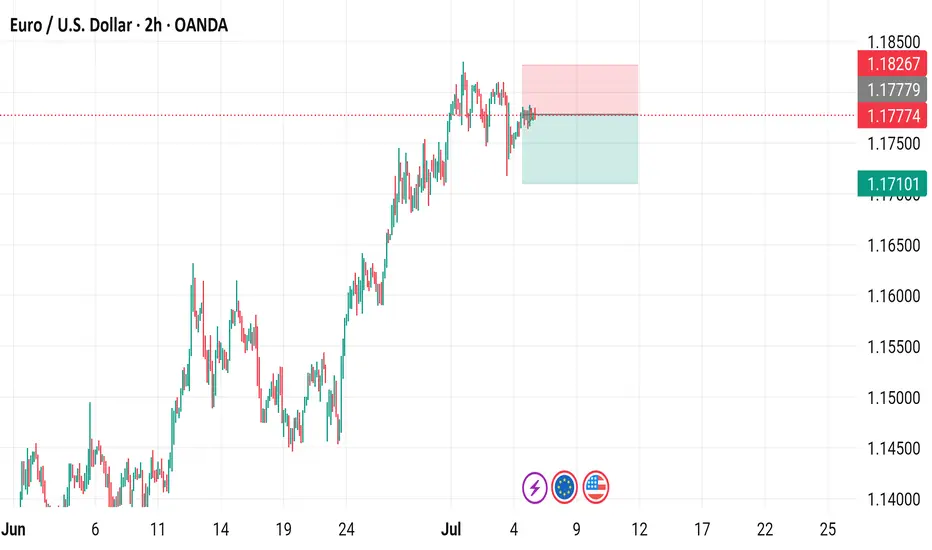
EURUSD - Looking for the RTLooking for the RT on the upper supply zone, long term target for EURUSD is 1.200-1.2200. However, on RT we can potentially expect a larger pull back but will analyse PA.

Euro / U.S. Dollar - 2h Chart (OANDA)2-hour candlestick chart of the EUR/USD currency pair from OANDA, showing the exchange rate trend from late June to July 07, 2025. The current rate is 1.17774, with a 0.00200 (0.17%) increase. The chart highlights a recent trading range between 1.17774 (sell) and 1.17824 (buy), with a notable upward movement in the past few hours.
Where the coffee is strong (EUR/USD)Setup
EUR/USD is in a strong uptrend and recently broke above multi-year resistance just under 1.16. The pair looks to be targeting long term resistance at 1.23.
Signal
RSI is dropping back from overbought territory on the daily chart, offering a possible dip-buying opportunity above resistance-turned-support at 1.16.

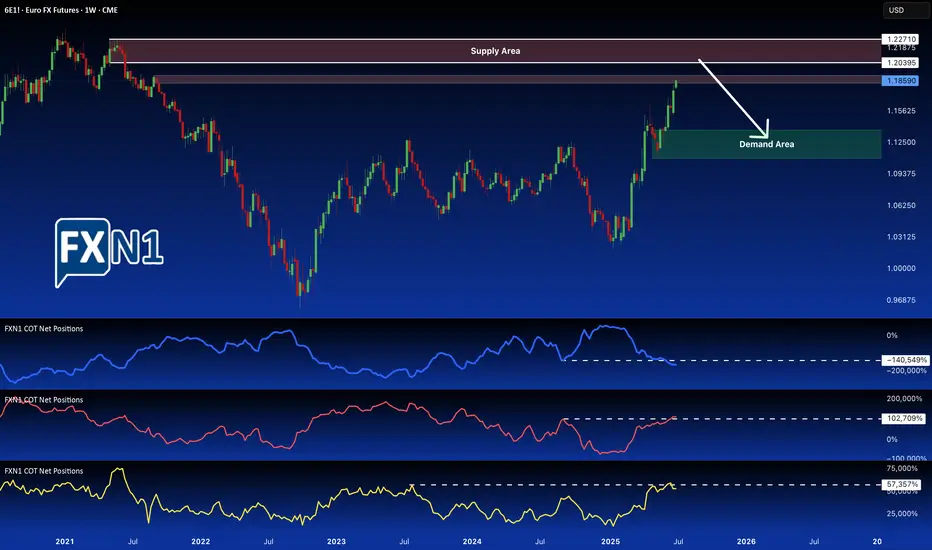
EUR/USD (6E1!) Nears Critical Monthly Supply ZoneThe EUR/USD futures (6E1!) are currently trading at 1.1858, already inside a key monthly supply zone. With price action approaching higher resistance levels, traders should prepare for potential reversals—especially near the 1.20395 – 1.22710 range, where a major bearish reaction could unfold.
Key Technical Levels to Watch
Current Price: 1.1858, testing the lower bounds of a monthly supply zone.
Weekly Supply Areas: Highlighted on the chart, signaling potential selling pressure ahead.
Primary Target Zone for Shorts: 1.21240 – 1.22710 (within the broader 1.20395 – 1.22710 range).
Breakout Scenario: A sustained move above 1.22710 could invalidate the bearish structure, targeting 1.2400+.
COT Report Reveals Market Sentiment Shifts
The latest Commitment of Traders (COT) report shows:
Commercials (Smart Money): Accumulating bearish positions, suggesting institutional hedging at these levels.
Non-Commercials (Large Speculators): Still bullish but stagnant—no major additions or reductions in exposure.
Retail Traders: Remain bullish, often a contrarian signal when Commercials are increasing shorts.
This setup suggests that while momentum is still upward, the lack of new buying from Non-Commercials and Commercials increasing shorts could lead to a reversal.
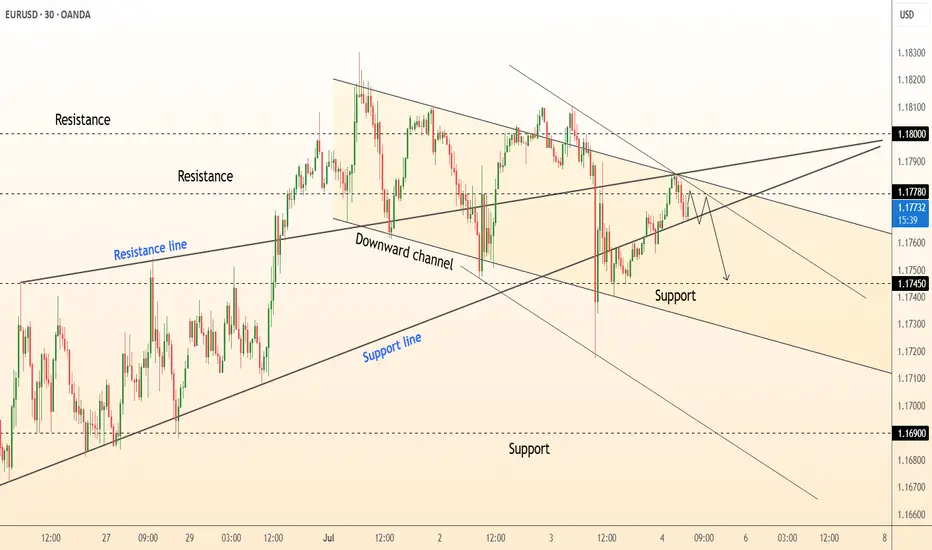
DeGRAM | EURUSD downturn in the channel📊 Technical Analysis
● Price is capped by a confluence of the June-July down-sloping channel roof and the former median resistance line at 1.1780; the last three candles form lower highs inside a micro bear-flag.
● Intraday structure now leans on the 1.1745–1.1750 support cluster: a break beneath this shelf completes the flag and exposes the channel floor/June pivot at 1.1690.
💡 Fundamental Analysis
● Pre-NFP dollar demand is rebuilding as ADP and ISM-services beat consensus, while French election uncertainty revives euro risk premium.
✨ Summary
Sell 1.1775 ± 5 pips; sustained trade below 1.1745 targets 1.1690. Short thesis void if 30-min candle closes above 1.1800.
-------------------
Share your opinion in the comments and support the idea with a like. Thanks for your support!
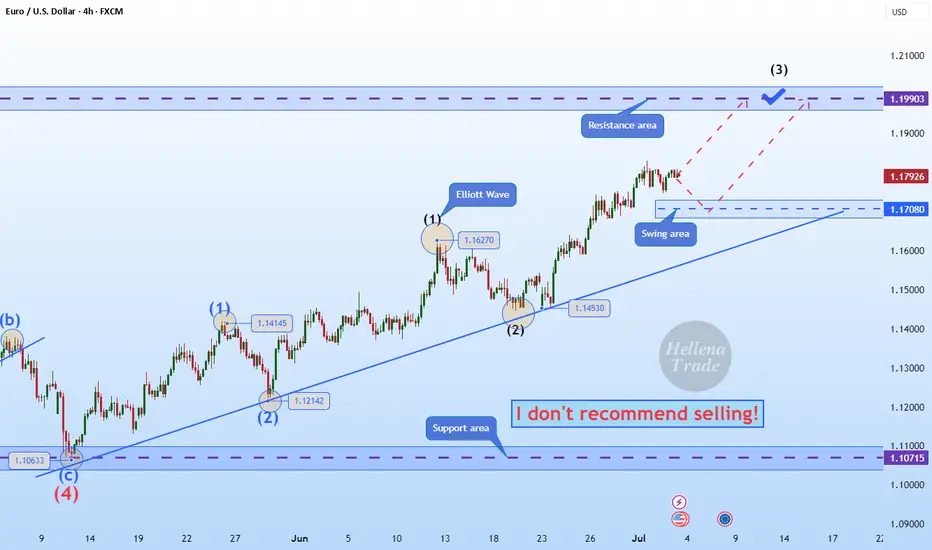
Hellena | EUR/USD (4H): LONG to the resistance area 1.20000.Colleagues, I believe that the upward impulse is not over yet. Wave “3” of the higher order and wave “3” of the lower order are just completing their movement, and I think that at the moment it is worth looking at the resistance area of 1.20000.
This is a very attractive psychological level where wave “3” could complete its upward movement.
Manage your capital correctly and competently! Only enter trades based on reliable patterns!
EURUSD Will Go Higher From Support! Long!
Take a look at our analysis for EURUSD.
Time Frame: 1h
Current Trend: Bullish
Sentiment: Oversold (based on 7-period RSI)
Forecast: Bullish
The market is on a crucial zone of demand 1.172.
The oversold market condition in a combination with key structure gives us a relatively strong bullish signal with goal 1.177 level.
P.S
We determine oversold/overbought condition with RSI indicator.
When it drops below 30 - the market is considered to be oversold.
When it bounces above 70 - the market is considered to be overbought.
Disclosure: I am part of Trade Nation's Influencer program and receive a monthly fee for using their TradingView charts in my analysis.
Like and subscribe and comment my ideas if you enjoy them!
Bearish reversal off Fibonacci confluence?The Fiber (EUR/USD) is rising towards the pivot and could reverse to the 1st support.
Pivot: 1.1905
1st Support: 1.1577
1st Resistance: 1.2152
Risk Warning:
Trading Forex and CFDs carries a high level of risk to your capital and you should only trade with money you can afford to lose. Trading Forex and CFDs may not be suitable for all investors, so please ensure that you fully understand the risks involved and seek independent advice if necessary.
Disclaimer:
The above opinions given constitute general market commentary, and do not constitute the opinion or advice of IC Markets or any form of personal or investment advice.
Any opinions, news, research, analyses, prices, other information, or links to third-party sites contained on this website are provided on an "as-is" basis, are intended only to be informative, is not an advice nor a recommendation, nor research, or a record of our trading prices, or an offer of, or solicitation for a transaction in any financial instrument and thus should not be treated as such. The information provided does not involve any specific investment objectives, financial situation and needs of any specific person who may receive it. Please be aware, that past performance is not a reliable indicator of future performance and/or results. Past Performance or Forward-looking scenarios based upon the reasonable beliefs of the third-party provider are not a guarantee of future performance. Actual results may differ materially from those anticipated in forward-looking or past performance statements. IC Markets makes no representation or warranty and assumes no liability as to the accuracy or completeness of the information provided, nor any loss arising from any investment based on a recommendation, forecast or any information supplied by any third-party.

EURUSD H1 I Bearish Reversal Based on the H1 chart, the price is approaching our sell entry level at 1.1778, a pullback resistance.
Our take profit is set at 1.1758, an overlap support.
The stop loss is set at 1.180, a swing high resistance.
High Risk Investment Warning
Trading Forex/CFDs on margin carries a high level of risk and may not be suitable for all investors. Leverage can work against you.
Stratos Markets Limited (tradu.com ):
CFDs are complex instruments and come with a high risk of losing money rapidly due to leverage. 63% of retail investor accounts lose money when trading CFDs with this provider. You should consider whether you understand how CFDs work and whether you can afford to take the high risk of losing your money.
Stratos Europe Ltd (tradu.com ):
CFDs are complex instruments and come with a high risk of losing money rapidly due to leverage. 63% of retail investor accounts lose money when trading CFDs with this provider. You should consider whether you understand how CFDs work and whether you can afford to take the high risk of losing your money.
Stratos Global LLC (tradu.com ):
Losses can exceed deposits.
Please be advised that the information presented on TradingView is provided to Tradu (‘Company’, ‘we’) by a third-party provider (‘TFA Global Pte Ltd’). Please be reminded that you are solely responsible for the trading decisions on your account. There is a very high degree of risk involved in trading. Any information and/or content is intended entirely for research, educational and informational purposes only and does not constitute investment or consultation advice or investment strategy. The information is not tailored to the investment needs of any specific person and therefore does not involve a consideration of any of the investment objectives, financial situation or needs of any viewer that may receive it. Kindly also note that past performance is not a reliable indicator of future results. Actual results may differ materially from those anticipated in forward-looking or past performance statements. We assume no liability as to the accuracy or completeness of any of the information and/or content provided herein and the Company cannot be held responsible for any omission, mistake nor for any loss or damage including without limitation to any loss of profit which may arise from reliance on any information supplied by TFA Global Pte Ltd.
The speaker(s) is neither an employee, agent nor representative of Tradu and is therefore acting independently. The opinions given are their own, constitute general market commentary, and do not constitute the opinion or advice of Tradu or any form of personal or investment advice. Tradu neither endorses nor guarantees offerings of third-party speakers, nor is Tradu responsible for the content, veracity or opinions of third-party speakers, presenters or participants.
