EURUSD – Signs of Weakness, Risk of Trendline BreakEURUSD is showing signs of weakness after a strong rejection at the 1.16300 resistance zone — a level that previously acted as a distribution area. Despite a brief rebound driven by mixed PMI data, the Euro failed to maintain its momentum and is now turning lower.
If price breaks below the support zone around 1.15400 — which aligns with both the trendline and an old FVG — a deeper decline toward the 1.15000 level could be triggered. Continued failure to surpass the 1.16300 resistance would further strengthen the corrective pressure.
On the fundamental side, expectations for the ECB to hold rates steady and weaker-than-expected Eurozone data are dampening the Euro’s outlook. Meanwhile, the US Dollar remains firm on safe-haven demand, with upcoming US GDP and Core PCE data likely to drive short-term direction.
EURUSD

Fundamental Market Analysis for June 26, 2025 EURUSDThe EUR/USD pair continues to rise to 1.16800 during Thursday's Asian session. The US dollar (USD) is weakening against the euro (EUR) as investors worry about the future independence of the US Federal Reserve (Fed). Final data on US GDP growth for the first quarter will be in focus later on Thursday.
US President Donald Trump said on Wednesday that he is considering three or four potential candidates to replace Fed Chairman Jerome Powell. According to the Wall Street Journal, Trump may consider former Fed Governor Kevin Warsh, National Economic Council Director Kevin Hassett, and Treasury Secretary Scott Bessent. Other candidates include former World Bank President David Malpass and Fed Governor Christopher Waller.
This raises questions about a potential weakening of the Fed's independence and a possible decline in its authority, which undermines the dollar and creates favorable conditions for the major currency pair.
Across the Atlantic, European Central Bank (ECB) policymakers are concerned about the economic outlook due to Trump's tariff policy and geopolitical risks. Earlier this week, ECB policymaker François Villeroy de Galhau said that despite current conditions, further rate cuts are still possible. Statements by ECB policymakers may put pressure on the single currency in the near term.
Trading recommendation: BUY 1.16750, SL 1.16300, TP 1.17500
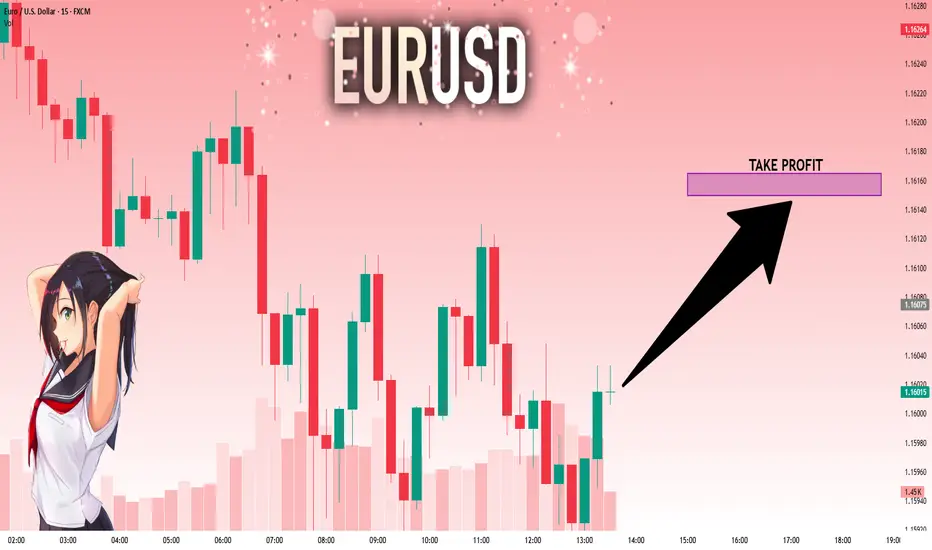
Bullish continuation for the Fiber?The price is falling towards the pivot point, which is a pullback support, and could bounce to the 1st resistance, which is also a pullback resistance.
Pivot: 1.1630
1st Support: 1.1591
1st Resistance: 1.1692
Risk Warning:
Trading Forex and CFDs carries a high level of risk to your capital and you should only trade with money you can afford to lose. Trading Forex and CFDs may not be suitable for all investors, so please ensure that you fully understand the risks involved and seek independent advice if necessary.
Disclaimer:
The above opinions given constitute general market commentary, and do not constitute the opinion or advice of IC Markets or any form of personal or investment advice.
Any opinions, news, research, analyses, prices, other information, or links to third-party sites contained on this website are provided on an "as-is" basis, are intended only to be informative, is not an advice nor a recommendation, nor research, or a record of our trading prices, or an offer of, or solicitation for a transaction in any financial instrument and thus should not be treated as such. The information provided does not involve any specific investment objectives, financial situation and needs of any specific person who may receive it. Please be aware, that past performance is not a reliable indicator of future performance and/or results. Past Performance or Forward-looking scenarios based upon the reasonable beliefs of the third-party provider are not a guarantee of future performance. Actual results may differ materially from those anticipated in forward-looking or past performance statements. IC Markets makes no representation or warranty and assumes no liability as to the accuracy or completeness of the information provided, nor any loss arising from any investment based on a recommendation, forecast or any information supplied by any third-party.

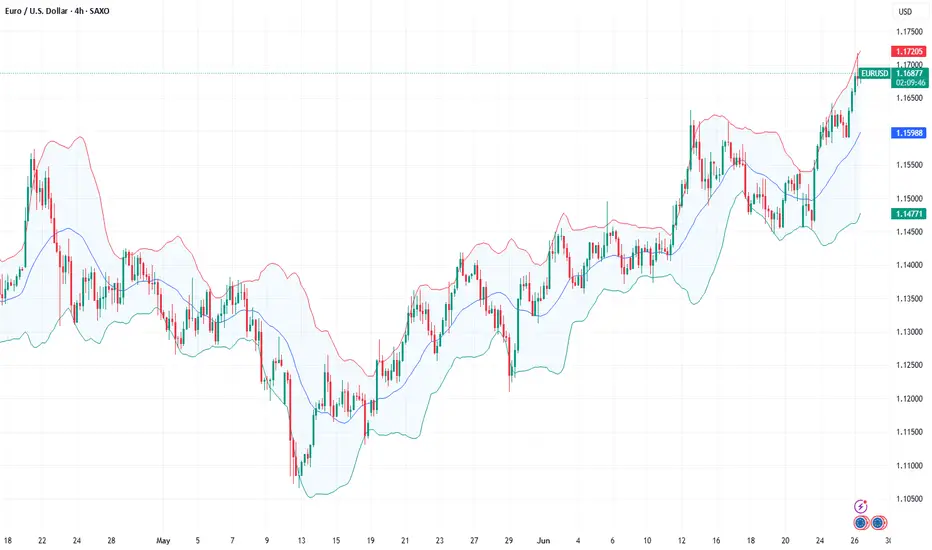
EUR/USD 4-Hour Chart (OANDA)4-hour price movement of the Euro/U.S. Dollar (EUR/USD) currency pair from OANDA, covering the period from June 19 to July 11, 2025. The current exchange rate is 1.16787, reflecting a 0.16% increase (+0.00189). The chart highlights a recent upward trend, with a notable price range between 1.15990 and 1.17335, and includes candlestick patterns and a highlighted resistance zone.

EURUSD Breakout and Potential RetraceHey Traders, in today's trading session we are monitoring EURUSD for a buying opportunity around 1.15700 zone, EURUSD was trading in a downtrend and successfully managed to break it out. Currently is in a correction phase in which it is approaching the retrace area at 1.15700 support and resistance area.
Trade safe, Joe.

EUR_USD BULLISH BREAKOUT|LONG|
✅EUR_USD is going up
Now and the pair made a bullish
Breakout of the key horizontal
Level of 1.1630 and the breakout
Is confirmed so we are bullish
Biased and we will be expecting
A further bullish move up
LONG🚀
✅Like and subscribe to never miss a new idea!✅
Disclosure: I am part of Trade Nation's Influencer program and receive a monthly fee for using their TradingView charts in my analysis.

USD under pressure ahead of PCE—gold holds $3,300The euro has reached its highest level since October 2021, driven in part by commitments from European leaders to increase NATO defence spending.
The swing factor for the euro dollar in the shorter term is the possibility of US rate cuts. Critical for this will be US inflation data, starting with tomorrow's PCE report. If tariffs fail to significantly lift inflation, the case for a July rate cut strengthens—adding further pressure on the dollar.
That weakness is also supporting gold. XAUUSD is above $3,300. Recent price action has formed a potential symmetrical triangle on the daily chart—a structure that can precede a breakout. A move above $3,400 could signal renewed bullish momentum.

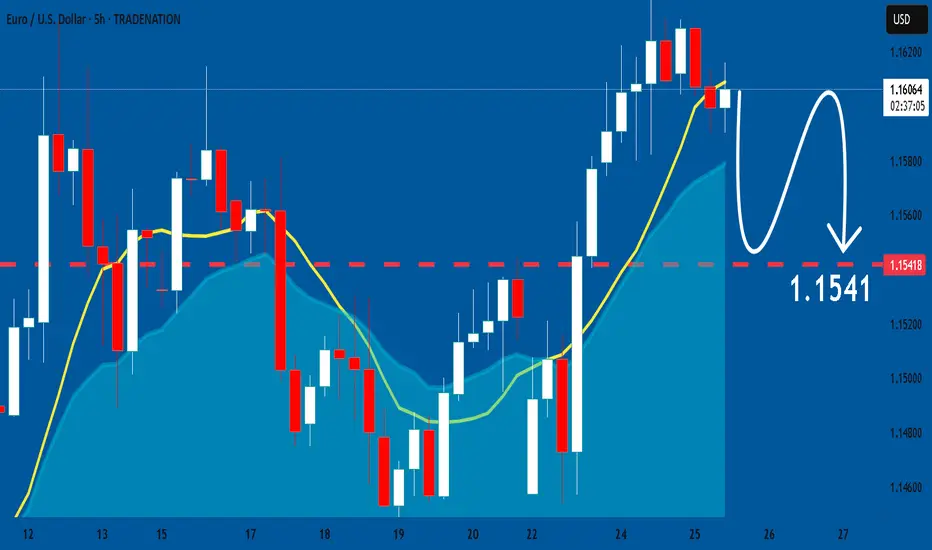
EURUSD Set To Fall! SELL!
My dear subscribers,
My technical analysis for EURUSD is below:
The price is coiling around a solid key level - 1.1521
Bias - Bearish
Technical Indicators: Pivot Points Low anticipates a potential price reversal.
Super trend shows a clear sell, giving a perfect indicators' convergence.
Goal - 1.1496
About Used Indicators:
By the very nature of the supertrend indicator, it offers firm support and resistance levels for traders to enter and exit trades. Additionally, it also provides signals for setting stop losses
Disclosure: I am part of Trade Nation's Influencer program and receive a monthly fee for using their TradingView charts in my analysis.
———————————
WISH YOU ALL LUCK
$DXY Repeating 2016 Post-Election I have highlighted the 2016 to 2020 Presidential Elections time period and then pasted that timeframe onto the 2024 election and found that the pattern is going along very similarly to Trump 1.0.
If we assume that the future unfolds the same as last time, which is low probability, of course, then the future will unfold as shown in the yellow bars going into the future, as shown.
Initially in 2016 post election there was a 7% rally in the U.S. Dollar Index and then a 15% retreat for the following year. So far in 2025 we have seen the same rally and a similar decline, but only faster this time.
It would appear as thought the bulk majority of the declines in the TVC:DXY are over at this time with perhaps 4% further downside over the balance of the year.
The Dollar Index has been useful for predicting changes in the earnings estimates for the S&P500 in the USA due to the high percentage of earnings coming back to the US for quarterly reporting. I have posted a few charts in the past which have been helpful at determining the risk in the stock market.
The behavior of the global central banks has certainly had its impact on monetary aggregates and inflation. The policy response since the Covid Pandemic has been for maximum liquidity and maximum Government spending to keep the global economy afloat. The post-Covid response is now coming to a head along with new policy directives to cut wasteful Government spending and to reduce inflation (caused the Gov't spending).
Global investors have flocked to the US for access to high technology stocks and have driven up the value of US assets to extreme levels compared to other markets. This adjustment phase where investors remove money from overvalued, or highly valued, US assets back to other markets has created a wave of selling in the US Dollar and US listed equities.
What does the future hold? We never know but we sure can learn from what happened in the past by looking at charts just like this one to see what may happen. Looks like a bounce in the TVC:DXY from here, followed by a new low and then a rebound into the next few years.
All the best,
Tim
April 22, 2025 1:16PM EST TVC:DXY 98.78 last

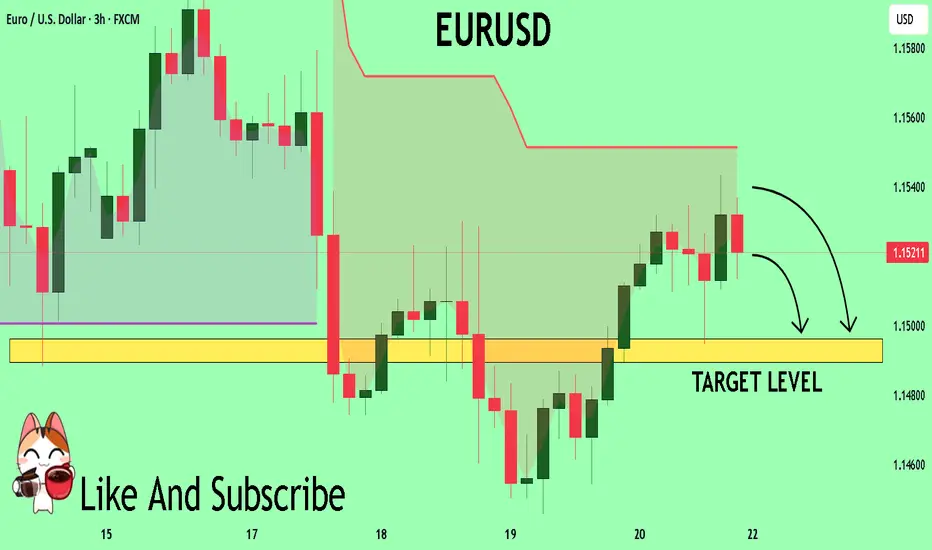
EURUSD: Expecting Bearish Continuation! Here is Why:
The recent price action on the EURUSD pair was keeping me on the fence, however, my bias is slowly but surely changing into the bearish one and I think we will see the price go down.
Disclosure: I am part of Trade Nation's Influencer program and receive a monthly fee for using their TradingView charts in my analysis.
❤️ Please, support our work with like & comment! ❤️
EURUSD: Strong Growth Ahead! Long!
My dear friends,
Today we will analyse EURUSD together☺️
The in-trend continuation seems likely as the current long-term trend appears to be strong, and price is holding above a key level of 1.16017 So a bullish continuation seems plausible, targeting the next high. We should enter on confirmation, and place a stop-loss beyond the recent swing level.
❤️Sending you lots of Love and Hugs❤️
EUR/USD BEARS WILL DOMINATE THE MARKET|SHORT
EUR/USD SIGNAL
Trade Direction: short
Entry Level: 1.161
Target Level: 1.141
Stop Loss: 1.174
RISK PROFILE
Risk level: medium
Suggested risk: 1%
Timeframe: 10h
Disclosure: I am part of Trade Nation's Influencer program and receive a monthly fee for using their TradingView charts in my analysis.
✅LIKE AND COMMENT MY IDEAS✅

Can it Reach New Highs as USD Weakens?EUR/USD: Euro's Resilience Holds Strong – Can it Reach New Highs as USD Weakens?
🌍 Macro Landscape: EUR/USD Rides Risk-On Sentiment and Fed Cut Hopes
The Euro (EUR) is showing significant strength, maintaining its position near a three-year high against the US Dollar (USD). This resilience is largely fueled by a moderately positive risk appetite in the market.
Simultaneously, the US Dollar is facing considerable downward pressure. This weakness stems from recent weaker-than-expected economic data from the United States and increasing market expectations for the Federal Reserve (Fed) to implement interest rate cuts. If US economic indicators continue to soften, it could solidify the case for earlier Fed rate cuts, further undermining the USD and potentially boosting EUR/USD.
🏦 Central Bank Policy: Diverging Paths for ECB and Fed
Federal Reserve (Fed): The market is increasingly pricing in the likelihood of Fed interest rate cuts. Weaker US data strengthens this narrative, as the Fed might be compelled to ease monetary policy to support economic growth. This dovish outlook for the Fed is a key driver of USD weakness.
European Central Bank (ECB): While the provided information focuses on the EUR's strength due to broader market sentiment and USD weakness, the ECB's more measured approach to monetary policy compared to the Fed's potential easing can create a favorable interest rate differential for the Euro, attracting capital flows.
This divergence in central bank policy expectations—with the Fed leaning towards cuts and the ECB maintaining a more cautious stance—creates a tailwind for the EUR/USD pair.
🌐 Capital Flows: Money Favors Euro Amidst USD Softness
Global capital flow models suggest that funds are increasingly moving towards assets perceived as offering better relative value or stability. As US yields become less attractive due to anticipated Fed rate cuts, capital may flow out of USD-denominated assets.
This outflow from the USD naturally benefits currencies like the Euro, especially given its current positive momentum driven by a moderate risk-on environment. The re-pricing of Fed policy risk directly influences these capital movements, contributing to the upward trajectory of EUR/USD.
📊 Technical Structure (H4 Chart Analysis): EUR/USD Eyes Key Resistance Levels
Based on the provided EUR/USD H4 chart:
Uptrend intact: The pair continues to exhibit a positive trend, characterized by higher lows and higher highs within an ascending channel.
Key Resistance Levels:
Initial Resistance: 1.16330. This level aligns with recent highs and the top of the minor channel. A break above this suggests further bullish momentum.
Major Resistance Zone: 1.17031. This is indicated as a significant resistance area, potentially a long-term target or a reversal point. A break here would confirm strong bullish conviction.
Key Support Levels:
Immediate Support: 1.15470. This level has acted as a support point, aligning with the EMA 200 and a Fibonacci retracement level, indicating a potential bounce area.
Strong Support Zone: 1.15249. This zone represents a robust demand area, aligning with previous price action and serving as a crucial level for bulls to defend.
Moving Averages (EMA 13-34-89-200): The price is trading above the short-term and long-term EMAs, suggesting strong bullish momentum. The EMAs are fanning out and showing a bullish alignment, reinforcing the uptrend.
Projected Price Action: The chart suggests that the price might retrace towards the 1.15470 or 1.15249 support zones before resuming its upward trajectory towards the 1.16330 and potentially 1.17031 resistance levels.
🎯 Trade Strategy Recommendations:
Scenario 1 – BUY the Dip:
Entry: Look for bullish confirmation around 1.15470 - 1.15249.
Stop-Loss: Below 1.15100 (or a level below the 1.15249 support for risk management).
Take-Profit:
TP1: 1.15600
TP2: 1.15800
TP3: 1.16000
TP4: 1.16200
TP5: 1.16330 (Targeting the immediate resistance)
TP6: 1.16500
TP7: 1.16800
TP8: 1.17031 (Targeting the major resistance)
Scenario 2 – SELL the Rally (Counter-trend/Reversal):
Entry: Look for bearish confirmation around 1.16330 - 1.16400 or higher near 1.17031.
Stop-Loss: Above 1.16500 (or above 1.17100 if selling at higher resistance).
Take-Profit:
TP1: 1.16200
TP2: 1.16000
TP3: 1.15800
TP4: 1.15600
TP5: 1.15470 (Targeting the immediate support)
TP6: 1.15249 (Targeting the strong support zone)
⚠️ Key Events to Watch:
Upcoming US Economic Data: Any further weak data could solidify Fed rate cut expectations and weigh on the USD.
ECB Official Statements: Comments from ECB members on inflation or monetary policy could impact EUR's strength.
Global Risk Sentiment: A continued moderate risk-on environment will generally support the EUR against the USD.
Trade smart and stay informed! Wishing everyone a successful trading day!
EURUSD - Looking to the upside retest of SupplyLooking to the upside, first lets get that push to lower level of liquidity swing then a push to the upside. Only on bullish confirmation at our highlighted level. I think we have one more retest before catching a potential short (pullback) on the larger time frame. Long term target for EURUSD is 1.200.

Euro Falls Soon It is my opinion. EUR is too high. It should to be lesser than now. It needs to go down and wants touch their lovely supports.

EUR/USD Nears 1.1620 Before Powell’s TestimonyEUR/USD edged up to 1.1615 in early European trading on Wednesday, supported by improved risk sentiment after Israel and Iran signaled an end to their air conflict. The truce, backed by pressure from President Trump, increased appetite for risk assets, favoring the euro over the dollar.
All eyes are now on Fed Chair Jerome Powell, who reiterated on Tuesday that monetary policy will remain data-driven. However, comments from Kansas City Fed President Schmid hinted at caution due to tariff-driven inflation. While markets expect a rate cut in September, July odds have edged slightly higher.
Resistance is at 1.1630, while support is at 1.1530.

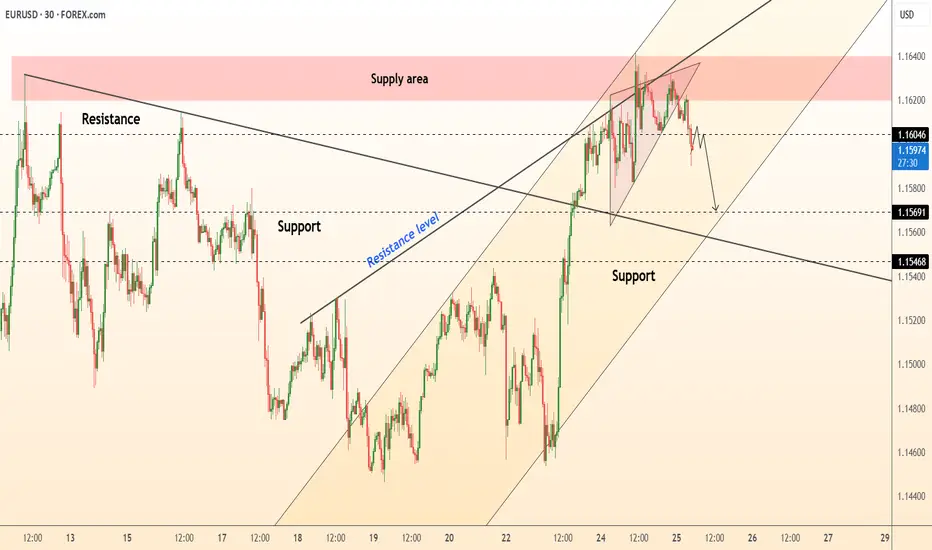
DeGRAM | EURUSD reached the supply area📊 Technical Analysis
● Price formed an intraday rising wedge right inside the 1.1615-1.1635 supply band; the wedge has broken lower and the last two candles closed back under the long-term trendline retest.
● Bearish follow-through is favoured while price stays below 1.1604; first magnet is the confluence of former breakout base and inner channel support at 1.1569, with 1.1547 (mid-June pivot) the next objective.
💡 Fundamental Analysis
● Fresh Euro-area PMIs dipped below consensus while U.S. consumer-confidence beat, widening the short-rate gap and reviving USD bids.
✨ Summary
Sell rallies ≤1.1600; targets 1.1569 → 1.1547. Bias invalid if 30-min candle closes above 1.1635.
-------------------
Share your opinion in the comments and support the idea with a like. Thanks for your support
EURUSD Approaching Liquidity Shelf — Watch for Reaction at 1.164EURUSD remains firmly bullish on all major timeframes, respecting the internal structure of an ascending channel.
• Daily: Price continues to respect both the red trendline and broader purple bullish channel. Buyers are defending the mid-line and pushing toward the upper boundary.
• 4H: Clear higher highs and higher lows. Price recently revisited and bounced off a 4H demand zone (1.14750–1.15000), and is now testing the liquidity zone at 1.16400.
• 1H: Microstructure shows consolidation and possible absorption of liquidity just beneath the 1.16415 high. A clean break and retest of this level may confirm continuation.
Key Levels:
• Resistance: 1.16415 (previous high and liquidity trap)
• Support: 1.14900 (4H demand zone)
• Daily trendline holding as dynamic support
Trade Plan:
• Longs: Await a break and retest of 1.16415 or a retracement to 1.15600 for a more discounted entry.
• Shorts: Not favored unless a strong bearish engulfing forms below 1.1600 with structure shift on the 1H.

Sell EURUSDI'm analyzing EURUSD, and on the 4-hour timeframe, the overall market is in an uptrend. In the 1-hour timeframe, a minor downtrend has been broken, and the price looks like it is showing reversal pattern and if the market breaks that reversal trend then I will look for sell till that red line.
If the market run as per my analysis then I will look for buy along with overall trend after sell.

Could the Fiber reverse from here?The price is reacting off the pivot which is a pullback resistance and could drop from this level to the 1st 50% Fibonacci support.
Pivot: 1.1631
1st Support: 1.1552
1st Resistance: 1.1677
Risk Warning:
Trading Forex and CFDs carries a high level of risk to your capital and you should only trade with money you can afford to lose. Trading Forex and CFDs may not be suitable for all investors, so please ensure that you fully understand the risks involved and seek independent advice if necessary.
Disclaimer:
The above opinions given constitute general market commentary, and do not constitute the opinion or advice of IC Markets or any form of personal or investment advice.
Any opinions, news, research, analyses, prices, other information, or links to third-party sites contained on this website are provided on an "as-is" basis, are intended only to be informative, is not an advice nor a recommendation, nor research, or a record of our trading prices, or an offer of, or solicitation for a transaction in any financial instrument and thus should not be treated as such. The information provided does not involve any specific investment objectives, financial situation and needs of any specific person who may receive it. Please be aware, that past performance is not a reliable indicator of future performance and/or results. Past Performance or Forward-looking scenarios based upon the reasonable beliefs of the third-party provider are not a guarantee of future performance. Actual results may differ materially from those anticipated in forward-looking or past performance statements. IC Markets makes no representation or warranty and assumes no liability as to the accuracy or completeness of the information provided, nor any loss arising from any investment based on a recommendation, forecast or any information supplied by any third-party.

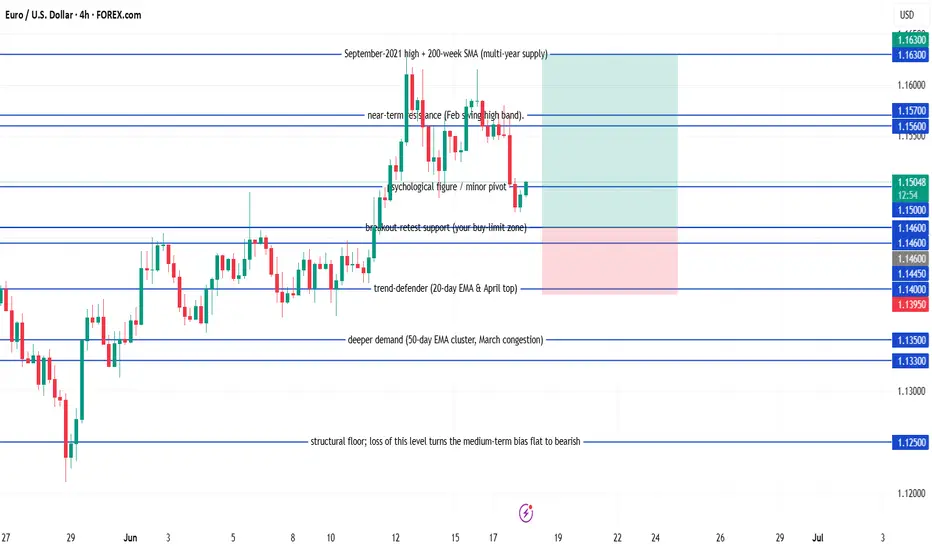
EUR/USD Buy EUR/USD pull-back long
Buy-limit at 1.1460
Stop-loss at 1.1395
Take-profit 1 at 1.1560 – when this first target is reached, move the stop to breakeven
Take-profit 2 at 1.1630
Condition: keep the order active only while the daily candle continues to close at or above 1.1445.
Expiry: if the order hasn’t been filled after five full trading days, cancel it and reassess.
EUR/USD 4-Hour Chart Analysis (ONDA)Euro/US Dollar (EUR/USD) exchange rate over a 4-hour interval, sourced from ONDA. The current rate is 1.16177, reflecting a 0.08% increase (+0.00093). The chart highlights a recent upward trend, with a resistance level around 1.16746 and a support zone between 1.15439 and 1.16000, as indicated by the shaded areas. The time frame covers late June to early July 2025.

Fed speak - Not broken, not cutting “Don’t fix what isn’t broken” seems to be the Fed’s current stance. Two Fed officials made that clear over the last 24 hours.
Vice Chair for Supervision Michael Barr warned that tariffs could fuel inflation by lifting short-term expectations, triggering second-round effects, and making inflation more persistent.
New York Fed President John Williams echoed that view, noting that tariff-driven inflation is “likely to get stronger in the months ahead.” He also called policy “well positioned” and said the Fed needs more data before making any move.
EUR/USD has formed a rising wedge pattern on the daily chart—typically a bearish structure that warns of a potential reversal. Price action has narrowed, building two clear tops. The downside target from the wedge could potentially be 1.1066 initially, and possibly down to 1.0732 if bearish momentum accelerates.
