ECB’s De Guindos Sees Balanced Inflation RisksEuropean Central Bank Vice President Luis de Guindos said Monday that the EUR/USD at 1.15 does not hinder the ECB’s inflation goal, noting the euro’s gradual rise and stable volatility.
He stated inflation risks are balanced, with little chance of falling short of the target, and that markets have clearly understood the ECB’s recent policy signals. De Guindos reaffirmed the ECB is close to its inflation objective
Looking ahead, he warned that tariffs could slow growth and inflation in the medium term but expressed confidence in the Fed maintaining swap line arrangements. He also confirmed there have been no discussions about repatriating gold reserves from New York.
At the time, EUR/USD was down 0.09%, trading near 1.1537.
Resistance is located at 1.1580, while support is seen at 1.1460.
EURUSD

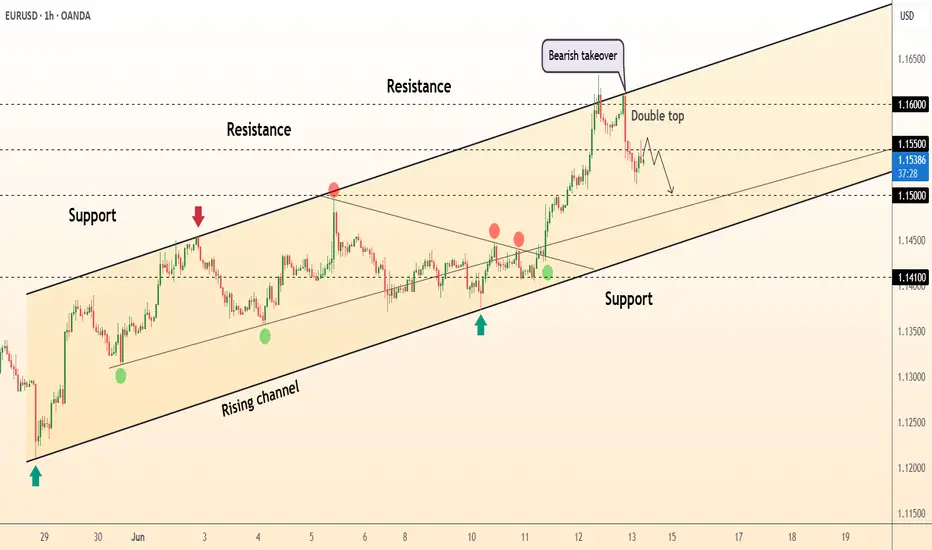
DeGRAM | EURUSD formed the double top📊 Technical Analysis
● A double-top printed at the channel roof (≈ 1.1600) and a bearish engulfing candle signal exhaustion; price is slipping back inside last week’s inner trend-median, turning 1.1550 into fresh resistance.
● Hourly RSI diverged lower and the grey return line from 1 June has broken; pattern depth points to 1.1500 support, with the channel mid-band / former triangle apex near 1.1470 as the next magnet.
💡 Fundamental Analysis
● Post-CPI profit-taking meets cautious ECB rhetoric: Lagarde reiterated “no preset easing path,” yet money-markets still price two Fed cuts by year-end, inviting near-term dollar reprieve.
✨ Summary
Short 1.1540-1.1560; break below 1.1520 targets 1.1500 → 1.1470. Bear view void on an H1 close above 1.1600.
-------------------
Share your opinion in the comments and support the idea with like. Thanks for your support!
EURUSD SHORT FORECAST Q2 W25 D16 Y25EURUSD SHORT FORECAST Q2 W25 D16 Y25
Professional Risk Managers👋
Welcome back to another FRGNT chart update📈
Diving into some Forex setups using predominantly higher time frame order blocks alongside confirmation breaks of structure.
Let’s see what price action is telling us today!
💡Here are some trade confluences📝
✅Weekly order block
✅15' order block
✅1 hour order block
✅Tokyo ranges to be filled
🔑 Remember, to participate in trading comes always with a degree of risk, therefore as professional risk managers it remains vital that we stick to our risk management plan as well as our trading strategies.
📈The rest, we leave to the balance of probabilities.
💡Fail to plan. Plan to fail.
🏆It has always been that simple.
❤️Good luck with your trading journey, I shall see you at the very top.
🎯Trade consistent, FRGNT X

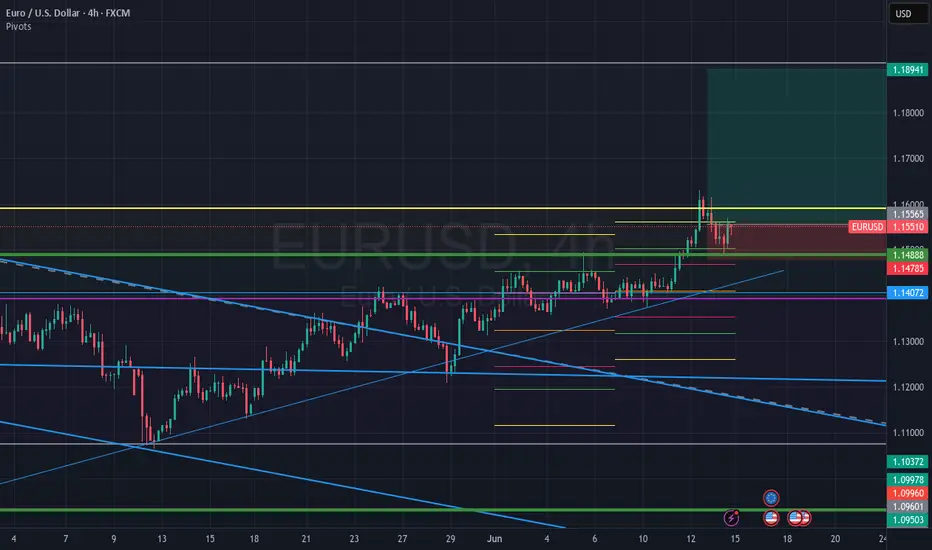
Bullish continuation?The Fiber (EUR/USD) is falling towards the pivot which acts as a pullback support and could bounce to the 1st resistance that lines up with the 127.2% Fibonacci resistance.
Pivot: 1.1447
1st Support: 1.1210
1st Resistance: 1.1712
Risk Warning:
Trading Forex and CFDs carries a high level of risk to your capital and you should only trade with money you can afford to lose. Trading Forex and CFDs may not be suitable for all investors, so please ensure that you fully understand the risks involved and seek independent advice if necessary.
Disclaimer:
The above opinions given constitute general market commentary, and do not constitute the opinion or advice of IC Markets or any form of personal or investment advice.
Any opinions, news, research, analyses, prices, other information, or links to third-party sites contained on this website are provided on an "as-is" basis, are intended only to be informative, is not an advice nor a recommendation, nor research, or a record of our trading prices, or an offer of, or solicitation for a transaction in any financial instrument and thus should not be treated as such. The information provided does not involve any specific investment objectives, financial situation and needs of any specific person who may receive it. Please be aware, that past performance is not a reliable indicator of future performance and/or results. Past Performance or Forward-looking scenarios based upon the reasonable beliefs of the third-party provider are not a guarantee of future performance. Actual results may differ materially from those anticipated in forward-looking or past performance statements. IC Markets makes no representation or warranty and assumes no liability as to the accuracy or completeness of the information provided, nor any loss arising from any investment based on a recommendation, forecast or any information supplied by any third-party.

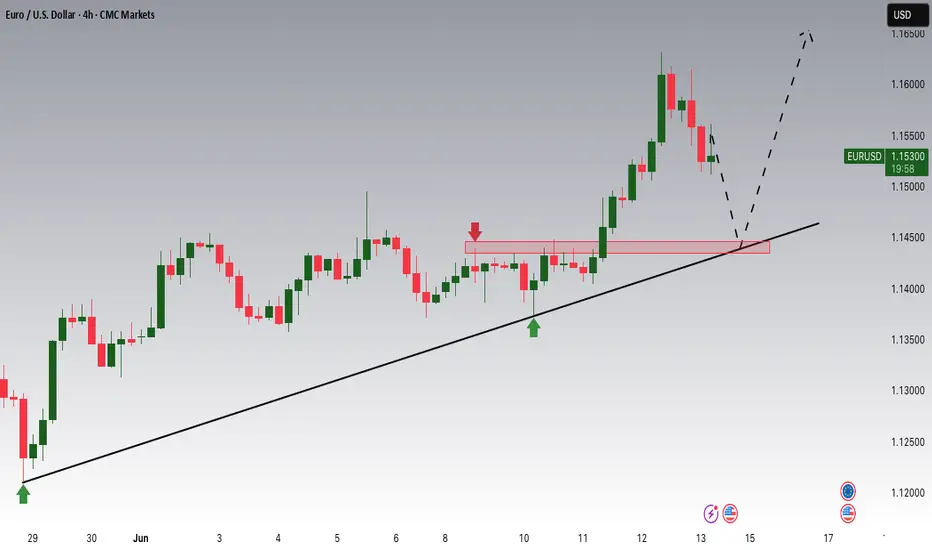
Opportunity for buying EURUSDEURUSD touched strong support, so I think it will rise further, as shown.

Still keeping a close eye on a potential USD pop...Although the EUR/USD and GBP/USD popped higher late last week, I'm still keeping a close eye to stay short on the EUR/USD considering the bearish rising broadening pattern coupled with a yearly pivot point inter-median level and negative divergence on the MACD. This is all based on the daily chart.
Many factors are in play right now with what's going on between Israel and Iran along with FOMC this week and Tariffs still in play.
On a purely technical analysis point of view, I potentially expect a bullish retracement in the USD while remaining long term bearish across the board.
we'll see how this one develops.
Good Luck & Trade Safe.

BTC update!!Good day traders, here is another update on BTC and I have adjusted my narrative but my overall bias is still remaining bearish…

Week of 6/15/25: EU AnalysisEU continues to have clean market structure and has all time frames aligned for bullish movement. Looking for price to retrace to the prime 1h POI for an A+ setup.
Major News:
FOMC - Wednesday

EURUSD Potential UpsidesHey Traders, in today's trading session we are monitoring EURUSD for a buying opportunity around 1.14500 zone, EURUSD is trading in an uptrend and currently is in a correction phase in which it is approaching the trend at 1.14500 support and resistance area.
Trade safe, Joe.
Forex Weekly Portfolio Selection – Top Trade SetupsWeekly Forex Portfolio Selection – H1 Chart Analysis
Using the Weekly & Daily Currency Strength Index, we’ve identified the strongest and weakest currencies to build a focused trading portfolio for the week.
📊 Currency Strength Ranking (1 = Weakest, 8 = Strongest):
EUR: 8
CHF: 7
CAD: 6
GBP: 5
AUD: 4
NZD: 3
USD: 2
JPY: 1
➡️ The Euro (EUR) is currently the strongest, while the Japanese Yen (JPY) is the weakest.
🔍 Analysed Pairs (H1 Timeframe):
EURJPY
EURUSD
CADJPY
GBPUSD
This selection focuses on high-probability setups aligned with trend and strength analysis.

GBPUSD – 1 Month Analysis (Long-Term Outlook)Strategy Used:
✔ Smart Money Concept (SMC)
✔ Elliott Wave Theory
✔ Wedge Pattern Breakout
---
🔍 Chart Overview:
The pair has completed a classic falling wedge pattern, hinting at a potential long-term bullish reversal.
Wave 5 completion suggests the start of a new cycle or correction (ABC).
Currently in a buyer-dominated zone, with momentum pushing towards the key supply area (seller zone) marked in blue.
A breakout above this zone could indicate continuation toward major highs, while rejection might trigger Wave C or a deeper corrective structure.
---
💡 Key Levels:
Immediate Support Zones:
1.2550 - 1.2700 (Buyer's Checkpoint)
1.2000 - 1.2200 (Deeper Buyer Interest)
Major Resistance / Supply Zone:
1.5500 - 1.6000
---
🧠 SMC Perspective:
Break of Structure (BoS) confirms bullish intent in multiple zones.
Expecting reaction from premium zone – either for continuation or smart money reversal.
---
🌀 Elliott Wave Outlook (Box Inset):
Current wave structure hints at a completed 5-wave impulsive decline.
Now in early stages of ABC correction.
Targeting Wave C to reach the major supply zone in the long-term.
---
📌 Summary:
A macro bullish opportunity is unfolding after years of consolidation and impulse decline. Keep eyes on higher timeframe confirmations and reactions at key zones. This chart aligns well with institutional footprints and macro price action logic.

EURUSD: Bearish Continuation is Highly Probable! Here is Why:
Remember that we can not, and should not impose our will on the market but rather listen to its whims and make profit by following it. And thus shall be done today on the EURUSD pair which is likely to be pushed down by the bears so we will sell!
Disclosure: I am part of Trade Nation's Influencer program and receive a monthly fee for using their TradingView charts in my analysis.
❤️ Please, support our work with like & comment! ❤️

EURUSD: FOMC meeting ahead Previous week on the US market was focused on inflation data. The inflation rate in May was standing at 0,1% for the month, below market expectations of 0,2%. At the same time the US core inflation was also below market estimate at the level of 0,1%, while the market forecasted 0,3% for the month. Inflation rate on a yearly basis in May was standing at 2,3% and core inflation was 2,8%. The Producers Price Index in May was at the level of 0,1% for the month, same as core PPI. Both figures were modestly below market estimates. University of Michigan Consumer Sentiment preliminary for June showed some modest relaxation in the inflation expectations. The indicator reached the level of 60,5 which was better from the market estimate of 53,5. The inflation expectations for this year at the beginning of June were standing at 5,1%, and were decreased from 6,6% posted previously. The five year inflation expectations modestly decreased from 4,2% to 4,1%.
During the previous week there has not been too much currently significant data posted for the Euro Zone and Germany, its largest economy. The wholesale prices in Germany in May dropped by -0,3% for the month, bringing the indicator to the level of 0,4% on a yearly basis. Both figures were in line with market forecasts. The balance of trade in the Euro Zone in April ended the month with a surplus of euro 9,9B, which was significantly below market estimate of euro 18,2B. The Industrial Production in the Euro Zone surprisingly dropped in April by -2,4% for the month, which was higher from estimated -1,7%. The IP on a yearly basis stands at 0,8% in April, again below market consensus of 1,4%.
Although the inflation in the US is evidently slowing down, as well as long term inflation expectations, still, newly emerged tensions in the Middle East made investors prefer long positions in gold rather than USD. In this sense, USD weakened as of the end of the previous week to the lowest weekly level against euro at 1,1624. Still, the currency pair closed the week at 1,1553. The RSI has not reached the clear overbought market side, reaching the highest level at 66. This leaves some space for eurusd to move further to the higher grounds until the clear overbought market side is reached. The MA50 continues to strongly diverge from MA200, without an indication that the potential cross is near in the future.
Usually after a strong push of financial assets toward one side, follows the time when the market is searching the equilibrium level. Depending on further developments on the Middle East crisis, there is a potential that eurusd will start the week ahead with a modest consolidation. The 1,15 resistance line was clearly breached during the previous week, indicating probability that the currency pair will revert a bit back to test for one more time this level. On the opposite side, the 1,16 was shortly tested, but the potential for further upside will depend on weekly fundamentals. The most important event for the week ahead is scheduled for Wednesday, June 16th, when the FOMC meeting is scheduled, as well as US economic projections. This day will most certainly bring some higher volatility on markets. Currently, it is widely expected that the Fed will hold interest rates unchanged at this meeting, and leave the planned rate cut for September. However, what the market is expecting to hear are projections for the future period, especially how the Fed perceives the impact of implemented trade tariffs on the US economy.
Important news to watch during the week ahead are:
EUR: ZEW Economic Sentiment Index for Germany in June, Inflation rate final in May for the Euro Zone, PPI in Germany in May, HCOB Manufacturing PMI flash in June, in both Germany and the Euro Zone,
USD: Retail Sales in May, Industrial Production in May, Building Permits preliminary in May, Housing starts in May, the FOMC meeting and interest rate decision will be held on Wednesday, June 18th, the FOMC economic projections will be posted the same day, Fed press conference after the FOMC meeting on Wednesday. The week ends with data regarding Existing Home Sales in May on Friday.

Currency Pairs. Part 2. Weekly OutlookExpecting massive expansion on DXY and major meltdown on Euro and Pound

EURUSD WEEKLY HTF FORECAST Q2 W25 Y25EURUSD WEEKLY HTF FORECAST Q2 W25 Y25
Professional Risk Managers👋
Welcome back to another FRGNT chart update📈
Diving into some Forex setups using predominantly higher time frame order blocks alongside confirmation breaks of structure.
💭NOTE- If price closes above the key weekly/ daily order block with daily close- re evaluation will be required.
🔑 Remember, to participate in trading comes always with a degree of risk, therefore as professional risk managers it remains vital that we stick to our risk management plan as well as our trading strategies.
📈The rest, we leave to the balance of probabilities.
💡Fail to plan. Plan to fail.
🏆It has always been that simple.
❤️Good luck with your trading journey, I shall see you at the very top.
🎯Trade consistent, FRGNT X

EURUSD ANALYSIS - LONGPrice has successfully broken out of the falling wedge on both the daily and weekly charts, signaling strong bullish momentum. After hitting resistance around 1.1555 (61.8% Fib), we’re seeing a healthy pullback towards 1.1500-1.1488 support. As long as bulls defend 1.1400, I’m looking for continuation towards 1.1555 and 1.1894 swing targets. Watching price action closely at the current pullback zone for potential long entries.
EURUSD Buyers In Panic! SELL!
My dear subscribers,
EURUSD looks like it will make a good move, and here are the details:
The market is trading on 1.1441 pivot level.
Bias - Bearish
Technical Indicators: Both Super Trend & Pivot HL indicate a highly probable Bearish continuation.
Target - 1.1424
About Used Indicators:
The average true range (ATR) plays an important role in 'Supertrend' as the indicator uses ATR to calculate its value. The ATR indicator signals the degree of price volatility.
Disclosure: I am part of Trade Nation's Influencer program and receive a monthly fee for using their TradingView charts in my analysis.
———————————
WISH YOU ALL LUCK

Euro can reach resistance line of channel and make correctionHello traders, I want share with you my opinion about Euro. Previously, price was trading inside a downward channel, gradually declining from the resistance line while forming a series of lower highs and lower lows. During that phase, sellers were clearly in control, and every attempt to grow was met with pressure near the channel’s upper boundary. However, that trend shifted once the price broke through the resistance line, confirming the end of the bearish momentum and the start of a new upward structure. After the breakout, EUR entered an upward channel, supported by multiple bullish impulses and consistent reactions near the support line. Price continued to rise, pushing through the support area and current support level around 1.1420. This upward movement showed strong bullish conviction, especially after the clean breakout and consolidation inside the channel body. Now the pair has approached the resistance line of the rising channel, where previous impulses typically slowed down or reversed. Given the channel geometry and past market behavior, I expect Euro to react to this upper boundary and move downward. For this reason, I set my TP at 1.1325, which aligns with the support line of the upward channel. Please share this idea with your friends and click Boost 🚀
Disclaimer: As part of ThinkMarkets’ Influencer Program, I am sponsored to share and publish their charts in my analysis.

EUR/USD Bulls in Control... But the Trap Is Set at 1.1600? 🇺🇸 EUR/USD – Technical & Macro Outlook
EUR/USD has posted an impressive rally over the past few weeks, driven by a combination of technical and macro factors. It is currently trading around 1.1586, right at the edge of a major supply zone where previous sharp rejections and reversals have taken place.
🔍 Technical Analysis
Price action remains within a well-defined ascending channel that began in mid-April, fueling the bullish move from the 1.07 lows.
The current daily candle is showing signs of exhaustion within the 1.1550–1.1600 resistance zone, with upper wicks and declining volume.
RSI is in a high-neutral zone but not yet overbought, leaving room for more upside — but also increasing the probability of a technical pullback.
🔁 Key Levels:
Primary resistance: 1.1600 (multi-touch supply area)
Support 1: 1.1460–1.1430 (previous resistance, now potential support)
Support 2: 1.1300–1.1270 (demand zone + channel base)
📉 COT Report – June 3, 2025
Non-Commercials (speculators) remain net-long with over 200,000 contracts, though both long (-1,540) and short (-4,830) positions saw reductions. This suggests a bullish structure with early signs of profit-taking.
Commercials are heavily net-short, with 575,000 short contracts versus 437,000 long — a structurally bearish stance from physical market participants.
Open interest increased significantly by +20,813, pointing to renewed speculative participation and potential volatility.
🧭 Retail Sentiment
Retail traders are heavily short (80%) with an average entry around 1.1253.
This contrarian behavior is typically supportive of continued upside pressure — especially if price holds above key supports.
📅 Seasonality – June
Historical averages over 10, 15, and 20 years show a slightly bullish tendency in June.
The 2- and 5-year patterns suggest more neutral to mildly bearish behavior.
This supports a consolidation or corrective pullback, without ruling out higher moves during the summer rally.
🎯 Trading Conclusion
Current bias: Moderately bullish, with rising pullback risks near 1.1600
Possible setup: Tactical short between 1.1580–1.1610 if confirmed by bearish price action
Target: 1.1430–1.1300
Bullish scenario remains valid unless we break below 1.1270
📌 Summary
The bullish trend is strong but technically extended. Speculative positions remain net-long but are starting to unwind. The retail crowd is still betting against the move, which favors bulls. However, structural resistance calls for caution — a pullback could be imminent.

Massive GBP/USD Reversal Ahead? Head & Shoulders FormationGBP/USD is at a critical technical juncture following a sharp bullish impulse that pushed the pair above the 1.34 handle, printing a strong weekly bullish engulfing candle and breaking out of a multi-week consolidation zone. This move unfolded in a macro context where the U.S. Dollar Index (DXY) is showing clear signs of weakness, with Non-Commercial net long positions dropping drastically—from around 20,000 to less than 5,000 contracts. This shift points to a fading speculative appetite for the dollar, historically a leading indicator of upcoming corrective phases or broader declines in the DXY.
On the flip side, the Commitments of Traders (COT) report on the British Pound reveals that Non-Commercials (typically hedge funds and asset managers) remain net long on GBP, with a slight increase week-over-week. However, Commercials (generally institutions and hedgers) have aggressively built up a significant net short position—levels that in the past preceded major reversals on the pair. This divergence between speculators and institutional hedgers suggests short-term bullish potential, but with rising risk of exhaustion near current resistance levels.
Adding fuel to this outlook is the retail sentiment: approximately 63% of retail traders are currently short GBP/USD, with an average entry price around 1.3021. This kind of retail crowd positioning, typically inefficient from a historical perspective, adds contrarian support for further upside, as long as price holds above the 1.3340 structure.
From a seasonality perspective, June tends to be a mildly bullish-to-sideways month for GBP/USD, especially when looking at the 10- and 15-year seasonal averages. While the seasonal bias is not particularly strong, there’s also no statistical downward pressure this time of year, leaving room for technically-driven moves influenced by liquidity and sentiment rather than macro patterns alone.
On the technical front, the daily chart shows a steep rally capped by a large green candle on Monday, breaking cleanly through the 1.34 resistance zone. The price is now hovering inside a key supply area between 1.3499 and 1.3550—a historically reactive zone that has triggered major rejections in previous months. How price reacts here will likely shape the next major swing. A confirmed breakout and consolidation above 1.3550 would open the door for an extension toward 1.37–1.3750. Conversely, a sharp rejection followed by a break below 1.3412—and especially under 1.3340—would set the stage for a deeper correction toward 1.3170.
The RSI is currently showing early signs of momentum loss, although no strong bearish divergence has emerged yet. This implies that the pair could still fuel another push higher before running out of steam—possibly forming the right shoulder of a head & shoulders pattern if the rejection scenario plays out.

GBPJPY At the Top? Massive Liquidity Grab📈 1. Price Action & Key Technical Levels (Daily Chart)
Price reached a major supply zone between 196.0 and 197.0, showing clear rejection (weekly pin bar and a lower high structure relative to the previous peak).
The long-term descending trendline acted as resistance again.
A confirmed rising wedge pattern broke to the downside, with first target around 191.4, and extended target near 187.4 (key demand zone with historical confluence).
Weekly RSI shows a bearish divergence vs price highs – an additional signal of bullish exhaustion.
📊 2. COT Data (as of June 3, 2025)
GBP (British Pound)
Net long positions increased by +30,371 contracts (Commercial + Non-Commercial).
Non-Commercials: 103,672 long vs 68,457 short → net long +35,215 but the increase is relatively modest.
Commercials are increasing both long and short positions, but the net delta supports medium-term GBP resilience.
JPY (Japanese Yen)
Net short worsened by -13,566 contracts.
Non-Commercials are cutting longs and adding shorts → aggressive yen selling.
Commercials remain heavily short (275,659 vs 100,151 long).
➡️ COT Conclusion: GBP remains structurally strong, but the JPY is now extremely oversold, increasing the likelihood of a technical correction in favor of JPY (GBPJPY pullback).
📉 3. Retail Sentiment
72% of retail traders are short GBPJPY, with an average entry at 191.2.
Current price is above 195.8 → a liquidity sweep above retail shorts may have already occurred.
The order book shows a heavy sell cluster between 195.0–195.9 → potential zone of manipulation/liquidation.
➡️ Contrarian view: After sweeping liquidity above retail highs, we may now see downside pressure to clean out breakout longs.
📅 4. Seasonality
June tends to be neutral to bearish:
5-year average: +0.45% (weak gain)
10- and 15-year averages: -1.24% and -1.30%
Historically, the first 10 days of June often mark a local top, followed by a decline – consistent with the current price structure.
🧠 5. Macro-Technical Confluence
The broader setup points to a distribution phase between 195.5–196.5, with high probability of a technical pullback toward 193.5–191.4 in the short-to-medium term.
The yen's oversold conditions may ease temporarily, supporting a corrective GBPJPY retracement.
Break below 193.5 would confirm the move toward 191.4 and eventually 187.4 – an area of institutional interest.
🔍 Trade Setup Summary (Bias: Bearish)
Technical context: Short setup confirmed by structure break, divergence, and supply rejection.
Macro/sentiment context: Supports a corrective pullback on the pair.
Strategy: Look for intraday weakness below 195.0–194.5 → targeting 193.5, then 191.4.
Invalidation: Daily/weekly close above 197.0.

NQ100 → Entering the Danger Zone?📈 1. Technical Context (Price Action & Structure)
The daily chart shows a strong bullish continuation from the 17,350 area, with price now extending toward the 22,000 USD zone.
We are currently within a weekly/monthly supply, with:
Mild RSI divergence in overbought conditions
Temporary rejection at 22,050–22,200
A potential liquidity sweep above highs before distribution or pullback
The monthly structure shows a strong swing low that may serve as anchor for a future reversal
🧠 2. COT Report – Commitment of Traders (as of June 3)
Commercials (Smart Money):
+4,041 long | +3,320 short → Net +1,455 → hedging phase, not trend expansion
Non-Commercials (Speculators):
–2,237 long | +125 short → net exposure reduction
Open Interest increasing → new positions building, but no extreme imbalance
📌 Conclusion: Tactical neutrality, slight bullish lean from commercials.
📆 3. Seasonality
June has been historically bullish, especially in the past 2 years (+700 pts avg)
10Y average still leans bullish
⚠️ September is a clear seasonal reversal month across all timeframes
📌 Conclusion: Seasonal tailwind through end of June; cyclic reversal risk into Q3.
📰 4. Macro Calendar
High-impact USD week:
CPI – Wed, June 11
PPI – Thu, June 12
These will be critical to:
Validate the disinflation narrative
Set expectations for a Fed cut by Sep/Nov
📌 Conclusion: Expect explosive mid-week volatility — watch for liquidity spikes above 22,000 if CPI surprises.
⚙️ Operational Outlook
✅ Primary scenario (bullish continuation):
🎯 Target: 22,260 → fib extension + structure
❌ Invalid below 21,350
🔄 Alternative scenario (mean reversion):
🔻 Short from 22,050–22,200
🎯 Target: 20,950 → liquidity + FVG zone
🔁 Trigger: weekly engulf or hotter-than-expected CPI

EURUSD Set To Fall! SELL!
My dear friends,
EURUSD looks like it will make a good move, and here are the details:
The market is trading on 1.1596 pivot level.
Bias - Bearish
Technical Indicators: Supper Trend generates a clear short signal while Pivot Point HL is currently determining the overall Bearish trend of the market.
Goal - 1.1533
About Used Indicators:
Pivot points are a great way to identify areas of support and resistance, but they work best when combined with other kinds of technical analysis
Disclosure: I am part of Trade Nation's Influencer program and receive a monthly fee for using their TradingView charts in my analysis.
———————————
WISH YOU ALL LUCK
