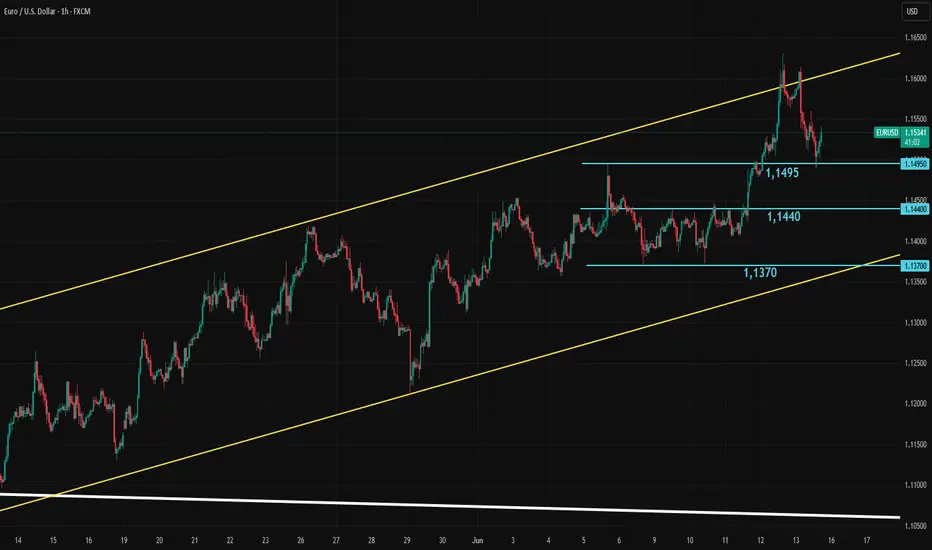
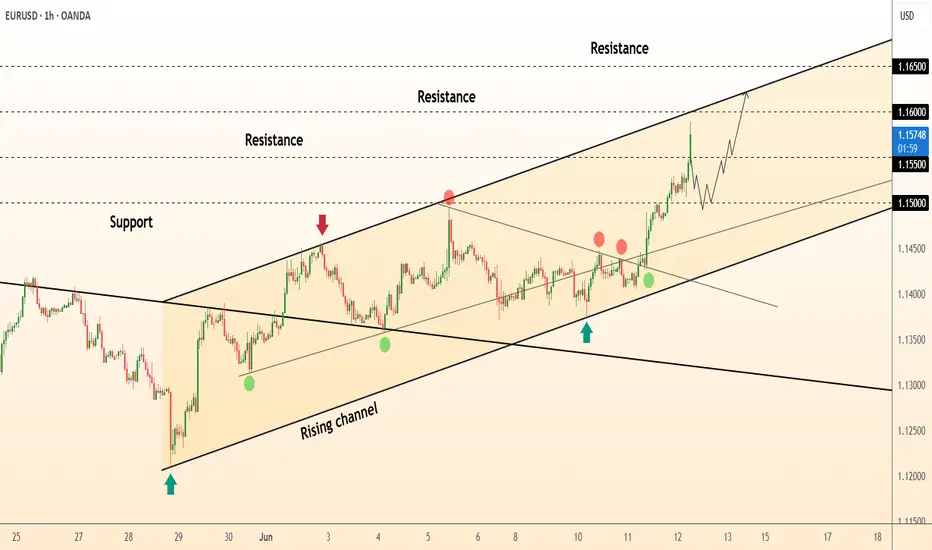
Rising Geopolitical Risk Could Pressure EURUSDEURUSD attempted to break the upper line of the trend channel yesterday, but with the start of the Israeli attack, a quick selloff followed. Rising geopolitical risks typically increase demand for U.S. debt and the dollar. As a result, EURUSD’s rally is facing short-term bearish pressure. The first key support level at 1.1495 is being tested. If it holds, there is a chance for another attempt at the upper line. However, if it breaks, 1.1440 and 1.1370 are the next support levels to watch in the short term.
EURUSD
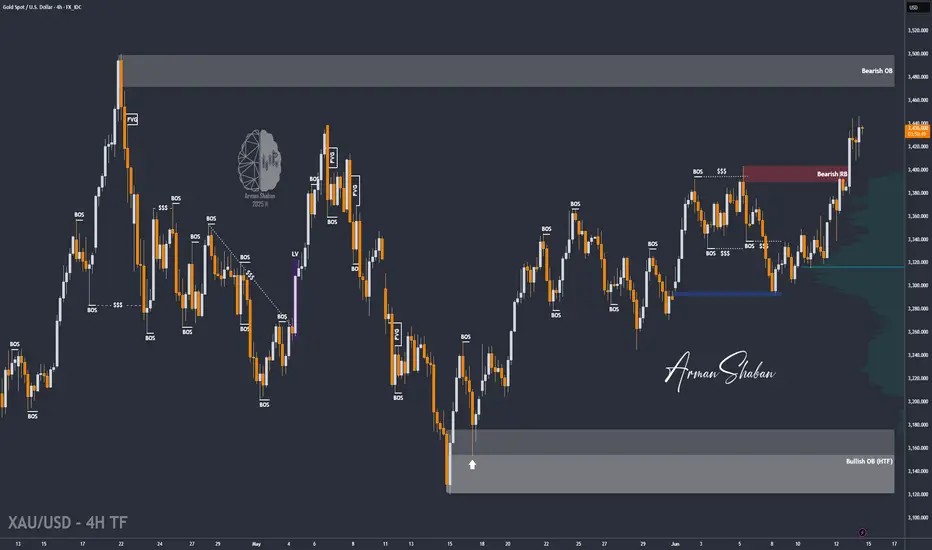
Gold Breaks $3400 – Targets $3500 Amid Tensions (READ)By analyzing the gold chart on the lower timeframe, we can see that today, following Israel's missile and airstrike attacks on Iran, gold experienced a sharp rally. As anticipated last night, gold finally managed to break through the strong $3400 resistance, surging over 600 pips to reach $3447.
Currently, gold is trading around $3438, and given the escalation in geopolitical tensions, I expect further upside movement.
The next potential targets are $3449, $3469, and possibly $3500.
⚠️ Due to ongoing conflict and extreme volatility, it's advised to avoid trading or proceed only with minimal risk exposure.
Please support me with your likes and comments to motivate me to share more analysis with you and share your opinion about the possible trend of this chart with me !
Best Regards , Arman Shaban
EURUSD: Bulls Will Push Higher
Remember that we can not, and should not impose our will on the market but rather listen to its whims and make profit by following it. And thus shall be done today on the EURUSD pair which is likely to be pushed up by the bulls so we will buy!
Disclosure: I am part of Trade Nation's Influencer program and receive a monthly fee for using their TradingView charts in my analysis.
❤️ Please, support our work with like & comment! ❤️

EUR/USD retracement line and go longHigh volumes before the start of a fair value gap at 1.1438 area. When price approaches I shall short and reverse into a long as the level is hit.

EURUSD !!! (Big move is loading)
📈 EUR/USD – Wave 4 Buy Opportunity (2H TF)
Published by Greenfireforex | June 13, 2025
The EUR/USD pair is completing a corrective Wave 4, retracing into a premium FVG (Fair Value Gap) demand zone between 1.1500–1.1475. Price tapped into a high-probability reversal block just below the psychological level of 1.1500, offering a potential long entry.
🔹 Technical Confluences:
Wave 4 corrective structure
Fair Value Gap (Buyers) zone
Liquidity grab near 1.1478
Bullish projection towards 1.1637 (Wave 5 target)
🔸 Entry Idea:
Long from the FVG demand zone with confirmation (price action / bullish engulfing / lower timeframe structure break).
📍 Targets:
TP1: 1.1500
TP2: 1.1570
TP3 (wave projection): 1.16375
🛑 Invalidation:
Clean break below 1.1470 zone with momentum could invalidate the bullish setup.
---
📊 Strategy: Elliott Wave + FVG + Price Action
💡 Watch for reaction around CPI & USD news (14th–18th June)
Hashtags (for IG/TradingView):
#EURUSD #WaveAnalysis #Forex #ForexSetup #PriceAction #ElliottWave #SmartMoney #FXTrade #ForexBreakout
---

EUR/USD Slips on Geopolitical TensionsEUR/USD dropped to around 1.1530 on Friday, ending a four-day rally, as safe-haven demand lifted the US Dollar amid rising Middle East tensions.
Israel struck Iranian targets to weaken its nuclear program, prompting emergency measures. The US denied involvement but warned Iran not to target its assets.
Trump’s plan to expand steel tariffs from June 23 added trade uncertainty, while soft US inflation data kept Fed rate cut hopes alive.
Markets now await the US Michigan Sentiment report for further signals.
Resistance is located at 1.1580, while support is seen at 1.1460.
EURUSD Is Bullish! Buy!
Here is our detailed technical review for EURUSD.
Time Frame: 5h
Current Trend: Bullish
Sentiment: Oversold (based on 7-period RSI)
Forecast: Bullish
The market is approaching a significant support area 1.152.
The underlined horizontal cluster clearly indicates a highly probable bullish movement with target 1.163 level.
P.S
The term oversold refers to a condition where an asset has traded lower in price and has the potential for a price bounce.
Overbought refers to market scenarios where the instrument is traded considerably higher than its fair value. Overvaluation is caused by market sentiments when there is positive news.
Disclosure: I am part of Trade Nation's Influencer program and receive a monthly fee for using their TradingView charts in my analysis.
Like and subscribe and comment my ideas if you enjoy them!

EURUSD - Long from hereDue to having internal Breaks of Structure to the upside here I have entered a long position as it is a reasonable area to potentially get long as it is a strong area of demand.
I'm aware that there isn't much liquidity built up in and around this area before hitting the demand but its a risk im willing to take as price may just be filling the FVG from all the buying pressure that was in the market yesterday
Any questions please message

EURUSD - Current long positionVideo analysis of EURUSD
Hopefully we will get some bullish momentum however its not looking great

Markets Crash: Gold Soars, Crypto Dips!Israel’s strikes on Iran shook markets—Bitcoin and stocks tanked, gold soared. What’s next? Let’s unpack the best trading moves for this chaos!
Hey traders, Skeptic here!👋 Yesterday’s Israeli strikes on Iran’s military and nuclear sites, plus high-profile casualties, sent markets into a tailspin. If your positions got stopped out today, don’t sweat it—that’s normal in this mess. Today, I’m breaking down the most likely scenarios for financial markets, especially stocks and crypto, with no FOMO, no hype, just reason. Stick with me to navigate this storm!
📉Right now, markets are screaming risk-off . Stocks like the S&P 500, indices, and crypto like Bitcoin are bleeding as buyers have zero confidence. Everyone’s piling into safe-haven assets like gold, the Japanese yen, and the Swiss franc. Last night’s news triggered sharp drops in Bitcoin and SPX500, while gold’s rallying hard. This is classic flight-to-safety behavior, and it’s why your stops might’ve been hit. Let’s dive into the geopolitical scenarios driving this and then get to the charts.
📍First, the big picture.
Scenario one: Iran retaliates for Israel’s strikes, and we’re stuck in a tit-for-tat escalation for weeks. Markets stay risk-off, stocks and crypto keep sliding, and safe havens like gold thrive.
Scenario two: The US-Iran nuclear talks on Sunday, June 15th, lead to a deal, tensions cool, and markets stabilize. If those talks fail, I’m not optimistic— recent US inflation relief, might’ve pushed the Federal Reserve toward rate cuts to boost markets. Without de-escalation, rate cuts won’t save risky assets, and we’re looking at muted growth for crypto and stocks.
But if a deal happens, markets could rip—Bitcoin might hit $130K short-term and even $170K as the bull run’s ceiling. For now, uncertainty rules, so let’s see what the charts say.
👀 Let’s start with Bitcoin on the daily.
The first major support is $100K-$101K. If we lose that, we’re looking at a 3-4 month time-based correction . I know some of you see Bitcoin’s dip and think it’s a bargain, but hold up—if tensions escalate, breaking $100K-$101K is almost guaranteed. We could slide to $95K (0.382 Fibonacci retracement) or even $86K (0.618 retracement). No buying until Tuesday’s clarity—too risky. Shorting? Also a bad idea. After this sharp drop, where do you put your stop-loss? An 8% stop is the minimum, which trashes your risk-reward ratio. Best move? Sit tight, no positions, and wait for the dust to settle.
📈 Gold’s the star in this risk-off market.
On the 4-hour, as we said in last week’s watchlist, it broke the descending channel’s ceiling at 3333.86 and pulled back. Using our trick of cloning the prior channel and placing it above, it’s reacting perfectly at the new channel’s midline. A break above 3434.35 could push us to the channel ceiling at 3550.13 . Personally, I’d wait for more ranging here before going long—stops are too wide right now for a clean entry. If you caught our 3340 long trigger from the watchlist, you’re sitting pretty— just hold . Gold’s got more upside potential, but if you’re not in, don’t FOMO. Wait for a better setup.
🎯 Our EUR/USD long trigger from last week’s watchlist at 1.14555 was a winner
if you took it, you hit your risk-reward target and likely locked in profits. Nice work! The new long trigger is a break above 1.16142 resistance. No short triggers here, just like gold. With both major and secondary trends screaming uptrend, shorting against the flow is nonsense. I’d wait for key levels to break and confirm a bearish shift before even thinking about shorts. Trade with the trend, always.
📝our plan: Gold longs above 3434.35 target 3550.13; hold 3340 entries or wait for a range. EUR/USD longs above 1.16142, no shorts. Risk max 1% per trade, set alerts, and stay patient—geopolitical chaos means no FOMO moves.
I hope for a day with no wars, where we can focus on what matters—building value and humanity.🤍
That’s today’s breakdown, traders!
If this helped, smash that Boost button and Follow for more no-hype analysis. Drop a comment—what’s your next move? Want a coin or market analyzed? This is Skeptic, stay safe, protect your capital, and see you next time! <3

Hellena | EUR/USD (4H): LONG to the resistance area 1.15691.Colleagues, I believe that wave “5” of higher order has actively started an upward movement.
At the moment I see movement in wave “1” of medium order and it means that a correction in wave “2” to the area of 50% Fibonacci level (1.12434) is expected. But I would still advise to consider only upward movement and use pending limit orders.
I see the maximum of wave “3” - resistance area 1.15691 as the target.
Manage your capital correctly and competently! Only enter trades based on reliable patterns!

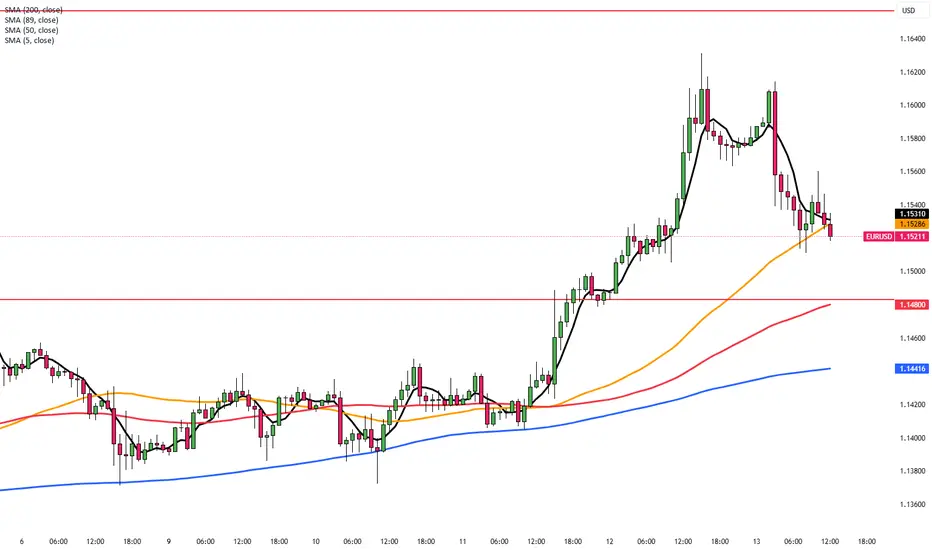
DeGRAM | EURUSD above the 1.15📊 Technical Analysis
● Hourly close above 1.1500 completed a small ascending triangle; price is now hugging the rising-channel’s upper rail after a chain of higher-lows, pointing toward the 1.1600 objective.
● Triangle top and channel mid-line overlap at 1.1500-1.1520; while candles stay above, risk : reward favours a push to the next fib / upper parallel near 1.1650.
💡 Fundamental Analysis
● US core-CPI eased to 0.1 % m/m, driving Treasury yields lower and lifting September Fed-cut odds >70 %, weakening the dollar, while ECB officials talked up a “data-dependent” pause, keeping euro bids firm.
✨ Summary
Long bias while price holds 1.1520; targets 1.1600 then 1.1650. Invalidate on an hourly close below 1.1470.
-------------------
Share your opinion in the comments and support the idea with like. Thanks for your support!
EUR/USD - Daily highs taken, now what?Introduction
The EUR/USD made a strong move higher today, establishing a clear uptrend on the 4-hour chart. With this latest push, it swept the daily liquidity above the previous high. The question now is whether the EUR/USD will continue moving higher or if there are opportunities for long entries at lower levels.
Liquidity Sweep
EUR/USD has taken out liquidity above the daily highs, where many stop losses are typically positioned. These stops have now been removed from the market. This area could potentially act as a support and resistance flip. However, if we see a 4-hour candle close below the previous daily high, further downside becomes likely.
Where Can We Look for Buys?
During the recent 4-hour move higher, significant progress was made. This upward movement created a daily Fair Value Gap (FVG) between $1.149 and $1.145. This FVG aligns perfectly with the golden pocket Fibonacci level, drawn from the swing low to the swing high. As a result, this zone forms a strong area of confluence for potential buy positions to target a retest of the highs.
Conclusion
Although we are currently breaking above the previous high, this move has yet to be confirmed as sustainable. Holding above this level is crucial. If a 4-hour candle closes below the previous high, it becomes likely that we will revisit the daily FVG and golden pocket Fibonacci zone.
Disclosure: I am part of Trade Nation's Influencer program and receive a monthly fee for using their TradingView charts in my analysis.
Thanks for your support.
- Make sure to follow me so you don't miss out on the next analysis!
- Drop a like and leave a comment!

USDCHF Bullish or bearish Detail ANAYSISUSDCHF is currently setting up for a classic bearish continuation pattern. After breaking down sharply from the key support turned resistance zone around 0.81500, the pair is now in the middle of a technical retest. Price is currently hovering near 0.81 and showing signs of weakness on lower timeframes. This retest into the previous demand-turned-supply area aligns well with the expectation of a further leg to the downside. As long as the price stays below 0.81500, sellers are likely to dominate, targeting 0.8000 in the near term.
From a fundamental perspective, the bearish pressure on USDCHF is supported by growing market speculation that the Federal Reserve may begin rate cuts sooner than previously expected. With the latest US CPI data confirming disinflationary progress and unemployment claims ticking higher, dollar strength is taking a hit. Meanwhile, the Swiss Franc remains relatively stable as the SNB continues its measured approach, with inflation staying well within target and no immediate pressure to cut rates. This monetary policy divergence favors further downside in USDCHF.
Technically, momentum remains strongly bearish. The recent bounce appears corrective rather than impulsive, suggesting the bears are still in control. If price rejects the 0.81500 zone with a clear reversal candle, we can anticipate a strong continuation move toward the psychological level of 0.8000. This level also aligns with previous demand zones and Fibonacci extension targets, making it a solid downside objective.
This setup is a clean example of trend-following structure with fundamental backing. USDCHF is preparing to complete a textbook retest before its next drop, offering a high-probability short opportunity. If the rejection confirms around 0.81500, sellers can expect a solid move toward 0.8000 with favorable risk-reward. The setup is ideal for short-term swing traders tracking USD weakness across the board.

EURUSD SHORT FORECAST Q2 W24 D13 Y25EURUSD SHORT FORECAST Q2 W24 D13 Y25
PERHAPS THE LAST CHANCE FOR SHORTS- GRAB A THE BEST DISCOUNT !
Professional Risk Managers👋
Welcome back to another FRGNT chart update📈
Diving into some Forex setups using predominantly higher time frame order blocks alongside confirmation breaks of structure.
Let’s see what price action is telling us today!
💡Here are some trade confluences📝
✅Weekly order block
✅15' order block
✅1 hour order block
✅Tokyo ranges to be filled
🔑 Remember, to participate in trading comes always with a degree of risk, therefore as professional risk managers it remains vital that we stick to our risk management plan as well as our trading strategies.
📈The rest, we leave to the balance of probabilities.
💡Fail to plan. Plan to fail.
🏆It has always been that simple.
❤️Good luck with your trading journey, I shall see you at the very top.
🎯Trade consistent, FRGNT X

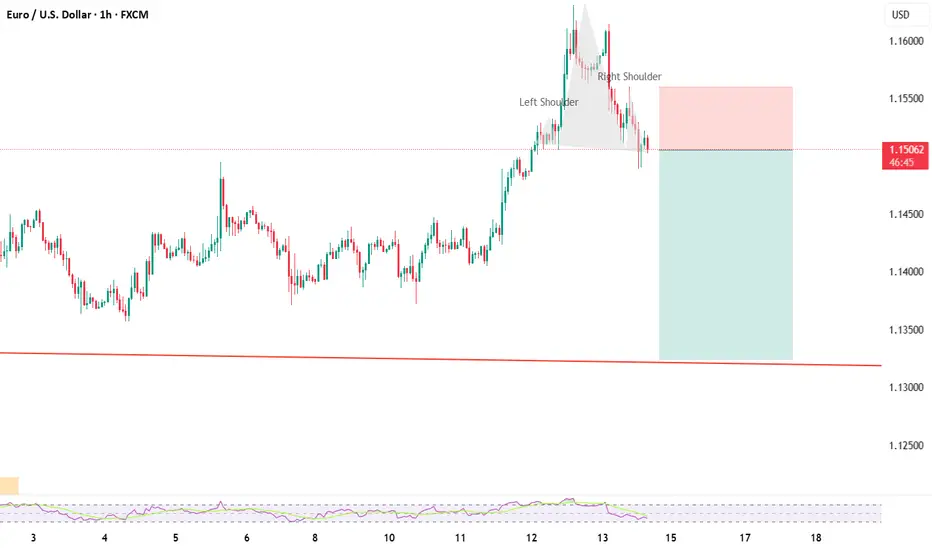
Fundamental Market Analysis for June 13, 2025 EURUSDEvents to pay attention today:
12:00 EET. EUR - Foreign trade balance
17:00 EET. USD - University of Michigan Consumer Sentiment Index
EURUSD :
EUR/USD interrupted its four-day winning streak, retreating from 1.16310, its highest level since October 2021, and is currently trading around 1.15300 in Asian hours on Friday. The pair is depreciating as the US dollar (USD) gains support as traders shift to increased demand for safe-haven assets due to rising tensions in the Middle East.
Israel has attacked dozens of targets across Iran to eliminate its nuclear programme. Israeli Defence Minister Israel Katz said Israel could face a missile and drone strike after Israel's pre-emptive strike on Iran. Katz declared a special state of emergency in the country, Axios reports.
In addition, White House Secretary of State Marco Rubio issued a statement: ‘Tonight, Israel took unilateral action against Iran. We are not participating in strikes against Iran, and our top priority is to protect American troops in the region.’ ‘President Trump and the administration have taken all necessary measures to protect our troops and are in close contact with our regional partners.’ ‘Let me be clear: Iran should not target US interests or personnel,’ Rubio added.
However, the decline in the EUR/USD pair may be limited, as the US dollar (USD) may face difficulties after US President Donald Trump's new threat to extend steel tariffs from 23 June to imported ‘steel-derived products’ such as household appliances, e.g. dishwashers, washing machines, refrigerators, etc. The tariffs were initially introduced in March at 25% and then doubled to 50% for most countries. This is the second time that the scope of the duties has been expanded.
Trading recommendation: SELL 1.15300, SL 1.15500, TP 1.14400

EURUSD H4 I Bullish Bounce OffBased on the H4 chart analysis, we can see that the price is falling toward our buy entry at 1.14737, which is a pullback support that aligns with the 61.8% Fib retracement.
Our take profit will be at 1.1570, which is a pullback resistance level.
The stop loss will be placed at 1.1400, an overlap support.
High Risk Investment Warning
Trading Forex/CFDs on margin carries a high level of risk and may not be suitable for all investors. Leverage can work against you.
Stratos Markets Limited (tradu.com ):
CFDs are complex instruments and come with a high risk of losing money rapidly due to leverage. 63% of retail investor accounts lose money when trading CFDs with this provider. You should consider whether you understand how CFDs work and whether you can afford to take the high risk of losing your money.
Stratos Europe Ltd (tradu.com ):
CFDs are complex instruments and come with a high risk of losing money rapidly due to leverage. 63% of retail investor accounts lose money when trading CFDs with this provider. You should consider whether you understand how CFDs work and whether you can afford to take the high risk of losing your money.
Stratos Global LLC (tradu.com ):
Losses can exceed deposits.
Please be advised that the information presented on TradingView is provided to Tradu (‘Company’, ‘we’) by a third-party provider (‘TFA Global Pte Ltd’). Please be reminded that you are solely responsible for the trading decisions on your account. There is a very high degree of risk involved in trading. Any information and/or content is intended entirely for research, educational and informational purposes only and does not constitute investment or consultation advice or investment strategy. The information is not tailored to the investment needs of any specific person and therefore does not involve a consideration of any of the investment objectives, financial situation or needs of any viewer that may receive it. Kindly also note that past performance is not a reliable indicator of future results. Actual results may differ materially from those anticipated in forward-looking or past performance statements. We assume no liability as to the accuracy or completeness of any of the information and/or content provided herein and the Company cannot be held responsible for any omission, mistake nor for any loss or damage including without limitation to any loss of profit which may arise from reliance on any information supplied by TFA Global Pte Ltd.
The speaker(s) is neither an employee, agent nor representative of Tradu and is therefore acting independently. The opinions given are their own, constitute general market commentary, and do not constitute the opinion or advice of Tradu or any form of personal or investment advice. Tradu neither endorses nor guarantees offerings of third-party speakers, nor is Tradu responsible for the content, veracity or opinions of third-party speakers, presenters or participants.

EU Daily Chart AnalysisEU Daily Chart Analysis
In D1 Chart, clearly the break out candle is huge and waiting to retest the area to Buy opportunity again

EURUSD, GBPUSD & EURGBP analysisHere's my outlook on the 3 pairs mentioned in the title. Looking for more upside momentum after we have some sort of pullback into the premium discount prices.
Once we get some15min bearish internal orderflow on the lower Time Frames I will look to enter short term sell positions before looking to take longer term buys on the way back up.
Again, if I can be of any assistance please do let me know and I will be happy to help where I can.

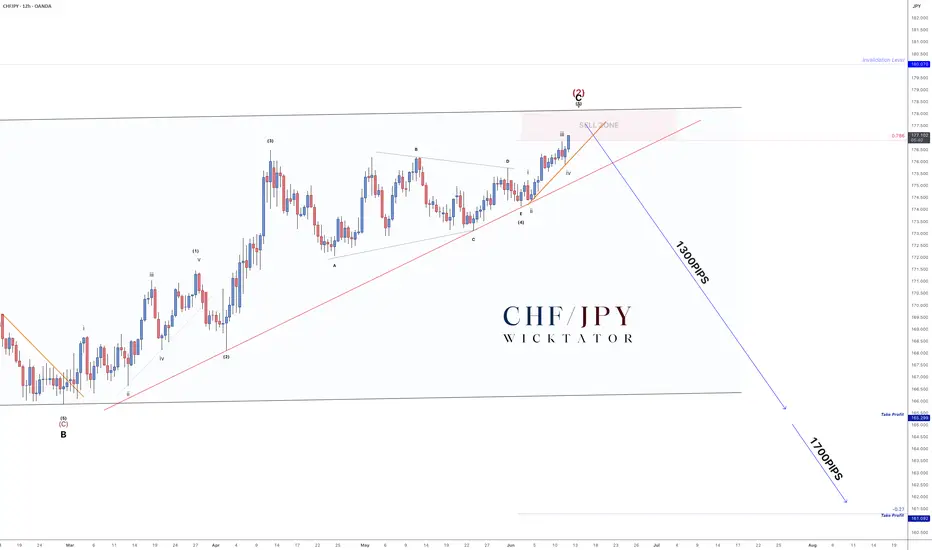
CHFJPY - How To Enter This MASSIVE 1700pip Swing Trade!As promised - here’s the lower timeframe breakdown after hitting 100+ likes.
We’re in wave 5, currently moving cleanly into the swing zone. Since wave 5 typically forms 5 subwaves, all we needed was to connect points 2 and 4 to draw our entry trendline.
Trade Idea:
- Entry on break of the orange trendline
- Stops above recent highs after entry
- Aggressive option: Enter inside the sell zone with stops above invalidation
Targets:
- TP1: 165.00 (≈1300 pips)
- TP2: 161.50 (≈1700 pips)
- Optional: Leave a runner for the longer swing move
Scroll down for the full 4H breakdown.
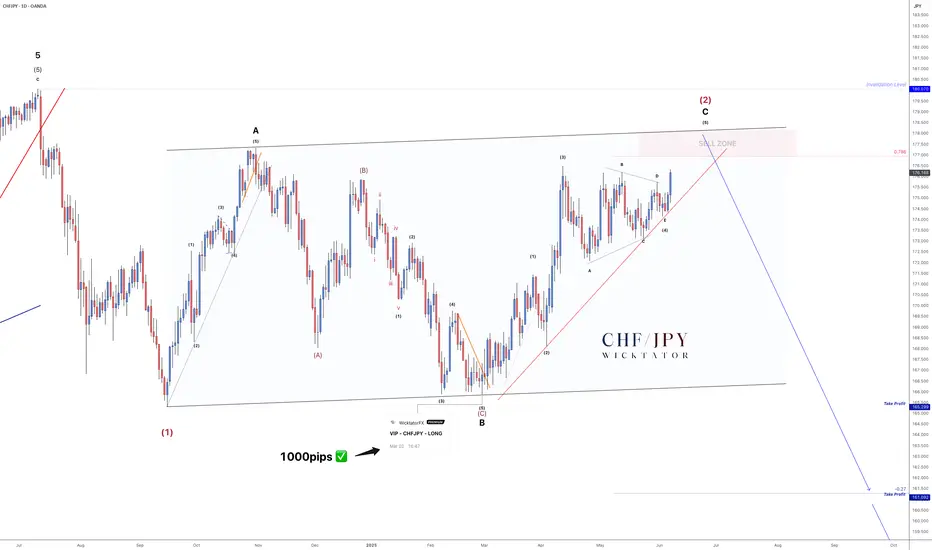
CHFJPY - 1700 Pip Reversal Incoming!The last time we looked at CHFJPY was back in October 2024, where we forecasted a large ABC correction. Fast forward to now - that correction is nearly complete!
We're currently in the 5th subwave of wave C, and everything points toward a massive drop setting up. We expect a move of at least 1500 pips.
On the Daily timeframe, structure is clear:
- Clean 5-3-5 ABC correction
- Price is approaching a key sell zone
- A clear entry trendline is in place — couldn’t ask for a cleaner setup
Trade Idea:
- Watch for rejection within the sell zone
- Aggressive entry: Inside sell zone with stops above invalidation
- Conservative entry: On break of trendline, stops above the break candle
Targets:
TP1: 165.00 (≈1300 pips)
TP2: 161.50 (≈1700 pips)
Optional: Leave a runner for a long-term swing
Let me know what you think in the comments.
See below for our last VIP setup for CHFJPY which played out perfectly. 1000pips secured!
Good luck and as always, trade safe!
Opportunity to buy EURUSDI see an opportunity to buy the EUR/USD pair from the support shown in the image and the target will be 1.16316
