Premarket Analysis - Will Price Head Lower?Hello everybody!
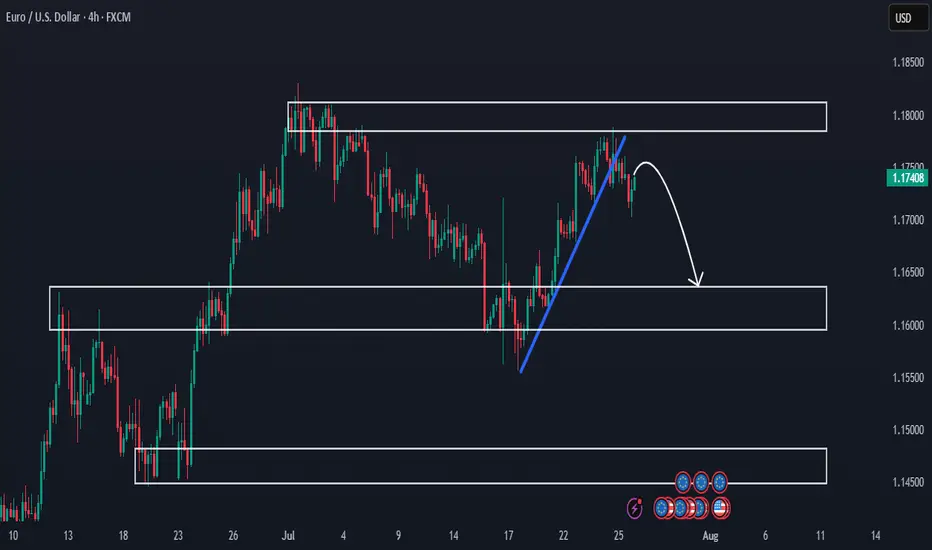
We’re looking at three key areas on the chart.
Price has been rejected from a supply zone.
The clean upward trendline has been broken, and we expect the price to move lower this week.
If the drop continues, we’ll look to sell and aim for the more likely target around 1.16400.
Then we’ll see whether this first demand/support area holds or not.
Have a good trading week ahead!
EURUSD
EUR/USD Analysis: Potential Reversal at Key Support📉 Day 3 of 100: EUR/USD Breaks Structure!
Today’s market gave us a lesson! 📚
✅ SL Hit due to news
✅ 61% order block broken
✅ NY session may go bullish after Asia+London trap
.
Are you seeing the pattern unfold?
👇 Comment “Wave Watcher 🌊” if you use Elliott Wave!
Day 3/100 - EUR/USD Breakdown! | Forex Analysis | Elliott Wave | Order Block Strategy
In today’s update: 📌 SL hit due to major fundamental shift
📌 Break of 61% order block; heading to 78% zone
📌 Similar pattern in Tokyo/London sessions—bullish setup possible for NY session
.
💬 Drop a comment if you're also using Elliott Wave price action!
👍 Like | 🔁 Share | 🔔 Subscribe for more daily updates!
🚀 Join the 100-Day EUR/USD Challenge — Let’s decode the market together!
#forex #eurusd #elliottwave #orderblock #forextrader #forexeducation #smartmoneyconcepts #priceaction #forexchallenge #newyorksession #technicalanalysis #forexstrategy
---

DXY: USD Flexes Muscle - Pairs SlideFriday, July 25, 2025
The foreign exchange markets are experiencing a pronounced USD bullish session this morning, with the US Dollar Index (DXY) showing robust gains of +0.35% while simultaneously pressuring all major currency pairs into negative territory. The Japanese Yen (JPY) is bearing the brunt of this dollar strength, currently registering losses between -0.4% to -0.66% across JPY pairs. This market behavior suggests traders should pay particularly close attention to DXY dynamics, as its movements will likely dictate price action across all major currency pairs in today's session.
Technical Perspective: DXY at Critical Inflection Point
A detailed examination of the Dollar Index reveals several compelling technical factors that market participants should consider:
1. Weekly Demand Zone Reaction
- The DXY has demonstrated a strong rejection from a significant weekly demand area
- The subsequent bullish spike indicates potential continuation of upward momentum
- This price action suggests institutional buyers are defending this key level
2. Commitment of Traders (COT) Report Insights
Non-commercial traders (typically hedge funds and speculators) have increased their positions from a bottom level not seen since June 2021 meanwhile the Commercial traders (often corporations hedging FX exposure) show opposing extreme positioning. This stark divergence between trader categories often precedes significant market moves
3. Seasonal Patterns Favor USD Strength
- Historical seasonal analysis indicates the current period typically supports dollar appreciation
- The combination of technical and seasonal factors creates a potentially powerful bullish setup
✅ Please share your thoughts about DXY in the comments section below and HIT LIKE if you appreciate my analysis. Don't forget to FOLLOW ME; you will help us a lot with this small contribution.

EURUSD: Will Go Down! Short!
My dear friends,
Today we will analyse EURUSD together☺️
The market is at an inflection zone and price has now reached an area around 1.15996 where previous reversals or breakouts have occurred.And a price reaction that we are seeing on multiple timeframes here could signal the next move down so we can enter on confirmation, and target the next key level of 1.15562..Stop-loss is recommended beyond the inflection zone.
❤️Sending you lots of Love and Hugs❤️

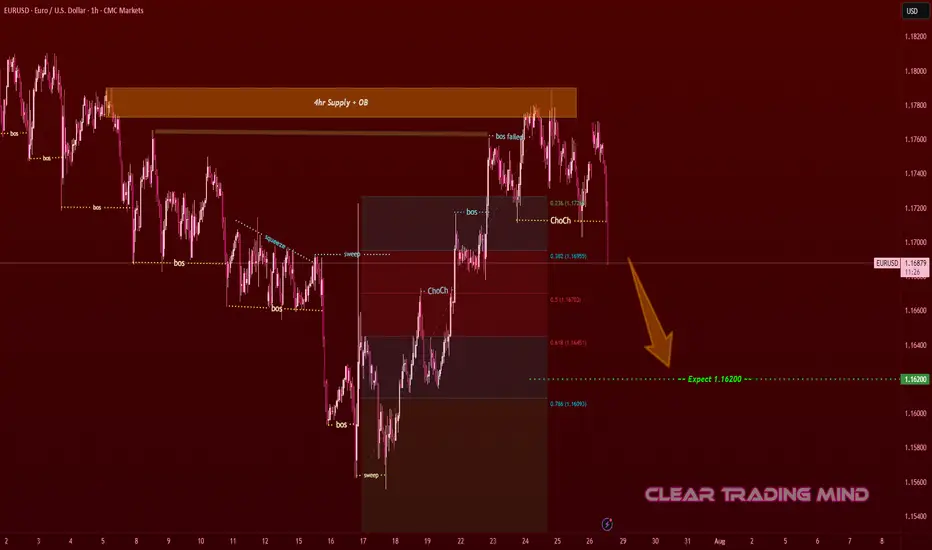
EURUSD Supply Rejection – Bearish Move ExpectedOn the 1-hour chart, EURUSD tapped into the 4hr Supply + OB zone 🟧 and failed to hold above previous structure.
- BoS (Break of Structure) shows weakness at highs
- ChoCh (Change of Character) confirms bearish shift
- Price rejected from 0.236 Fib level (1.17400) and is moving lower
Plan:
- Expecting price to move toward 1.16200 (≈ 120 pips from current level) 🎯
- Bearish momentum remains valid as long as price stays below supply zone
- Confirmation candles & retests strengthen short bias
Reasoning:
- Supply zone rejection + failed breakout
- Clear structure shift (ChoCh) toward lower lows
- Fib retracement confluence (0.5 – 0.618 zone) aligning with sell pressure
(Not financial advice – only a personal observation)
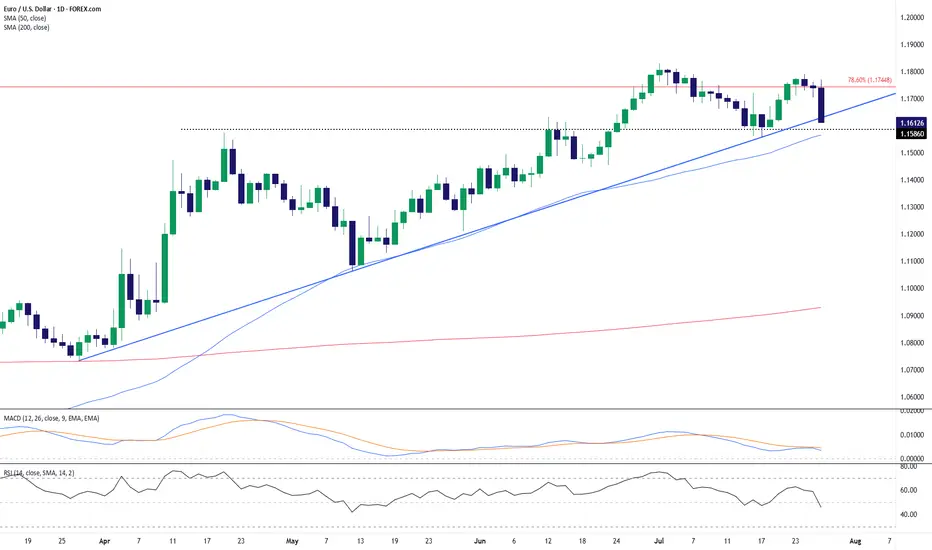
EUR/USD: Breakdown From Key Fib Confluence Threatens UptrendEUR/USD has snapped a key confluence zone after rejecting the 78.6% Fibonacci retracement level near 1.1745. The latest daily candle shows a sharp bearish engulfing bar that sliced below both the ascending trendline and the 50-day SMA (1.1565), signaling a potential trend reversal or deeper correction.
This breakdown follows a multi-week uptrend, and momentum indicators are starting to confirm the bearish shift:
MACD is showing a bearish crossover below the signal line.
RSI has dropped below 50 (currently around 45.8), reflecting weakening bullish momentum.
The pair has now settled just above horizontal support near 1.1586. A decisive close below this level could open the door toward the next support zone around 1.1450–1.1500, where prior consolidation and the rising 200-day SMA (1.0929) may act as stronger demand.
Bulls will need to reclaim the 1.1650–1.1700 zone and see a bullish crossover on momentum indicators to regain control. Until then, the path of least resistance appears tilted to the downside, especially with trendline and Fib support now breached.
Bias: Bearish while below 1.1700. Watch for continuation lower if 1.1586 fails to hold.
-MW
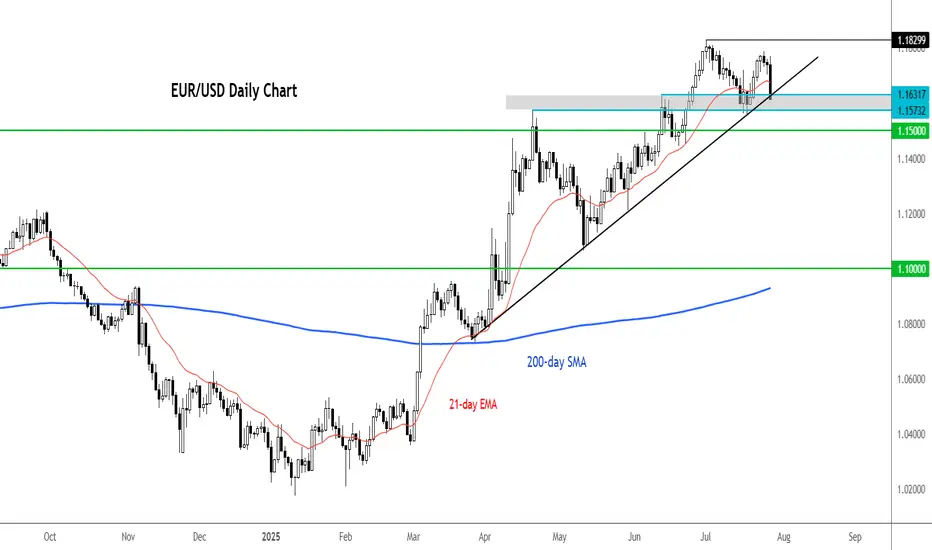
EUR/USD testing bull trend after 1% dropThere are multiple factors weighing on the EUR/USD today. We have seen a broad dollar rally, suggesting that the trade agreements are seen as net positive for the US economy, even it means rising inflation risks. With higher tariffs and Trump’s inflationary fiscal agenda, interest rates in the US are likely to remain elevated for longer.
As far as the euro itself is concerned, the single currency fell all major currencies, which suggests investors were not impressed by the EU’s negotiation tactics. Accepting a 15% tariff on most of its exports to the US while reducing levies on some American products to zero, means the deal will make companies in Europe less competitive. Still, it could have been a far worse situation had we seen a trade war similar to the US-China situation in April. It means that there is now some stability and businesses can get on with things. On balance, though, European leaders will feel that they may have compromised a little too much.
Technically, the EUR/USD is still not in a bearish trend despite today’s sizeable drop. But that could change if the bullish trend line breaks now. If that happens 1.15 could be the next stop. Resistance is now 1.1650 followed by 1.1700.
By Fawad Razaqzada, market analyst with FOREX.com
Potentially, A Safer Way To Long The EURUSDIn contrast to my previous outlook, the current price action suggests an increased probability of a deeper bearish move—potentially invalidating the buy zone marked out in the previous analysis. This sudden change is largely driven by the prospect of untapped liquidity residing beneath that zone, reinforcing the well-known market principle that price seeks out liquidity before committing to directional moves.
Given this development, the newly identified zone on the chart emerges as a more technically sound and reliable area from which to anticipate bullish interest. It aligns better with the broader liquidity profile and offers a stronger base for accumulation. Traders may opt to wait for confirmations within this zone or, depending on their risk appetite, consider executing buy positions upon price entry.
As always, patience and clarity are key as we allow price to reveal its intention.
Fingers crossed 🤞
Wishing you all a focused and profitable trading week.
Catch you on the next one. 🫡

XAU/USD | Gold Holding Strong – Watching for Next Bullish Move!By analyzing the gold chart on the 4-hour timeframe, we can see that yesterday, as expected, when the price dropped to around $3357, it faced strong buying pressure and rallied up to $3377. After that, it corrected again, pulling back to $3338 so far, and is currently trading around $3341. If gold manages to hold above $3337, we can expect another bullish move, with potential targets at $3347, $3354, $3364, and $3374.
Please support me with your likes and comments to motivate me to share more analysis with you and share your opinion about the possible trend of this chart with me !
Best Regards , Arman Shaban

This Chart Screams Breakout – Are You In?AUD/USD – Bullish Setup Brewing
AUD/USD has been respecting this rising channel beautifully, with clean higher highs and higher lows.
Back in April, we saw a classic bear trap, price wicked below support, lured in shorts, and then reversed sharply. That fakeout sparked a strong rally and confirmed demand.
Currently, price is consolidating near the Key Resistance Zone and bouncing off the lower trendline again a sign of strength.
If this pattern continues, we could soon see a breakout above the upper trendline, potentially sending AUD/USD flying toward 0.68+.
Outlook:
As long as the structure holds, dips are for buying. Bulls remain in control.
DYOR, NFA
Thanks for the reading

EURUSD at Make-or-Break Zone: Time to Short?EURUSD – Key Data Out Today, Short Setup Confirmed?
Today, several important economic indexes were released for both the Euro(EUR) and the Dollar(USD) . Let’s break them down in a simple way:
Eurozone PMI Data: Mixed to Weak
France:
Manufacturing PMI: 48.4 (slightly lower than forecast)
Services PMI : 49.7 (flat, but below 50 = contraction)
Germany:
Manufacturing PMI: 49.2 (weaker than expected)
Services PMI : 50.1(slightly expansionary)
Eurozone Overall:
Manufacturing PMI: 49.8 (still below 50)
Services PMI : 51.2 (slightly stronger than forecast)
ECB left the Main Refinancing Rate unchanged at 2.15% , which was widely expected.
U.S. Data( TVC:DXY ): Strong and Surprising
Unemployment Claims: 217K (better than expected 227K)
Manufacturing PMI: 49.5 (below forecast of 52.7 – a negative surprise)
Services PMI: 55.2 (well above forecast and previous – bullish for USD)
Interpretation :
The Eurozone's growth remains sluggish, especially in France and Germany.
Despite a drop in U.S. manufacturing, the services sector remains strong, and unemployment data confirms labor market resilience.
This mixed picture slightly tilts the balance in favor of the U.S. dollar, especially as the ECB remains on hold while the Fed may still consider being restrictive.
Bias: Short EURUSD ( FX:EURUSD )
Fundamentals support a Short position in EURUSD, in line with the current technical setup.
---------------------------------
Now let's take a look at the EURUSD chart on the 4-hour time frame to find the best Short position .
EURUSD is currently trading in an Ascending Channel and at a Heavy Resistance zone($1.1845-$1.1602) .
Also, in terms of Elliott wave theory , it seems that EURUSD is completing a microwave 5 of the main wave 5 .
One of the most important supports ahead for EURUSD could be the 100_SMA(4-hour TF) .
If the currently 4-hour candlestick forms a Shooting Star Candlestick Pattern , it is a better sign for EURUSD to fall .
Also, we can see the Regular Divergence(RD-) between Consecutive Peaks .
I expect EURUSD to decline to at least $1.169 AFTER breaking the lower line of the ascending channel .
Second Target: Support zone($1.1642-$1.158) and Monthly Pivot Point.
Note: Stop Loss(SL)= $1.1850
Please respect each other's ideas and express them politely if you agree or disagree.
Euro/U.S. Dollar Analyze (EURUSD), 4-hour time frame.
Be sure to follow the updated ideas.
Do not forget to put a Stop loss for your positions (For every position you want to open).
Please follow your strategy and updates; this is just my Idea, and I will gladly see your ideas in this post.
Please do not forget the ✅' like '✅ button 🙏😊 & Share it with your friends; thanks, and Trade safe.

EUR/USD | Correction Near Key Demand – Watching for Rebound!By analyzing the EURUSD chart on the 4-hour timeframe, we can see that after the last analysis, the price started a correction and is currently trading around 1.17150. I expect that once it enters the 1.16780–1.17100 zone, we could see a rebound from this key demand area. If the price holds above this zone, the next bullish targets will be 1.17370 as the first target and 1.17730 as the second.
Please support me with your likes and comments to motivate me to share more analysis with you and share your opinion about the possible trend of this chart with me !
Best Regards , Arman Shaban

Euro will rebound from support line of wedge to resistance levelHello traders, I want share with you my opinion about Euro. After breaking out decisively from a prior downward channel, the euro initiated a significant structural shift, moving from a clear downward trend into a new and more volatile market condition. This transition has led to the development of a large broadening wedge pattern, which is characterised by higher highs and lower lows, indicating an expansion in volatility as both buyers and sellers fight for control. The boundaries of this struggle are well-defined by a major buyer zone around 1.1650 and a formidable seller zone near 1.1750. Currently, the pair is in a corrective phase, moving downwards within the wedge after a recent upward rebound was rejected from the upper resistance line. The primary working hypothesis is a long scenario, which anticipates that this downward correction will find strong support at the confluence of the wedge's ascending support line and the horizontal buyer zone around 1.1650. A confirmed bounce from this critical area of support would validate the integrity of the broadening wedge pattern and likely trigger another powerful upward rotation. Therefore, the TP is strategically placed at the 1.1750 resistance level. Please share this idea with your friends and click Boost 🚀
Disclaimer: As part of ThinkMarkets’ Influencer Program, I am sponsored to share and publish their charts in my analysis.

Next Move On EURUSD: A Bullish ContinuationWith this 4H bearish impulsive move, it’s easy to assume a reversal is underway to break the previous daily swing low. However, this appears more like a liquidity grab—fueling the next leg to the upside.
Price has retraced into a key zone that previously performed a strong liquidation. With significant liquidity already swept and clean inducements now resting above, this level becomes crucial.
This zone is the last stand: a break downward may target the daily swing low, while a hold and reaction could propel price toward the swing high.
Fingers crossed 🤞 as we watch price play out.
Have a great trading week, traders.
Catch you in the next one. 🫡

EUR/USD Technical Analysis📈 EUR/USD Technical Analysis
🔍 1. Market Structure
⚙ Trend Context
• The overall trend since mid-July has been bullish, with higher highs and higher lows forming after a bounce from a key demand zone (around 1.15380).
• However, recent candles show indecision and a potential reversal, suggesting weakening momentum.
⸻
🧱 2. Volume Profile Insight (VRVP)
• High Volume Nodes (HVNs):
• Significant trading activity occurred between 1.172–1.176, now acting as resistance.
• Low Volume Gaps:
• Thin liquidity zones exist between 1.165–1.158, which could result in swift price movement if selling pressure increases.
📘 Educational Insight: Thin volume areas on a profile typically allow for faster price transitions due to lack of order density.
⸻
📊 3. Envelope Indicator – Nadaraya-Watson (8,3)
• A mean-reversion tool estimating dynamic overbought and oversold areas.
• Price recently rejected the upper boundary, reinforcing the bearish outlook.
• The lower envelope, around 1.158–1.160, aligns with the projected bearish target.
⸻
🟫 4. Demand Zone Analysis
• Labeled “DEMAND ZONE” at 1.15380–1.15830
• Previously caused a strong bullish reversal, marking it as an area of institutional interest.
• A re-test of this zone may attract buyers once again, presenting a key support area.
📘 Educational Insight: Demand zones reflect

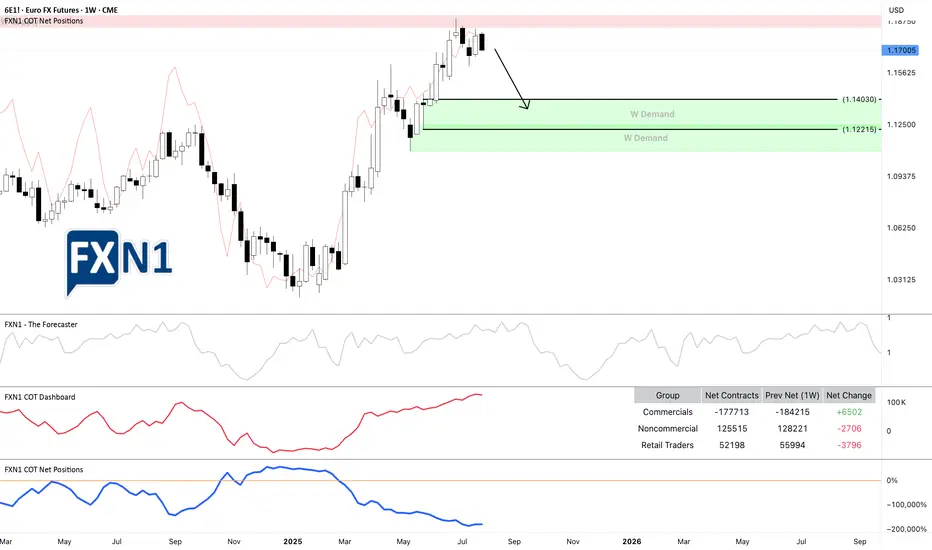
6E1!: Rebound at Weekly Supply Sparks Potential ReversalThe EURUSD (6E1! futures) experienced a rebound from a weekly supply zone * and now appears to be approaching a potential reversal toward a demand area. The overall picture is clear: we already capitalized on the rebound off the previous weekly supply zone, and at this point, we're simply observing the price as it approaches another key area of interest. It may be too late to initiate new short positions at this stage, but traders still holding shorts could potentially benefit from a continued move downward.
From a fundamental perspective, our Friday analysis of the DXY ** indicated the possibility of a bullish impulse, and today the US Dollar opened the session with a 0.58% gain. Currently, both commercial and non-commercial traders are aligned with the prevailing scenario. The most optimistic outlook suggests the price could decline to around 1.14030 over the coming weeks.
*
Previous analysis on EURUSD 6E1!
**
DXY Analysis
✅ Please share your thoughts about 6E1! in the comments section below and HIT LIKE if you appreciate my analysis. Don't forget to FOLLOW ME; you will help us a lot with this small contribution.
EURUSD Massive Long! BUY!
My dear friends,
EURUSD looks like it will make a good move, and here are the details:
The market is trading on 1.1665 pivot level.
Bias - Bullish
Technical Indicators: Supper Trend generates a clear long signal while Pivot Point HL is currently determining the overall Bullish trend of the market.
Goal - 1.1728
About Used Indicators:
Pivot points are a great way to identify areas of support and resistance, but they work best when combined with other kinds of technical analysis
Disclosure: I am part of Trade Nation's Influencer program and receive a monthly fee for using their TradingView charts in my analysis.
———————————
WISH YOU ALL LUCK

EURUSD: A New Possibility On The Horizon!!Following my previous post just a few minutes ago, I’ve observed that price may retrace deeper into the 4H supply zone, which could invalidate our earlier bearish setup. This shift is due to visible signs of uncollected liquidity still resting above the current price.
If price continues its rally to the upside, we’ll shift bias and look for potential opportunities to ride the bullish move instead. Losses are part of the game, guys—but no worries, my sell entries are already secured✌️😂.
Stay sharp and stay active, traders. Let’s see how price unfolds from here. Follow for more updates. See you on the next one. ⚔️📊

EURUSD Did Not Like the EU–US DealThe heavily one-sided EU–US deal has put negative pressure on EURUSD. Ahead of a crucial week filled with major events, including GDP data from both the Eurozone and the US, the PCE report, payrolls, and meetings from the FOMC and BOJ, EURUSD has broken a short-term head and shoulders formation. The pattern's target is near 1.1610.
A retest of the broken support is possible and could even extend to 1.1725. However, unless sentiment changes due to some news, this move may offer only a selling opportunity. The downward trend could also continue without pause.
Options market activity suggests that the 1.16 to 1.18 range is viewed as a "safe zone," with large players likely aiming to keep EURUSD within this band for the week. If the head and shoulders target is reached, EURUSD might stabilize and bounce around the 1.16 level.

DeGRAM | EURUSD is correcting from the channel boundary📊 Technical Analysis
● A second rejection at the upper channel/1.1780 supply (red arrows) signals overextension; price is retracing toward the mid-July demand cluster where the rising-channel floor and prior swing base intersect near 1.1600.
● Momentum remains positive on higher-time-frame: each pull-back since May has held the channel support, and the current decline is unfolding as a corrective ABC that projects into 1.1585-1.1620 — a historically bid zone.
💡 Fundamental Analysis
● Softer US Q2-GDP deflator cooled 2-yr yields, while July Euro-area CPI flash is expected to stay sticky, trimming the Fed–ECB policy gap and limiting EUR downside.
✨ Summary
Buy 1.1585-1.1620; hold above 1.1594 targets 1.1687 → 1.1780. Long view invalidated on an H4 close below 1.1530.
-------------------
Share your opinion in the comments and support the idea with a like. Thanks for your support!

EURUSD - Break of support?In this moment we have a potential distribution of volume with a potential break of dinamic support we can have a deep rebound until area 1.14

Bullish momentum to extend?The Fiber (EUR/USD) is falling towards the pivot, which acts as an overlap support and could rise to the 1st resistance, which has been identified as a swing high resistance.
Pivot: 1.1588
1st Support: 1.1447
1st Resistance: 1.1817
Risk Warning:
Trading Forex and CFDs carries a high level of risk to your capital and you should only trade with money you can afford to lose. Trading Forex and CFDs may not be suitable for all investors, so please ensure that you fully understand the risks involved and seek independent advice if necessary.
Disclaimer:
The above opinions given constitute general market commentary, and do not constitute the opinion or advice of IC Markets or any form of personal or investment advice.
Any opinions, news, research, analyses, prices, other information, or links to third-party sites contained on this website are provided on an "as-is" basis, are intended only to be informative, is not an advice nor a recommendation, nor research, or a record of our trading prices, or an offer of, or solicitation for a transaction in any financial instrument and thus should not be treated as such. The information provided does not involve any specific investment objectives, financial situation and needs of any specific person who may receive it. Please be aware, that past performance is not a reliable indicator of future performance and/or results. Past Performance or Forward-looking scenarios based upon the reasonable beliefs of the third-party provider are not a guarantee of future performance. Actual results may differ materially from those anticipated in forward-looking or past performance statements. IC Markets makes no representation or warranty and assumes no liability as to the accuracy or completeness of the information provided, nor any loss arising from any investment based on a recommendation, forecast or any information supplied by any third-party.

EURUSD: A Bearish Continuation?From my previous analysis, we anticipated a short-term decline on the EURUSD for a Daily bearish pullback. Price respected our zone and made a even stronger sweep before plummeting as forecasted.
Currently, price has returned to mitigate that liquidity sweep. Given the prior impulsive bearish move—which this current bullish correction stems from—we expect another drop, targeting the weak structure below for a potential liquidity grab or continuation.
We'll continue to monitor how price behaves around the current levels, but unless there's a significant shift in momentum, our bearish outlook remains valid. ✅
Follow us for more updates. 🔔
See you on the next one. 🫡
