Eurusd1d


Daily Template 2. EUR USDHello!
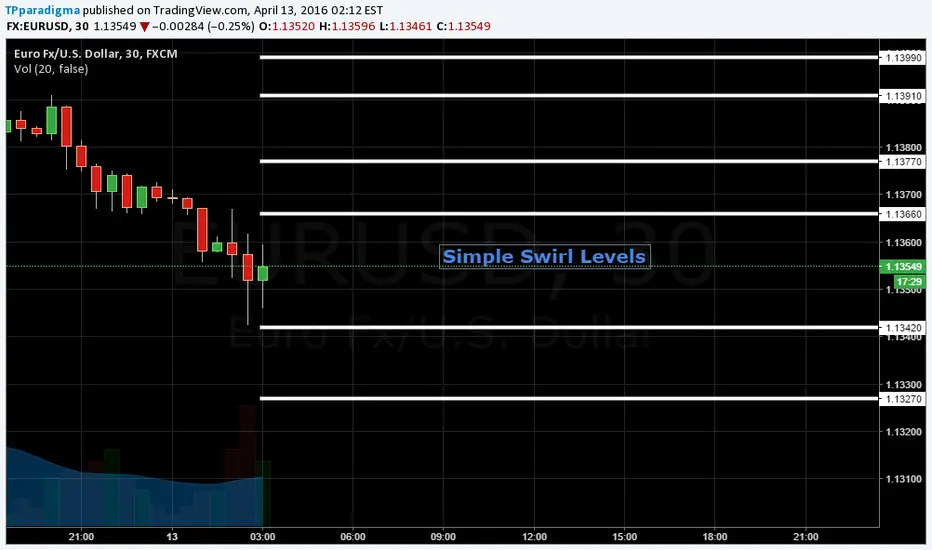
These are simple swirl levels, with simple yet powerful trading opportunities. I will update during the day, where will be opened positions and TP's, if EUR USD interacts with these levels.
Yesterday we made nice short and TP was hit.
Trading rules are simple, if eurusd breaks one of these levels up and down or down and up by 5 pips ( without touching the next level ), we wait for it to travel away and look for entry. TP is the level that was broken down/up.
Download this template - www.tpparadigma.com
Register in Forum - www.tpparadigma.org
Don't miss live trades on Periscope.
Login into our MT4 terminal live account and monitor our trades!
Sincerely, TP PARADIGMA.
100 - 200 Pip Opportunity - EUR/USD Long - 05/02/2016100 - 200 Pip Opportunity - EUR/USD Long - 05/02/2016
The primary trend of EUR/USD is bullish on charts and price is trading above the trend line in its daily chart. In 4 hourly chart the price is sustaining above 200 day SMA and taking support of 50 day SMA indicating uptrend of the pair. It is having an important resistance at the level of 1.12750 and support at the level of 1.12232. If it breaks its resistance level on the upside and sustains above it then we can expect it to show further bullish movement in the pair.
EUR/USD
RECOMMENDATION BUY TARGET 1.12750
The Major trend of Euro it is showing strength for buying If it crosses the resistance level then one can initiate buying position in the pair . If it crosses the level of 1.12689 then it can test level for the target of 1.13000 with second target at 1.1430 with the stop loss 1.1175.
CHART FORMATION:-
Euro is trading in a range and trading near the trend line. Breaking the support line will lead to upside movement. Eur is trading above the 50 DMA with a negative bias.
INDICATORS:-
RSI is trading near to 65 levels with a positive bias, in upcoming session upside movement is expected.
MACD and Signal line is sustained above the zero level line.
www.tradingsignalreviews.com

EURUSDWell this is embarrassing really, in my post on the 4hr time, the abcd pattern showed me the PRZ, and i was observing the price action in that zone, a few days ago it was showing a sign of trend reversal but as you can see the market went lower showing that the market can do whatever it wants and we cant be correct all the time. So it is imperative to observe the PRZ before entering the market.
Further if you would look at the 1D posted here..the price is still trading along the x line, according to my rules this is a failed pattern, but a failed pattern in the Daily could also tell us that the general encompassing trend of this pair is weakening and it is starting to reverse. The pink line is my projection of the possible location if this pair should it change direction.
However, we are still trading in the prz of the Daily, and some might still be in the trade cause they put their stop well below the x line, well to me all is not lost, if you would observe the RSI it is starting to climb so in this regard i am still long on this pair.
So trade carefully learn your trade, own your trade and win most of it.
we got a nice doji,
This is my latest update of this pair, today at 7/25/14. 10:54 a.m.
After looking at my reference the failed 1.13 rally up last June 8, 2014 should denote what Scott Carney calls an "extreme bullish impulse wave" leading to a bigger rally upward. So making me more confident that this will still move higher.
