Eurusd1hr


EURUSD Short SetupWatch this pair for a short opportunity.
Follow your rules of entry and money management.

EURUSD 1HR Cypher PatternI am looking to get long at the completion of the cypher pattern. I am going to set my limits and start my weekend.


Analysis and Forecast EUR / USD - Weekly review (25.07-29.07).Last week brought weakening of the euro against the dollar, which was consistent with my assumptions, which I presented in the last daily reports. On Friday also they came to break the bottom of the nearly three-week trend side. Overcoming support at 1,0972-81 may suggest a further weakening of the euro against the dollar, towards the level of 1.0909 (at least after the announcement of a referendum). At this level (1.0909), I expect to activate the demand side, which will certainly defend that level. Any break 1.0909 support will indicate the weakness of the euro, which further confirms the downward trend. In this case, the aim in the longer term may be last year's lows.

EURUSD 1HR Potential CYPHER completionThe market speaks and traders react. As BOE holds off the cypher comes to light.

EURUSD 2nd approach on a short tradeHere's the first technical analysis .
I'm already running short on EURUSD ( +profits! ) so this chart is yet another analysis.
Because i enjoy doing so
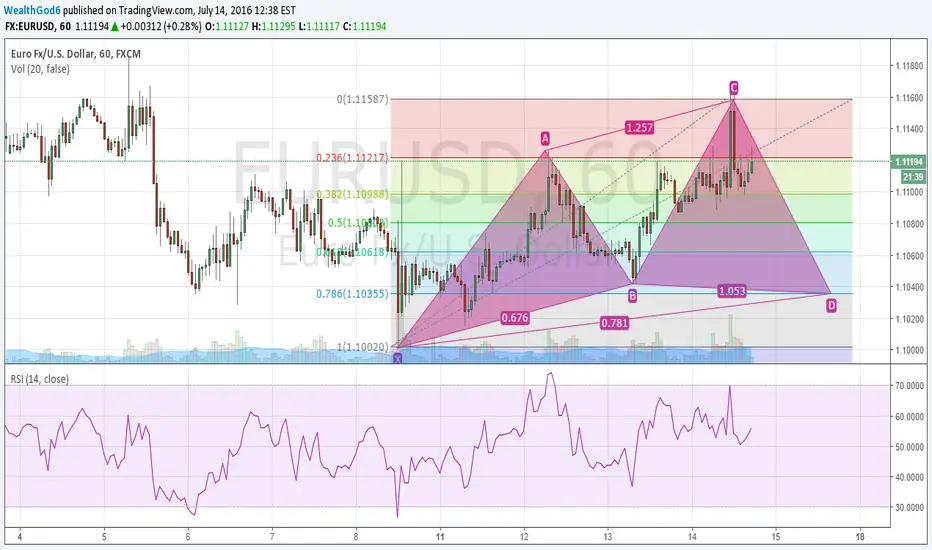
As you can see, there's a nice harmonics pattern which copes with fibonacci levels.
I believe that this fall keeps going down a little more.
I would be pleased to hear your reviews.
Regards


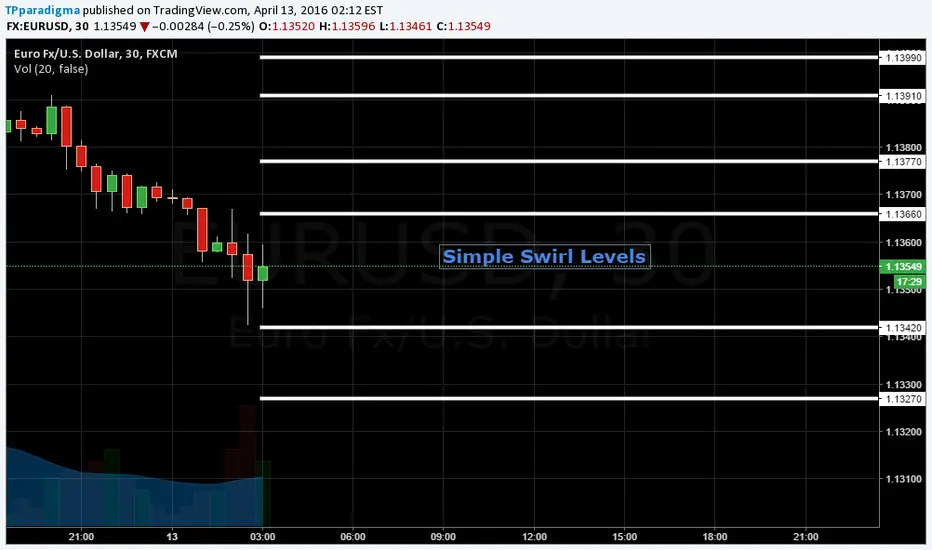
Daily Template 2. EUR USDHello!
These are simple swirl levels, with simple yet powerful trading opportunities. I will update during the day, where will be opened positions and TP's, if EUR USD interacts with these levels.
Yesterday we made nice short and TP was hit.
Trading rules are simple, if eurusd breaks one of these levels up and down or down and up by 5 pips ( without touching the next level ), we wait for it to travel away and look for entry. TP is the level that was broken down/up.
Download this template - www.tpparadigma.com
Register in Forum - www.tpparadigma.org
Don't miss live trades on Periscope.
Login into our MT4 terminal live account and monitor our trades!
Sincerely, TP PARADIGMA.

EURUSD - ENTER LONG AGAIN?Another day - still in the same range
I think it should be pretty clear if you look at this EURUSD chart, support level tested 3 times on 1H TF.
I'm expecting a break-out will see if its going to test the support one more time. i'll put in a pending buy order around the support line. There is U.S. news for tomorrow but i'm hoping to get in at the London open.
Beware that if it breaks thru the support level, that it still can retrace - i don't see any sign to go short but be prepared for every scenario! This time i wont give away my S/L and T/P
GL & HF

100 - 200 Pip Opportunity - EUR/USD Long - 05/02/2016100 - 200 Pip Opportunity - EUR/USD Long - 05/02/2016
The primary trend of EUR/USD is bullish on charts and price is trading above the trend line in its daily chart. In 4 hourly chart the price is sustaining above 200 day SMA and taking support of 50 day SMA indicating uptrend of the pair. It is having an important resistance at the level of 1.12750 and support at the level of 1.12232. If it breaks its resistance level on the upside and sustains above it then we can expect it to show further bullish movement in the pair.
EUR/USD
RECOMMENDATION BUY TARGET 1.12750
The Major trend of Euro it is showing strength for buying If it crosses the resistance level then one can initiate buying position in the pair . If it crosses the level of 1.12689 then it can test level for the target of 1.13000 with second target at 1.1430 with the stop loss 1.1175.
CHART FORMATION:-
Euro is trading in a range and trading near the trend line. Breaking the support line will lead to upside movement. Eur is trading above the 50 DMA with a negative bias.
INDICATORS:-
RSI is trading near to 65 levels with a positive bias, in upcoming session upside movement is expected.
MACD and Signal line is sustained above the zero level line.
www.tradingsignalreviews.com

EUR/USD hits fresh daily highs after fomc minutes.Today the pair dropped to 1.0713, area located around yesterday's lows, forming a potential double bottom in the short term. Currently, with the pair above Asian session highs, the possible target of the distance between 1.0710/20 and 1.0770 is 60/70 pips.
EUR/USD needs to hold above 1.0760/70 in order to keep the bullish bias intact; if it falls below, it would invalidate the formation.


Stumbling the EURUSD legs by the hourOh yeah - I was dead wrong on the short term price action.
Bash me! :-) Well, one cannot be right too often :) . The upward price pressure was certainly more fierce than I anticipated. That did hurt my account too. "Yes, I feel you pain."
As a result, the diagional triangle is gone. The 1.140/1.144 level presents a horizontal barrier.
Nontheless, not much has changed on the EUR USD :
--------------------------------------------------------------------------------
- the overbought and/or almost overbought levels the RSI have not given any clue to a continued bull trend. It simply gyrates between overbought and oversold. This is typical for a period of RANGING price action.
- I'm still suspicious about this EURUSD thing
- Yes, it can break to the upside, but looking at larger swings (4 hour & daily) it "feels" a better ebb & flow if at least one down wave develops now (but this is not particularly scientific in nature :-)
- We've got pretty solid support levels present: currently testing an upward sloping trendline-in-the-making, then the 1.1180 level (red support area), then the 1.1070 level (green support area) .
- It's bad that despite all the "good" Greece news, the 1.14 level ONCE AGAIN turned out to be too hard to break That is a longer term negative for the EURUSD.
I'm still sitting on my short position, but will close it at the aforementioned levels - to see what happens from there - unless we get a great heavy spike down; of course I wouldn't mind that :)

Bearish Pennant Pattern // 1hThe technical sell point is when price penetrates the lower trend line of the pennant area, ideally on volume expansion.
Be patience...

EURUSD 3 PATTERNS SET UP IN PLAYTHIS IS AN INTERESTING SET UP, WE HAVE A TRIPLE HEAD, HEAD AND SHOLUDER PATTERN, A GARTLEY PATTERN, AND MOST INTERESTINGLY, MY SO-CALLED STAIRCASE PATTERN. FIND A SIMILAR ONE IN RELATED IDEAS. IT HAS A 61.8 RETRACE THEN A 23.6 PULLBACK, A FURTHER MOVE DOWN TO OPENING PRICE (100% FIB) AND THE A 38.2 RETRACE OR A RETRACE TO PREVIOUS LOW IN THIS CASE.
THE PAIR LOOK STRONGLY BEARISH BUT A MOVE LIKE THIS IS NOT IMPOSSIBLE SO LETS SEE HOW IT PLAYS OUT.

EURUSD LOOKING FOR 100 PIPS LONGI'VE COMBINED A NUMBER OF STRATEGIES TO GENERATE THIS IDEA BUT ALL ARE PRETTY SIMPLE. THERE IS A PATTERN FORMATION TAKING PLACE. I'VE PLACED THE D POINT AT A STRONG LOOKING SUPPORT THAT I'VE ELLIPSE TO THE LEFT, (YOU WILL HAVE TO SCROLL LEFT). FIB RATIO CONFLUENCE IS WHAT IS USED TO GENERATE THE PRICE MOVEMENT, ALL THE PULLBACKS ARE SOLELY ON THE 50% BECAUSE OF THE PREVIOUS SEQUENCE OF 50%'S.
ALSO THERE IS AN AREA AT THE TOP OF STRONG RESISTANCE, WHICH I'M EXPECTING TO HOLD IT'S GROUND JUST ONE MORE TIME. I'M EXPECTING A 38.2 PULLBACK WHEN TARGET IS ACHIEVED, AND THEN A STRONG MOVE UPWARDS TO BREAK THE STRONG RESISTANCE.
THE PRICE MOVEMENTS IV'E LABELED IN RED AND GREEN IS ONLY A GUIDE SO I CAN BETTER FOLLOW THE PRICE ACTION. SOMETIMES THE PRICE ACTION GOES EXACTLY THAT WAY, BUT OTHER TIMES IT GET THROWN OFF.
LETS SEE HOW IT PLAYS OUT, AND AS ALWAYS, I'D LOVE TO HEAR WHAT YOU THINK.

EURUSD 3 OPTION SHORT3 OPTIONS FOR DECLINE, I'M STICKING WITH NO. 3 BECAUSE OF STRONG RESISTANCE ZONE

EURUSD 2ND OPPORTUNITY TO GET INA FOLLOW UP ON THE PREVIOUS PATTERN I POSTED. STILL LOOKING FOR FURTHER GAINS DOWNWARD.

EURUSD IN PLAY FOR POTENTIAL SHORTINGTreating this as a No.4 wave Elliott, where the No. 4 wave is often saturated with flats and triangle, i'm awaiting confirmation of the next two candles to verify a move down to second channel line. If the market presents a catalyst in favor of my direction. i wouldn't be too presumptuous to set a limit order at 1.31515, rather i'd prefer to bring my stops past break even to a retracement level (cannot be selected now) , watch a lower time frame for reversal candles at target in the event of higher volatility, hold out for further gains downwards. we also have slight divergence showing on stochastic (but not confirmed). presents a good win/loss ratio, using the first stop loss = more gains than second since stop loss should determine the amount won.
