EURUSD at Make-or-Break Zone: Time to Short?EURUSD – Key Data Out Today, Short Setup Confirmed?
Today, several important economic indexes were released for both the Euro(EUR) and the Dollar(USD) . Let’s break them down in a simple way:
Eurozone PMI Data: Mixed to Weak
France:
Manufacturing PMI: 48.4 (slightly lower than forecast)
Services PMI : 49.7 (flat, but below 50 = contraction)
Germany:
Manufacturing PMI: 49.2 (weaker than expected)
Services PMI : 50.1(slightly expansionary)
Eurozone Overall:
Manufacturing PMI: 49.8 (still below 50)
Services PMI : 51.2 (slightly stronger than forecast)
ECB left the Main Refinancing Rate unchanged at 2.15% , which was widely expected.
U.S. Data( TVC:DXY ): Strong and Surprising
Unemployment Claims: 217K (better than expected 227K)
Manufacturing PMI: 49.5 (below forecast of 52.7 – a negative surprise)
Services PMI: 55.2 (well above forecast and previous – bullish for USD)
Interpretation :
The Eurozone's growth remains sluggish, especially in France and Germany.
Despite a drop in U.S. manufacturing, the services sector remains strong, and unemployment data confirms labor market resilience.
This mixed picture slightly tilts the balance in favor of the U.S. dollar, especially as the ECB remains on hold while the Fed may still consider being restrictive.
Bias: Short EURUSD ( FX:EURUSD )
Fundamentals support a Short position in EURUSD, in line with the current technical setup.
---------------------------------
Now let's take a look at the EURUSD chart on the 4-hour time frame to find the best Short position .
EURUSD is currently trading in an Ascending Channel and at a Heavy Resistance zone($1.1845-$1.1602) .
Also, in terms of Elliott wave theory , it seems that EURUSD is completing a microwave 5 of the main wave 5 .
One of the most important supports ahead for EURUSD could be the 100_SMA(4-hour TF) .
If the currently 4-hour candlestick forms a Shooting Star Candlestick Pattern , it is a better sign for EURUSD to fall .
Also, we can see the Regular Divergence(RD-) between Consecutive Peaks .
I expect EURUSD to decline to at least $1.169 AFTER breaking the lower line of the ascending channel .
Second Target: Support zone($1.1642-$1.158) and Monthly Pivot Point.
Note: Stop Loss(SL)= $1.1850
Please respect each other's ideas and express them politely if you agree or disagree.
Euro/U.S. Dollar Analyze (EURUSD), 4-hour time frame.
Be sure to follow the updated ideas.
Do not forget to put a Stop loss for your positions (For every position you want to open).
Please follow your strategy and updates; this is just my Idea, and I will gladly see your ideas in this post.
Please do not forget the ✅' like '✅ button 🙏😊 & Share it with your friends; thanks, and Trade safe.
Eurusdanalysis

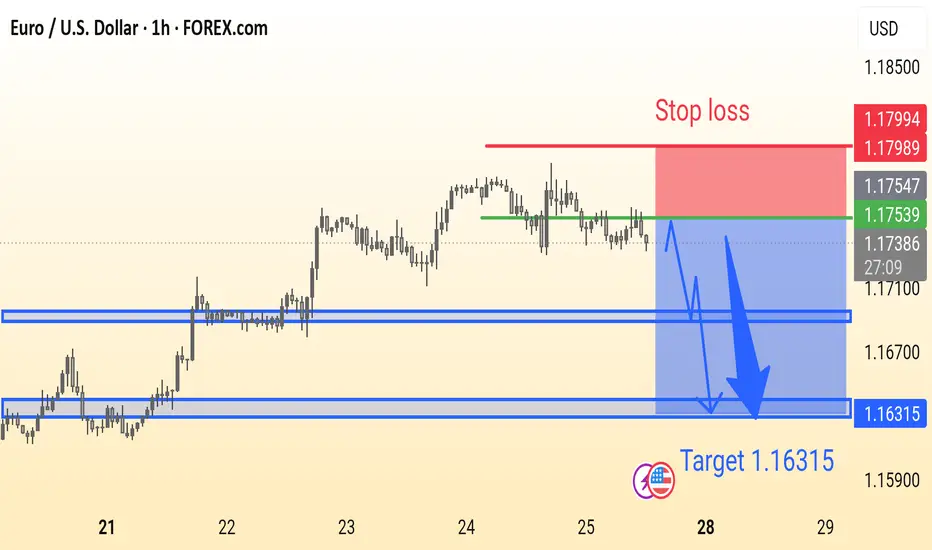
EURUSD Analysis is ReadyEUR/USD Trade Idea (1H Chart):
Price is ranging below resistance with a potential bearish breakout. Suggested Sell near 1.1753 with Stop Loss at 1.1799 and Target at 1.16315. Strong support zones marked for possible reaction.
EURUSD SELLEUR/USD stays defensive below 1.1800 ahead of ECB decision
EUR/USD remains in a bullish consolidation mode below 1.1800 in European trading on Thursday. Traders refrain from placing fresh bets ahead of the European Central Bank policy announcements and the US preliminary PMI data. Mixed PMI data from Germany and the Eurozone failed to trigger a noticeable reaction.
The EUR/USD pair retreated from a fresh two-week peak at 1.1781 posted during Asian trading hours, hovering around 1.1750 ahead of the European Central Bank (ECB) monetary policy announcement. The US Dollar (USD) edged lower on the back of risk appetite, amid headlines indicating a trade deal between Japan and the United States (US).
US President Donald Trump announced in a post on social media a trade deal with Japan that sets "reciprocal" tariffs at 15% on Tuesday, while Japanese Prime Minister Shigeru Ishiba acknowledged the trade agreement on Wednesday, saying it would benefit both sides. Trump shifted his attention to the European Union (EU), noting that if the Union agrees to open up to US businesses, he will then charge lower levies.
Meanwhile, the Hamburg Commercial Bank (HCOB) published the preliminary estimates of the July Purchasing Managers’ Indexes (PMIs). European growth stands at its highest in almost a year according to the surveys, as the Composite PMI rose to 51.0 in July from 50.6 in Jun,e while beating expectations of 50.8.
As for the ECB, the central bank announced its decision to keep the benchmark rates on hold, as widely anticipated. The interest rate on the main refinancing operations, the interest rates on the marginal lending facility and the deposit facility stood at 2.15%, 2.4% and 2%, respectively. The headline had no impact on EUR/USD, which kept trading at around 1.1750.
Right afterwards, the US released Initial Jobless Claims for the week ended July 19, which improved to 217K from the 221K previously posted and the 227K anticipated. Coming up next is ECB President Christine Lagarde's press conference, and the US S&P Global preliminary July PMIs.
SUPPORT 1.17118
SUPPORT 1.16767
SUPPORT 1.16316
RESISTANCE 1.17937
RESISTANCE 1.17703

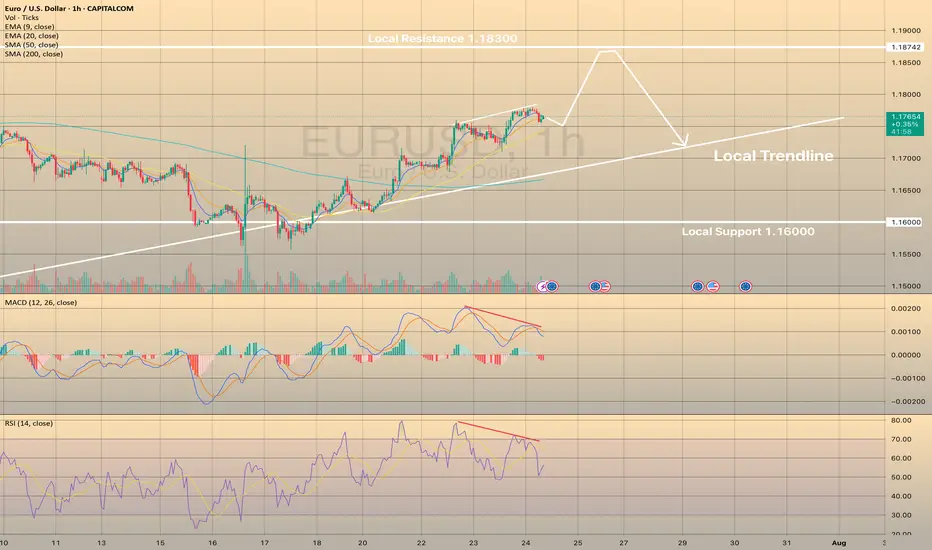
EURUSD IS ON ITS WAY TO LOCAL HIGHSEURUSD IS ON ITS WAY TO LOCAL HIGHS
EURUSD successfully rebounded from local support of 1.16000 and since then continues to rise towards local resistance of 1.18300. Recently the price has started to show the bearish divergence on RSI and Macd indicators. MACD went into the red zone.
What is the bearish divergence?
Bearish divergence is a technical analysis pattern where the price makes higher highs in an uptrend, but a momentum indicator (e.g., RSI, MACD) forms lower highs, signaling weakening bullish momentum and a potential downward reversal. To trade, identify the divergence in a clear uptrend with the indicator showing lower highs (e.g., RSI above 70). Sell or short when the price confirms a reversal (e.g., breaks below a support level or trendline) with increased volume. Set a stop-loss above the recent high. Target the next support level.
Generally speaking, it doesn't necessarily mean that EURUSD will drop immediately, the price may even grow a bit. However, it highlights some short opportunities.
DeGRAM | EURUSD breakout📊 Technical Analysis
● Breakout – candles have closed twice above the channel roof (black), then retested 1.1690 as support (blue circled zone); the pull-back printed higher-lows along the intraday trend-line, confirming a bullish transition.
● The flag forming beneath 1.1750 measures toward the confluence of the July swing high and rising fork top at 1.1810; invalidation rests at the last swing-low 1.1615.
💡 Fundamental Analysis
● Euro sentiment improves after Euro-area core CPI edged up to 2.9 % y/y while soft US durable-goods orders trimmed 2-yr Treasury yields, narrowing the rate gap.
✨ Summary
Buy 1.1685-1.1700; hold above 1.169 targets 1.175 ➜ 1.181. Exit on an H1 close below 1.1615.
-------------------
Share your opinion in the comments and support the idea with a like. Thanks for your support!

DeGRAM | EURUSD in the consolidation zone📊 Technical Analysis
● Price broke the month-long bearish channel and is now basing inside the 1.165-1.169 consolidation block; repeated intraday retests (blue zone) turn the former cap into fresh support.
● A steep hourly up-sloper is carving successive higher-lows; its width and the prior channel depth project follow-through toward 1.1745 (mid-July pivot) with room to the next swing line at 1.1800.
💡 Fundamental Analysis
● FXStreet highlights softer US PMIs and a pull-back in 2-yr yields, while ECB sources flag “data-dependent patience” rather than imminent cuts—narrowing the short-rate gap and favouring the euro.
✨ Summary
Long 1.1650-1.1680; hold above the blue base targets 1.1745 ➜ 1.1800. Long view void on an H1 close below 1.1615.
-------------------
Share your opinion in the comments and support the idea with a like. Thanks for your support!

EUR/USD Elliott Wave Update –Classic Wave 5 Breakout OpportunityThis chart of the EUR/USD pair shows a well-structured Elliott Wave impulse pattern unfolding on the 4-hour timeframe. The price action is currently progressing in the final Wave (5) of the impulse cycle, which typically represents the last bullish leg before a larger correction begins.
Wave (1): The initial move up from the bottom (early May), showing a clean 5-wave internal structure.
Wave (2): A healthy retracement after Wave 1, forming a base for further upside.
Wave (3): The strongest and steepest rally, as expected in Elliott theory. It broke past previous highs and extended sharply.
Wave (4): A corrective phase that formed a falling wedge pattern — typically a bullish continuation pattern.
Wave (5): Currently in progress. The wedge has broken to the upside, confirming the potential start of Wave 5.
Target 1 (T1): 1.18306
Target 2 (T2): 1.19012
Stop Loss (SL): 1.16600
After a strong uptrend, the market went sideways in a wedge pattern (a typical wave 4 behavior). It has now broken out, signaling the start of the final wave 5 move. This is often a strong and sharp push. Since the breakout is clean and the Elliott wave count aligns well, this creates a favorable long opportunity

EUR/USD Eyes $1.179 If Resistance BreaksFenzoFx—EUR/USD is testing the 100-day moving average as resistance, a supply zone backed by VWAP at $1.171. The Stochastic Oscillator depicts 81.0 in the description, meaning the Euro is overpriced in the short term.
Therefore, we expect the pair to test the $1.160 demand zone before the uptrend resumes. Furthermore, the bullish outlook remains valid above $1.155, and a break above resistance at $1.171 can trigger the uptrend, targeting $1.179.

Key resistance for EURUSDYesterday, EURUSD moved higher and reached a key resistance level at 1,1720.
Watch closely to see if there’s enough momentum for a breakout and further upside.
If the price gets rejected, we could see a deeper correction.
Increased volatility is likely on Thursday following the ECB decision.
At the current levels, there’s no clear reason to enter a trade.

DeGRAM | EURUSD moving in an ascending channel📊 Technical Analysis
● Bulls punched through the 11-day descending trend-line (circled “breakout”) and immediately based on it, keeping the rising 30-min channel of higher-lows intact.
● The next confluence lies at 1.1665 where the channel mid-line meets the prior swing top; clearance unlocks the upper band / July supply at 1.1692-1.1700.
💡 Fundamental Analysis
● Friday’s slide in US 2-yr yields after soft existing-home-sales and mixed Fed speak trims dollar carry, while pre-ECB-meeting sources stress “data-dependent patience,” limiting euro downside.
✨ Summary
Long 1.1635-1.1650; hold above 1.1665 targets 1.1692 → 1.1700. Bias void on an H1 close below 1.1615.
-------------------
Share your opinion in the comments and support the idea with a like. Thanks for your support!

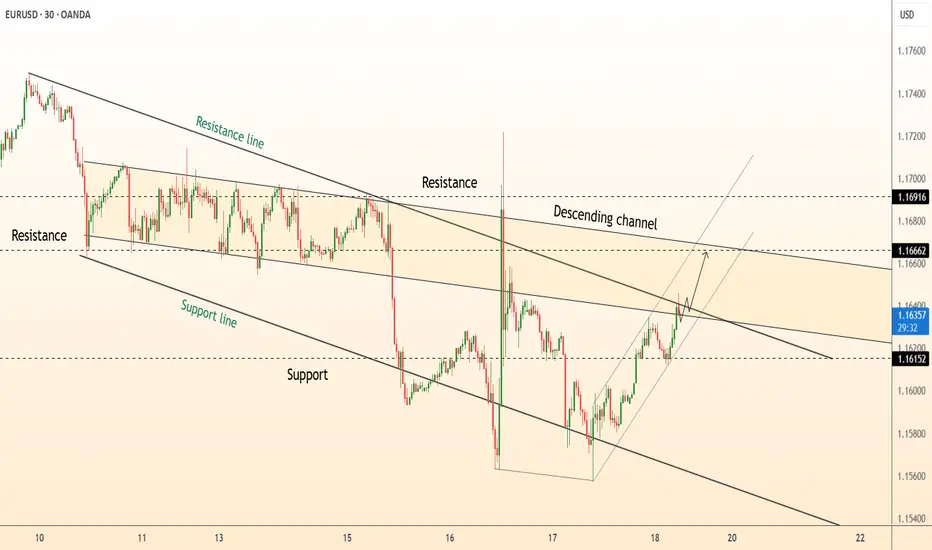
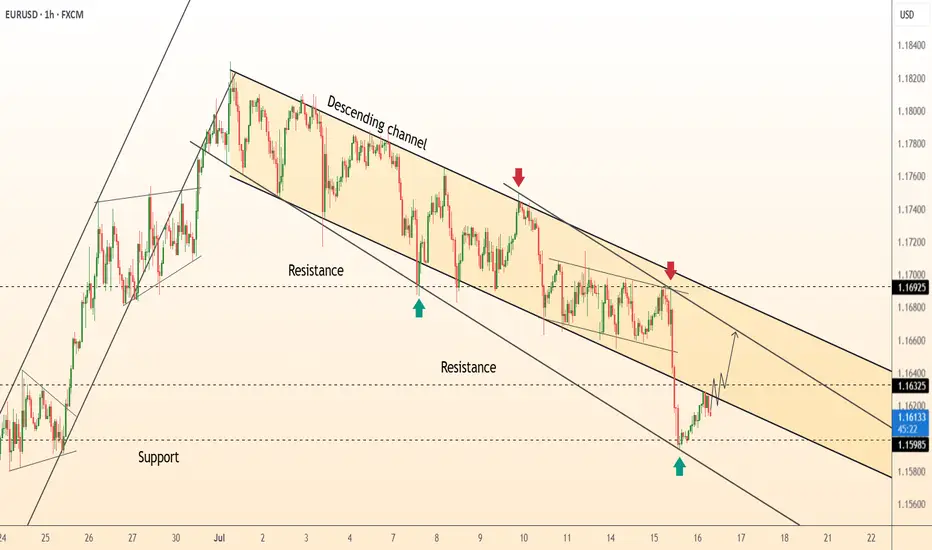
EURUSD FOUND SUPPORT, READY TO BREAK THE CHANNELEURUSD FOUND SUPPORT, READY TO BREAK THE CHANNEL🔥
EURUSD has been trading within the descending channel since the beginning of the descending channel. Recently the price reached the major trendline, graph started to show the bullish divergence on the RSI .
What is a bullish divergence?
A technical analysis pattern where the price makes lower lows, but a momentum indicator (e.g., RSI, MACD) forms higher lows, signaling weakening bearish momentum and a potential trend reversal upward.
So, another hike in this pair is expected. Possible direction: spike towards the SMA200, minor pullback and a further development of the bullish impulse.

DeGRAM | EURUSD reached the resistance line📊 Technical Analysis
● EUR/USD has reclaimed the inner resistance of the 8-day descending channel after a V-shaped rebound from the lower rail; candles are now riding a fresh micro up-sloper.
● A 30 min close above 1.1666 (channel roof / prior pivot) confirms trend reversal and projects the measured move to the higher congestion band at 1.1690-1.1700.
💡 Fundamental Analysis
● Yesterday’s dip in US 2-yr yields after weaker Philly-Fed new-orders and higher jobless claims softens dollar demand, while ECB minutes signalled no rush to ease further, supporting the euro.
✨ Summary
Long 1.1630-1.1650; break of 1.1666 targets 1.1690 → 1.1700. Invalidate on an H1 close below 1.1585.
-------------------
Share your opinion in the comments and support the idea with a like. Thanks for your support!
EURUSD BUYThe EUR/USD pair edged lower in the past week, settling a handful of pips below the 1.1700 mark, further retreating from the multi-year peak posted early in July at 1.1830. Financial markets kept revolving around the United States (US) President Donald Trump's targets. With geopolitical woes cooling down, Trump’s focus returned to tariffs, and the Federal Reserve’s (Fed) wait-and-see stance on monetary policy.
Trump fixated on tariffs and Powell
Since the week started, speculative interest kept their eyes on the July 9 tariffs deadline. Trump announced massive retaliatory levies on over 180 trading partners in May, quickly establishing a 90-day grace period afterwards. His goal was to clinch better trade deals with all these nations. But as the date loomed, deals were scarce. The US made some trade arrangements with some minor economies, such as Vietnam, but there were none with major counterparts, nor, of course, with China
TP 1 1.162
TP 2 1.165
TP 3 1.168
RESISTANCE 1.154

EUR/USD Resumes Bearish Trend Below $1.176FenzoFx—EUR/USD trades bearish, below the 100-SMA, and is currently testing the bullish FVG as support. Yesterday, Euro failed to pass the immediate resistance at $1.176; therefore, we expect the bearish bias to resume.
In this scenario, EUR/USD's downtrend could extend to the next support level at $1.151. Please note that the bearish outlook should be invalidated if Euro closes and stabilizes above $1.176.

DeGRAM | EURUSD rebound from the trend line📊 Technical Analysis
● Price printed a hammer and bullish RSI divergence on the lower rail of the 3-week descending channel (green arrow 1.1598), breaking the inner wedge that guided last leg down.
● First resistance is the channel mid-line / prior pivot 1.1632; a move through it exposes the upper band near 1.1692, where July supply and the larger bearish trend-line converge.
💡 Fundamental Analysis
● Softer US retail-sales control-group and Daly’s “more evidence needed” remarks cooled 2-yr yields, trimming dollar support, while ECB’s Knot said additional cuts “are not imminent,” limiting euro downside.
✨ Summary
Long 1.1600-1.1620; hold above 1.1632 targets 1.1690. Long view void on an H1 close below 1.1580.
-------------------
Share your opinion in the comments and support the idea with a like. Thanks for your support!
DeGRAM | EURUSD fixed under the resistance level📊 Technical Analysis
● Price is stalling against the upper band of a three-month rising channel (≈ 1.1790) after producing a false break and quick rejection—marking a potential bull-trap at trend resistance.
● Bearish divergence on the 4 h RSI and the first lower-high inside a micro rising wedge suggest momentum is fading; a slide through 1.1745 should trigger profit-taking toward the mid-channel support at 1.1595.
💡 Fundamental Analysis
● Solid US payrolls and a hawkish tone in FOMC minutes lift two-year yields, reviving the dollar bid, while post-election coalition wrangling in France keeps a risk premium on the euro.
✨ Summary
Sell 1.1785 ± 15 pips; break below 1.1745 targets 1.1595. Invalidate on a 4 h close above 1.1810.
-------------------
Share your opinion in the comments and support the idea with a like. Thanks for your support!

Important News for EURUSDYesterday, EURUSD continued moving sideways as the market waits for upcoming news.
Today at 1:30 PM London time, U.S. inflation data will be released.
This report has a strong impact and is likely to set the next direction for the pair.
It’s advisable to reduce your risk and avoid opening new positions before the news comes out.
The goal is to follow the trend once it resumes!

Euro Tests $1.170 Support in Bearish ChannelFenzoFx—Euro trades in the bearish channel, testing the $1.170 support. A close below this level can trigger a new bearish trend toward the next demand zone at approximately $1.156.

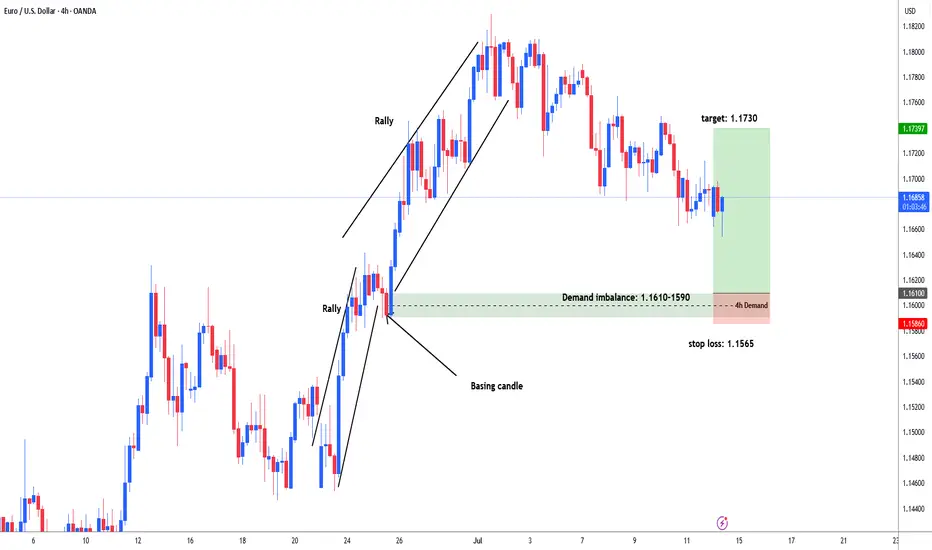
EURUSD possible long from 1.1610 area for 1.1730#eurusd market rallied 1.1450 - 1.1640. then consolidation between 1.1580-1640 area. Institutions put more buy orders and price rallied again after bases out and reached upto 1.1830 area. Now market sell off / retracement to test demand area to fill the remaining unfilled order for another leg higher. Demand zone: 1.1610-1.1590. stop loss: 1.1565, target: 1.1730. in weekly and daily chart market forming distribution shape for big sell opportunity.
EURUSD Weakened By New Tariff Tensions With US This is the Weekly FOREX Forecast for the week of July 14 - 18th.
In this video, we will analyze the following FX market: EURSUD
The latest headlines tell the story. The tariffs are triggering a slow run to the USD safe haven. The previous week showed the USD Index closed pretty strong. There's a good chance we'll see more of the same this coming week.
Look for the strength in USD to continue to be supported by fundamental news, and outperform the other major currencies, including the EURO.
Buy USD/xxx
Sell xxx/USD
Enjoy!
May profits be upon you.
Leave any questions or comments in the comment section.
I appreciate any feedback from my viewers!
Like and/or subscribe if you want more accurate analysis.
Thank you so much!
Disclaimer:
I do not provide personal investment advice and I am not a qualified licensed investment advisor.
All information found here, including any ideas, opinions, views, predictions, forecasts, commentaries, suggestions, expressed or implied herein, are for informational, entertainment or educational purposes only and should not be construed as personal investment advice. While the information provided is believed to be accurate, it may include errors or inaccuracies.
I will not and cannot be held liable for any actions you take as a result of anything you read here.
Conduct your own due diligence, or consult a licensed financial advisor or broker before making any and all investment decisions. Any investments, trades, speculations, or decisions made on the basis of any information found on this channel, expressed or implied herein, are committed at your own risk, financial or otherwise.

The trend continues for EURUSDYesterday, EURUSD once again tested the support level at 1,1683 and bounced off it.
The uptrend remains strong, and we are monitoring for its continuation.
All positions should align with the main trend.
Watch for the end of the current pullback as a potential buying opportunity.
The next resistance levels are 1,1813 and 1,1916!

EUR/USD Bullish Setup from Key Support📈 EUR/USD Bullish Setup – Targeting 1.18500
Timeframe: 4H
Pair: EUR/USD
💡 Analysis:
The market is currently showing strong bullish momentum with clear support zones holding price action. After a healthy retracement, price is reacting well around the recent support level near 1.16800. If this level holds, we can anticipate a bullish continuation toward the target resistance zone at 1.18500.
🔶 Support Levels:
1. 1st Support Area: ~1.16800 – Recent consolidation and strong reaction zone
2. 2nd Support Area: ~1.15800 – Previous breakout level
3. 3rd Support Area: ~1.14300 – Major structure support
🎯 Target Point:
• 1.18500 – Major resistance and previous swing high
📊 Trade Idea:
We are looking for a bullish move from the current price level (~1.1700) toward the resistance at 1.1850. If price respects the nearest support zone, long entries with proper risk management could be favorable.

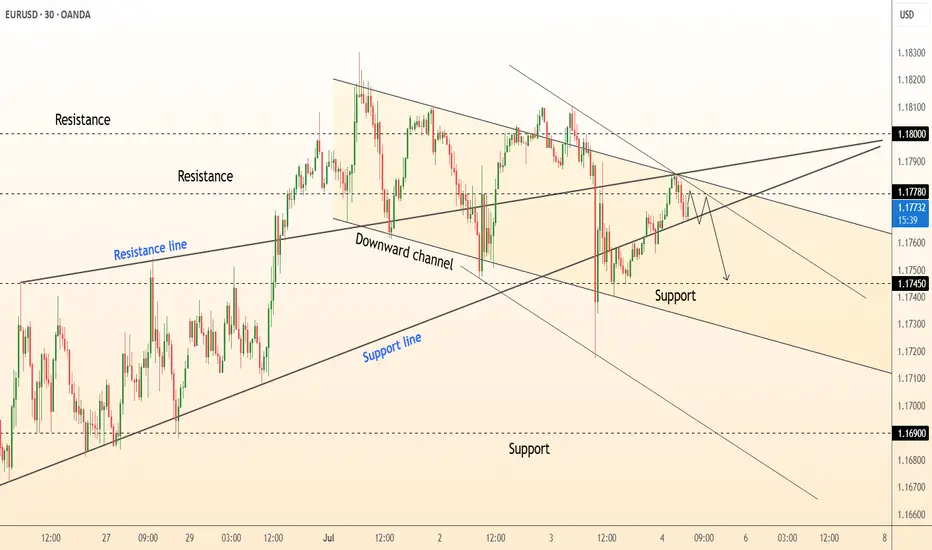
DeGRAM | EURUSD downturn in the channel📊 Technical Analysis
● Price is capped by a confluence of the June-July down-sloping channel roof and the former median resistance line at 1.1780; the last three candles form lower highs inside a micro bear-flag.
● Intraday structure now leans on the 1.1745–1.1750 support cluster: a break beneath this shelf completes the flag and exposes the channel floor/June pivot at 1.1690.
💡 Fundamental Analysis
● Pre-NFP dollar demand is rebuilding as ADP and ISM-services beat consensus, while French election uncertainty revives euro risk premium.
✨ Summary
Sell 1.1775 ± 5 pips; sustained trade below 1.1745 targets 1.1690. Short thesis void if 30-min candle closes above 1.1800.
-------------------
Share your opinion in the comments and support the idea with a like. Thanks for your support!