EURUSD - Outlook Hello Traders,
Another good buying opportunity on EURUSD as the DXY slumps. It's a short term buy so if it fits your strategy, it is trade-able for short term and then we might get a good opportunity to sell from the top.
It's not a trade setup and i don't trade until i see if it fits my strategy.
Good luck!
Eurusdbreakout

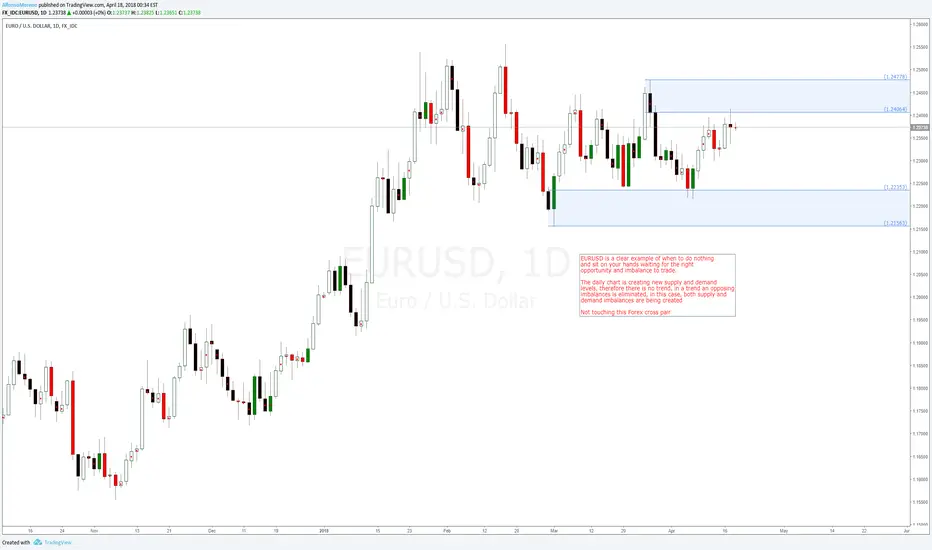
EURUSD forex cross pair is ranging on the daily timeframeEURUSD is a clear example of when to do nothing and sit on your hands waiting for the right opportunity and imbalance to trade.
The daily chart is creating new supply and demand levels, therefore there is no trend, in a trend an opposing imbalances is eliminated, in this case, both supply and demand imbalances are being created
Not touching this Forex cross pair.


EUR/USD slides towards 1.20EUR/USD slides towards 1.20
New trading week the common European currency started with depreciation against the American Dollar. The downward movement was partially driven by a one week-long inverse head and shoulders pattern and partially by a recent bounce off from the two-year high located at the 1.2093 level. However, today the plunge most probably will be stopped near the bottom trend-line of a medium scale ascending channel, which is additionally backed up by the updated weekly S1 at 1.1992. If a rebound occurs, the pair will resume the surge trying to hit combined resistance level formed by the weekly PP at 1.2040 and the 55- and 100-hour SMA.

EUR/USD rebounds from 1.2005EUR/USD rebounds from 1.2005
New trading session the currency exchange rate started with a rebound from alleged support zone located between the 1.2005 and 1.1992 levels. Until release of information on employment change in the United States the pair is expected to spend fluctuating in a two-day long junior descending channel whose boundaries are covered by the 55- and 100-hour SMAs. Due to existence of the above support area and the medium scale uptrend the Euro is expected to continue to appreciate against the Dollar tending to reach and test the two year maximum at the 1.2100 mark. In general, there is a need to keep in mind changes in traders’ sentiment, which is becoming too bearish that in nearest perspective might lead to a new turnaround.

EUR/USD sneaks below monthly PPEUR/USD sneaks below monthly PP
As it was projected yesterday, an attempt of the currency exchange rate to reach the 1.1866 level was neutralized by the slipping 55-hour SMA. Accordingly, the Dollar continued to appreciate against the Euro. The only difference is that this downward movement led to transformation of a descending channel into the falling wedge formation. The new pattern presupposes an upcoming rebound, which might happen once the pair will reach the 38.2% Fibonacci retracement level located at 1.1760.
However, even in case this scenario materializes the surge might not last for long due to pressure of three moving averages. In addition to that, the northern side is covered by the support-turned-resistance monthly PP at 1.1806. There is also a need to take into account the fundamental factor, which might break the pattern and continue pushing the pair to the bottom.

EURUSDSInce the false break out on our trend has reached our previous low price just to retest before entering our channel again without a bounce. Such cases people who traded the breakout would be hurt, thats why as a pro trader, you DO not trade the breakout, but you wait for the retest and however if there were no retest, then we would procceed on entering the trade below the last low of the breakout.

Looking to SELL a POTENTIAL PULLBACK on EUR/USDEUR/USD has just broken through a MAJOR 4 Hour Resistance (blue line on the chart).
The last 4-hour candle was a doji which signifies indecision and a potential reversal point.
I will be watching the 5 & 15 minute charts for a close below the low of the 4 hour candle (bottom purple line on the chart) to short down to the 4 Hour Resistance (now turned support). If a candle on the 5 & 15 minute charts closes above the high (top purple line on the chart), I will be looking to go long.
LET ME KNOW WHAT YOU GUYS ARE THINKING ABOUT EUR/USD IN THE COMMENTS SECTION BELOW!
EURUSD - BUY breakout after bounce from 0.5 FibBUY breakout of channel after bounce from 0.5 Fib retracement from original move up.
FX:EURUSD

EUR/USD trades near 1.16 amid Chinese data releaseEUR/USD trades near 1.16 amid Chinese data release
In line with expectations, the currency exchange rate continued to move in southern direction under pressure from the 55-hour SMA. A short dip below the weekly S1 located at the 1.1573 level as well as the subsequent recovery signified two confirmation points, thus confirming existence of a fully-fledged junior descending channel. As the upper-trend line of the pattern is additionally protected by the slipping 100- and 200-hour SMAs, the pair is not expected to make a sudden breakout to the north.
Accordingly, today the exchange rate is expected to test an area near the 1.1555 mark, which might represent a notable support barrier. The average market sentiment, which remains 58% bearish, confirms this general direction. However, the above assumption might be altered due to beginning of Trump visit to China.

EURUSD Medium Term updatePast few weeks we shorted EURUSD at 1.1875 for a target to 1.1425, i am now setting the target to 1.1457.

EURUSD Short at 1.158Our preference: short positions below 1.1620 with targets at 1.1580 & 1.1570 in extension.
Alternative scenario: above 1.1620 look for further upside with 1.1640 & 1.1665 as targets.
Comment: the RSI is mixed and calls for caution.

EUR/USD SELL - 31/10/2017As expected, EUR / USD corrected upwards after the rapid price fall last week. The upward price movement was smooth and on small volume, which cannot be regarded as a market reversal or a bullish signal. Moreover, two levels of resistance remain at the top of the chart: the first is 1.1692- 1.1705 and the second is 1.1740-1.1760. Both levels contain large volume, so they are excellent places to put stop losses above them. Thus, given the sharp fall of the price last week and the presence of 2 strong resistance levels, it is necessary to give preference to short positions for this currency pair. Sales should be opened after the resumption of the price fall, it is desirable if it is supported by increased/large volume, which would be a stronger signal. A stop loss should be placed above the level of 1.1705. The potential of the deal is more than 120 points.
The bottom line: short positions after a resumption of the fall.

EUR/USD SELL - 30/10/2017EUR/USD continued falling on Friday, so the local downtrend for this currency pair is going on. Also we need to point out the presence of 2 strong volume resistance levels: 1.1692 - 1.1705 and 1.1740 - 1.1760. That’s why our previous scenario remains the same: we need to wait for a smooth upward correction of the price in order to get a better entry point and then we should open short positions. A stop loss should be placed above the first resistance. A potential of the deal is more than 100 points.
The bottom line: short positions after a smooth upward correction.

EUR/USD breaks upwardsMorning outlook - EUR/USD breaks upwards
In result of a decrease of the American unemployment rate, traders tried to push the pair through the bottom trend-line of a large falling wedge pattern. However, it made a rebound and in the early Monday morning left the formation in the northern direction.
The surge was not sharp, as the pair still needs to cross a combination of the upper edge of a junior descending channel and the 200-hour SMA. In addition to that, it stuck near the updated weekly PP at 1.1740 that is backed up by the 100-hour SMA.
These obstacles as well as the Friday’s jump by 34 basis points just in hour suggest that the rate is likely to retreat for some time. An aggregate of technical indicators support this scenario. In addition to that, market sentiment remains 57% bearish.

EURUSD STILL BULLS ARE IN CONTROL!!!MARKET ANALYSIS: The pair is now trading near the demand zone . Now after the completion of the head and shoulder pattern, We can see a double bottom which has been formed now. If the market sustains above the double bottom level. We can expect a uptrend early. In case demand breaks wait for the market to reach the 61.8% level then can enter a long position again. So lets wait and see what the market does in the coming days. Cheers!

EURUSD short speculationShorting Based on :
1) Indicator
2) Trendline
3) Forecast on DXY 0.06% strength

EURUSD Medium TermEURUSD got nice momentum this year (2017) followed by a monthly divergence, accelerated in a multi-month bullish channel with new tops and lows. Momentum is slowing on higher time frames, i am expecting a deeper retreat over the coming weeks or so. For now i am looking EURUSD to pullback (a short lived bounce) to leave a lower top to then start of fresh falls towards 1.1425 (a prior support and 38.2% retracement area).
Strategy: Short on a pullback around 1.1827-95 for a target to 1.1625 and then 1.1425. Place a wider stop above 1.2035


Eurusd Sell Perfect idea Eurusd sell on pullback to 1.1850 - 1.1870 area stop loss 1.1960 and
tp1 is 1.1700 tp2 is 1.1300 tp3 1.0700
Trade with care and happy trading
if you like My idea then follow and like me
Asad Ullah

EUR/USD prepares for Draghi and Yellen speechesMorning outlook - EUR/USD prepares for Draghi and Yellen speeches
An hourly chart reveals that the Euro is moving against the American Dollar in a short-term symmetrical triangle, as traders await both Mario Draghi and Janet Yellen speeches that will be delivered later this day at the Jackson Hole Symposium.
From a technical perspective, a breakout to the northern direction seems more possible, as the currency pair experiences pressure from the 55- and 100-hour SMAs from the bottom. In addition, the upper area lacks any notable resistance barriers in the next 45-pip range.
However, if the downfall happens, then in the worst case scenario it should be stopped by the 100% Fibonacci retracement level at 1.1714.

EURUSD INSTITUTIONAL WAY OF TRADING!!!MARKET ANALYSIS: As we can see from the current market scenario the pair has broken a long consolidation which was lasting for the past 30 months has been broken. Now the market is moving towards the next possible supply which is accompanied by a a long term descending channel resistance.
As we can see from the 4hr chart the market is making a good higher high and higher lows. So the possibility for a trend continuation is seen clearly. The best trade setup would be to go with the market trend. Cheers!
