EURUSD LONG NOWPersonally I never trair this pair but it seams too clear to miss it
Levels in the chart
Eurusdbuy

EURUSD LIVE TRADEHello friends
Given the formation of an ascending channel and the price rebounding from the bottom of the channel, we can trade with risk and capital management.
*Trade safely with us*


EUR USDHello Traders. I want to share my weekly analysis for EURUSD with you. We have a channel from July 2008 to April 2025. Currently, it has made a breakout and I hope it will continue the bullish scenario.
I am not a professional trader and I would be happy if you share your views regarding EURUSD.

EUR/USD — Smart Money Concept (SMC) AnalysisStrategy Framework: SMC (CHOCH, POI, Supply/Demand Zones)
---
Key Concepts on Chart
CHOCH (Change of Character)
Confirmed bullish CHOCH from higher timeframe demand zone (orange). Signals intent of bullish reversal.
✅ Strong Demand Zone (Yellow Box)
H4 demand zone holds — price swept liquidity below recent swing low and respected demand.
✅ Target Supply Zones (Marked in Yellow)
1st target: 1.1450 – 1.1500
2nd target: 1.1550 (High timeframe supply)
✅ Elliott Wave Context
Wave (4) completion + bullish impulse toward Wave (5) continuation possible — aligning with SMC bias.
Entry Idea:
> Long after confirmed CHOCH & mitigation of minor demand zone (~1.1240 – 1.1260)
Target 1:
> 1.1420–1.1450 Supply Zone
Target 2:
> 1.1500–1.1550 Higher Supply Zone
Invalidation (Stop Loss):
> Below major demand (

EURUSD Will it go up or continuously go down?3 week long consolidation period of price action finally over after breaking out below the consolidation reaching the weekly FVG . Will it be get respected? Or will it turns out to be an IFVG.

EUR/USD Bullish Reversal Setup – Demand Zone to Target 1.15646🔍 Current Price: 1.13414
📉 EMA (70): 1.13334
Price is slightly above the EMA → Bullish hint ✅
Key Zones & Levels
🟦 Demand Zone:
📍 1.12441 ➡️ 1.12985
Strong buying interest here!
Price bounced from this zone → 📈 Possible reversal
🔵 Entry Point: 1.12985
🛑 Stop Loss: 1.12441
🎯 Target: 1.15646
Trendline Watch
📉 Descending trendline is being tested/broken
🟠 If price holds above the trendline + EMA → CONFIRMATION for long entry ✅
Trade Setup
Buy Entry: 1.12985
TP: 1.15646 🎯
SL: 1.12441 🔻
Risk–Reward Ratio: ~ 1:4.8 ⭐️⭐️⭐️⭐️⭐️
Visual Flow:
🔵 Demand Zone
⬆️
Break EMA & Trendline
⬆️
🎯 Target Zone (1.15646)
Summary:
Looks like a sweet bullish setup from the demand zone!
If price stays above EMA and trendline → Go Long ✅

EUR/USD Bullish Breakout Trade Setup – Targeting 1.18089Entry Point: 1.13860
Stop Loss Zone: 1.13642 to 1.12578
Resistance Point: 1.14320
Target (TP) Point: 1.18089
🔍 Observations
Support Zone: Marked in purple near the entry and stop-loss area, suggesting a strong demand zone.
Resistance Zone: Around 1.14320, indicating a potential breakout level.
Trend: Short-term uptrend after a consolidation range.
Risk/Reward Ratio: Quite favorable, targeting a move of approximately 470+ pips (4.20% gain) from entry to target.
📊 Technical Indicators
Moving Averages:
Red (likely 20 EMA): Price recently crossed above, showing bullish momentum.
Blue (likely 50 or 200 EMA): Serving as dynamic support.
Price Action: Formation suggests a potential breakout from resistance toward the 1.18 target.
🧠 Conclusion
This is a long (buy) setup expecting a bullish breakout:
Buy entry above the support zone.
Stop-loss placed below major support (1.12578).
Target set significantly higher, aligning with prior structure or resistance at 1.18089

EURUSD Short Term Buy Idea Update!!!Hi Traders, on April 15th I shared this idea "EURUSD Short Term Buy Idea"
Expected retraces and further continuation higher until the strong support zone holds. You can read the full post using the link above.
Price moved as per the plan!!!
Retraces happened as expected and then the price moved higher further.
If you enjoy this idea, don’t forget to LIKE 👍, FOLLOW ✅, SHARE 🙌, and COMMENT ✍! Drop your thoughts and charts below to keep the discussion going. Your support helps keep this content free and reach more people! 🚀
--------------------------------------------------------------------------------------------------------------------
Disclosure: I am part of Trade Nation's Influencer program and receive a monthly fee for using their TradingView charts in my analysis.

#EURUSD
#EURUSD H1
There are two steps to enter: low risk and high risk. The red line is also used to indicate the risk-free limit when you are in profit.

How Smart Money is Positioning in EUR/USD – 5 Scenarios UnfoldedLiquidity Maps & Trap Zones: EUR/USD 1H Breakdown
EUR/USD SMC Analysis – Scenarios Overview
1. Case 1 – Immediate Pump:
The market may pump directly from the current market price (CMP) and take out the external range liquidity resting above the current highs.
2. Case 2 – 15-Min Demand Reaction:
The market could react to the 15-minute demand zone , showing a bullish response and pushing higher toward the 1H supply zone .
3. Case 3 – Inducement & Distribution:
Combined with Case 2, the market may first mitigate the 15-minute demand , then take out the inducement (IdM ) near the 1H supply zone . From there, distribution may begin within that supply range, leading to a drop toward the discount zone .
This would likely involve a fake breakout to the upside (liquidity sweep), trapping buyers and hitting the stop-losses of early sellers before reversing sharply.
4. Case 4 – 1H CHoCH and Triangle Breakdown:
A Change of Character (CHoCH) may occur on the 1H timeframe directly from the current price, leading to a downside move. This scenario would also break the rising triangle pattern , triggering entries from price action traders and increasing market volatility as liquidity accelerates the move downward.
5. Case 5 – 1H Supply Rejection & Free Fall:
The market may react from the 1H supply zone and reject aggressively, resulting in a free fall all the way down to the previous CHoCH level , confirming strong bearish intent from premium to discount.
Thanks for your time..

EURUSD:SIGNALHello friends
Due to the recent price growth, the price has now corrected in a support range.
Now, if the price continues to fall within the specified support ranges, we can make purchases with capital management and move to the specified targets.
*Trade safely with us*

EURUSD Short Term Buy Idea Update!!!Hi Traders, on April 15th I shared this idea "EURUSD Short Term Buy Idea"
Expected retraces and further continuation higher until the strong support zone holds. You can read the full post using the link above.
Price is moving as per the plan!!!
Retraces happening as expected, my bullish view still remains the same here.
If you enjoy this idea, don’t forget to LIKE 👍, FOLLOW ✅, SHARE 🙌, and COMMENT ✍! Drop your thoughts and charts below to keep the discussion going. Your support helps keep this content free and reach more people! 🚀
--------------------------------------------------------------------------------------------------------------------
Disclosure: I am part of Trade Nation's Influencer program and receive a monthly fee for using their TradingView charts in my analysis.

Euro Stablecoin BOOMS: Bye, USD?The Euro Stablecoin Ascends: EURC Hits Record High as Traders Eye Dollar Alternatives Amid Global Uncertainty
For years, the digital asset landscape has been dominated by the US dollar, not just in trading volume but fundamentally through the ubiquity of USD-pegged stablecoins. Tokens like Tether (USDT) and Circle's own USD Coin (USDC) have become the bedrock of the crypto economy, acting as crucial bridges between volatile cryptocurrencies and traditional fiat, facilitating trading, lending, and yield generation within decentralized finance (DeFi). However, the winds of change may be subtly shifting. Amidst a backdrop of persistent global trade tensions, geopolitical maneuvering, and questions surrounding the long-term trajectory of the US dollar, alternative fiat-backed stablecoins are gaining traction. Leading this nascent charge is the Euro Coin (EURC), Circle's Euro-backed offering, which recently surged to a record market capitalization exceeding $246 million.
This milestone, while still dwarfed by its multi-billion dollar USD counterparts, is significant. It signals a growing appetite among traders, investors, and institutions for stable digital assets pegged to currencies other than the greenback. The rise of EURC isn't happening in a vacuum; it reflects a confluence of factors challenging the dollar's undisputed reign in the digital sphere and highlighting the strategic appeal of diversification.
Understanding the Stablecoin Status Quo and the Dollar's Dominance
Stablecoins are indispensable cogs in the crypto machine. They offer price stability relative to a specific asset (usually a major fiat currency), allowing market participants to park funds, calculate profits, pay for services, and interact with DeFi protocols without the wild price swings characteristic of Bitcoin or Ethereum. USDT and USDC have achieved massive network effects, integrated across countless exchanges, wallets, and DeFi applications, making them the default choice for liquidity and settlement.
Their success, however, inherently ties a vast swathe of the digital economy to the US dollar's fate and US monetary policy. For international users, particularly those operating primarily within the Eurozone or holding significant Euro-denominated assets or liabilities, relying solely on USD stablecoins introduces foreign exchange (FX) risk and potential conversion inefficiencies.
Enter EURC: A Regulated Euro On-Chain
Launched by Circle, the same regulated fintech firm behind the highly successful USDC, Euro Coin (EURC) aims to replicate the trust and utility of its dollar sibling, but pegged 1:1 to the Euro. Each EURC token is intended to be fully backed by Euros held in dedicated, segregated bank accounts under Circle's custody. This emphasis on transparency and regulatory compliance, mirroring the approach taken with USDC, is crucial for building trust, especially among institutional players wary of less transparent stablecoin issuers.
The recent surge in EURC's supply to over €246 million (equivalent to ~$246 million at the time of the record, assuming near parity for simplicity, though the exact USD value fluctuates) indicates accelerating adoption. This growth isn't just passive accumulation; it suggests active minting driven by real demand.
Why the Shift? Trade Uncertainty and the Allure of Diversification
The primary catalyst cited for this growing interest in non-USD stablecoins is the pervasive sense of uncertainty clouding the global trade environment and the US dollar's outlook. Several factors contribute to this:
1. Geopolitical Tensions & Deglobalization Trends: Ongoing conflicts, shifting alliances, and a move towards regional trading blocs can create volatility and potentially weaken dominant currencies like the dollar as nations explore alternative payment and reserve systems.
2. US Economic Concerns: Debates around US national debt levels, inflation trajectory, and the Federal Reserve's monetary policy decisions can lead some international investors and traders to hedge against potential dollar depreciation.
3. Desire for FX Hedging: Businesses and traders operating significantly within the Eurozone may prefer a Euro-native stablecoin to minimize the costs and risks associated with constantly converting between EUR and USD stablecoins. Holding EURC directly aligns their digital cash position with their operational currency.
4. European Regulatory Clarity (MiCA): The implementation of the Markets in Crypto-Assets (MiCA) regulation in the European Union provides a clearer framework for stablecoin issuers and users within the bloc, potentially boosting confidence in well-regulated Euro stablecoins like EURC.
5. DeFi Diversification: As the DeFi ecosystem matures, users are seeking more diverse collateral types and trading pairs. EURC allows for the creation of Euro-based liquidity pools and lending markets, catering to a specific user base and reducing systemic reliance on USD assets.
Traders aren't necessarily predicting an imminent dollar collapse, but rather strategically positioning themselves to mitigate risk. Holding a portion of their stable digital assets in EURC provides a hedge – if the dollar weakens against the Euro, the value of their EURC holdings, when measured in dollars, would increase, offsetting potential losses on USD-denominated assets.
Use Cases and Potential Beyond Hedging
While hedging FX risk is a significant driver, the utility of EURC extends further:
• Seamless Euro Transactions: Facilitates frictionless payments and settlements within the Eurozone using blockchain technology.
• European DeFi Growth: Enables the development of DeFi applications tailored to the European market, offering Euro-based borrowing, lending, and yield opportunities.
• Remittances: Potentially offers a more efficient channel for cross-border Euro transfers compared to traditional banking rails.
• Trading Pairs: Allows exchanges to offer direct EURC trading pairs against various cryptocurrencies, simplifying the process for Euro-based traders.
Challenges and the Road Ahead
Despite its record supply, EURC faces hurdles. Its market capitalization and liquidity remain a fraction of USDT's and USDC's. This lower liquidity can mean higher slippage on large trades and limits its immediate utility as deep collateral in major DeFi protocols, which thrive on multi-billion dollar liquidity pools. Building the network effect – getting listed on more exchanges, integrated into more wallets, and accepted by more DeFi platforms – takes time and concerted effort.
Furthermore, EURC's success is intrinsically linked to the stability and economic health of the Eurozone itself. It diversifies away from the dollar, but not away from fiat risk entirely. The regulatory landscape, while clarifying under MiCA, will continue to evolve and shape the operational environment.
Conclusion: A Sign of a Maturing Market
The surge in Circle's EURC supply to over $246 million is more than just a numerical milestone; it's a tangible indicator of a maturing stablecoin market seeking diversification beyond the US dollar. Driven by global trade uncertainties, geopolitical shifts, and a desire among European users and savvy traders to hedge FX risk, Euro-based stablecoins are carving out a growing niche. While the dollar-pegged giants still dominate, the ascent of well-regulated alternatives like EURC signifies a crucial step towards a potentially multi-polar stablecoin future. It underscores the demand for trusted, compliant digital representations of major world currencies, offering users greater choice and resilience in an increasingly complex global financial landscape. The journey for EURC and its Euro counterparts is still in its early stages, but the trend towards diversification is clear, promising a more varied and potentially more stable digital asset ecosystem ahead.

EURUSD Short Term Buy IdeaH4 - Strong bullish momentum
Higher highs on the moving averages of the MACD
No opposite signs
Expecting retraces and further continuation higher until the strong support zone holds.
If you enjoy this idea, don’t forget to LIKE 👍, FOLLOW ✅, SHARE 🙌, and COMMENT ✍! Drop your thoughts and charts below to keep the discussion going. Your support helps keep this content free and reach more people! 🚀
--------------------------------------------------------------------------------------------------------------------
Disclosure: I am part of Trade Nation's Influencer program and receive a monthly fee for using their TradingView charts in my analysis.


EURUSD Setup: Buy First, Sell Later – Don’t Miss the Move!EURUSD has been trending upward for a while now, just as we discussed in the last post. We're reaching higher levels, and while it does look like we could be approaching a potential sell zone, I’m staying patient.
I believe there are still some highs above us that need to be taken out first. What we’re seeing right now could be manipulation—an attempt to trap early sellers. That’s why I won’t be selling yet.
Instead, I’m watching for buy setups today and tomorrow off key levels on my chart. Once those highs are swept and we get confirmation, that’s when I’ll start looking for potential sells.
Give this a boost if you found it useful!

EUR/AUD 4H Trade Setup: Demand Zone Bounce to 1.87500🔵 Key Zones and Levels
🟦 Demand Zone: Strong support area where price has bounced multiple times.
✅ Confluence with the trendline gives extra strength.
🎯 Entry Point: 1.78990
Perfect spot for a potential buy setup.
🛑 Stop Loss: 1.76962
Below the demand zone to protect against false breakouts.
🚀 Target Point: 1.87500
Profit goal with an impressive +4.85% potential (867.4 pips)!
📊 Price Action
📍Current price: 1.80528 (hovering near EMA and close to entry)
🔁 Price has tested the support zone several times — showing signs of accumulation.
⬆️ Potential bullish breakout from this zone.
🔍 Indicators & Patterns
📏 EMA (7): Price is near it, waiting for a clear move above for momentum.
📈 Trendline: Holding well as dynamic support.
🔶 Channel pattern: Higher highs and higher lows indicate uptrend structure.
📌 Summary
🟢 Buy Setup:
🛒 Entry: 1.78990
🛑 Stop Loss: 1.76962
🎯 Target: 1.87500
⚖️ Risk-Reward: Great R:R setup with strong technical backing!

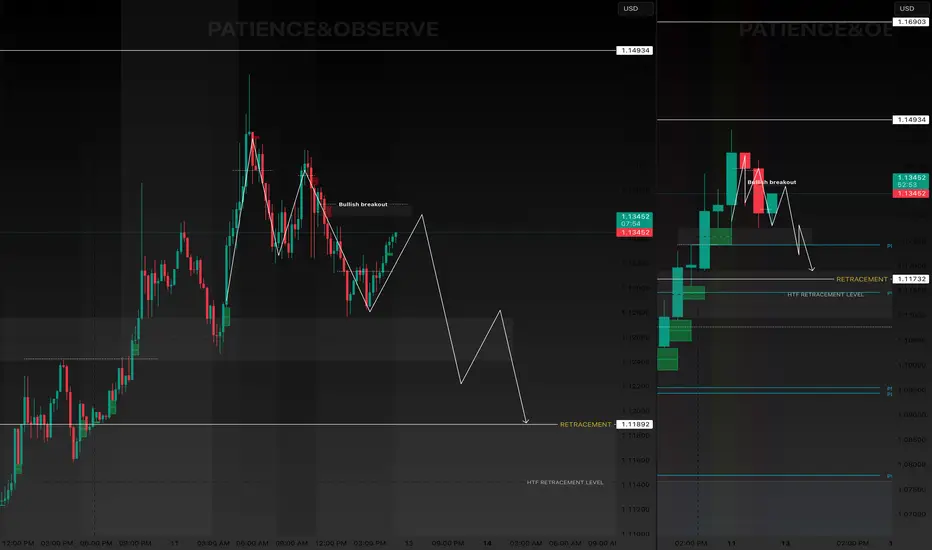
EUR USD IS GOING TO RETRACE BEFORE GOING UP?Chart analysis EURUSD , HTF BULLISH
NEXT WEEK WILL BE A BEARISH , SEEKING INTERNAL LIQUIDITY WHICH IS OUR HIGH PROBABILITY FVG OR AN IMPORTANT LEVEL OF TRACEMENT 1.11892, if
“IF” the price will not break our market structure shift area.
EUR/USD Bullish Breakout & Retest Setup – Targeting 1.10955Instrument: EUR/USD
Timeframe: 30-Minute
Indicators Used:
EMA 30 (Red): 1.09821
EMA 200 (Blue): 1.09698
Key Levels Identified:
Entry Point: 1.09695
Stop Loss: Around 1.09067
Resistance Zone: ~1.09911
Target Zone: ~1.10918 to 1.10955
Projected Gain: ~147.3 pips (1.35%)
Price Action Analysis:
Bullish Breakout:
The price broke out from a consolidation zone (marked in purple).
A bullish trend is forming as price moves above the 200 EMA.
EMAs Alignment:
The 30 EMA is currently above the 200 EMA, indicating a potential bullish trend continuation.
However, price is slightly below the 30 EMA now, suggesting some short-term pullback or resistance.
Retest at Entry Zone:
Price retested the entry zone at 1.09695 after the breakout and is now hovering near it.
This retest is healthy for confirming support before another move up.
Trade Setup Insight:
Entry Strategy: A long (buy) entry at or around 1.09695.
Stop Loss Placement: Below the previous support zone near 1.09067 to manage risk.
Target Strategy: Aiming for the resistance zone around 1.10918–1.10955 for profit booking.
Conclusion:
This looks like a bullish continuation setup with a favorable risk-reward ratio. The confluence of:
EMA support,
Price structure (breakout & retest),
and defined resistance/target zone

EURUSD LIVE TRADE 100 PIP MOVE EUR/USD trades decisively higher on the day above 1.1000 on Wednesday as the US Dollar (USD) stays under persistent selling pressure on growing fears over a recession as a result of the US trade war with China. Later in the American session, the Federal Reserve will release the minutes of the March policy meeting.

EURUSD TO BUY (Wednesday-FOMC Meeting Minutes and Thursday-CPI)As EURUSD as been dropping the past couple of days, it has been on the support levels of 1.0900 lately. On Wednesday and Thursday, there are news about FOMC Meeting Minutes and CPI of the US Dollar. Therefore, we could possibly see price of the EURUSD going up based on news, support pattern of the triangle.
TP: 1.1050-1.110

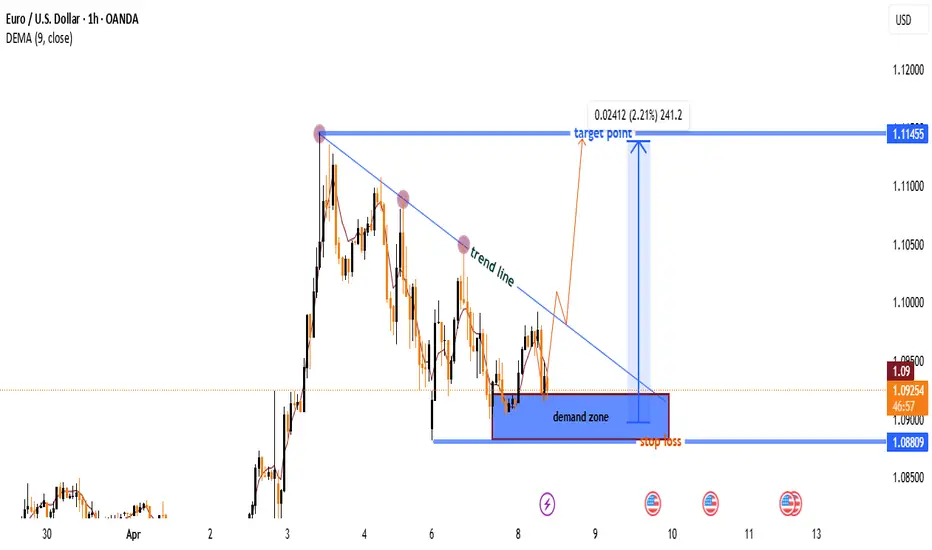
EUR/USD Bullish Reversal Setup from Demand Zone–1HChart AnalysisEUR/USD 1H Chart Analysis
🔵 Trend Line:
* Price was respecting a falling trend line
* Lower highs marked with 🔴 red dots showing bearish pressure
🟦 Demand Zone (Support Area):
* Price is currently hovering around a demand zone
* Marked by a blue box — this is where buyers are stepping in
* Think of this as a "bounce zone"
📍Marked with 🟦 blue dots as key bounce points
🚀 Potential Bullish Breakout: • If price breaks the trend line — get ready for lift-off
* Entry idea: ✅ Buy near the bottom of the blue zone
* Target: 🎯 1.11455
* Profit potential: +241 pips (2.21%)
* Move marked with 🟧 upward arrow path
❌ Stop Loss: • Just below the demand zone at 1.08809
* Marked with a ⚠️ stop sign to avoid large losses
📉 DEMA (9): • Yellow moving average line — shows recent momentum
* Right now, price is slightly below it, but a break above can support bullish case
Summary:
Buy Setup
✅ Entry: Around 1.09000 (🟦 demand zone)
🎯 Target: 1.11455
⚠️ Stop Loss: 1.08809
📈 Risk:Reward — Great!