Euro / U.S. Dollar (EUR/USD) 4-Hour Chart - OANDA4-hour candlestick chart from OANDA displays the EUR/USD exchange rate trend from May 19 to June 26, 2025. The current rate is 1.15324, reflecting a 0.25% decrease (-0.00285) as of the latest update. The chart includes a technical analysis section with a green upward trend and a red downward trend, indicating potential price movements between 1.14264 and 1.15500. Key dates and price levels are marked along the x-axis and y-axis, respectively.
Eurusddaily

$EU (EURUSD) 1H AnalysisBias: Bearish after liquidity grab at 1.14392
Setup: Wait for the sweep ➤ BOS ➤ Enter short
Target: 1.13600
Price is forming a range-bound consolidation, but the internal structure shows liquidity building below and above.
The market seems poised to run the 1.14392 high, grabbing buy stops above the short-term high.
After that sweep,i see a rejection and shift in order flow, setting up a bearish leg.
Key POIs :
Sweep Zone: 1.14392 (Buy-side liquidity)
Sell Target: 1.13600 zone – a clear sell-side liquidity draw
The red line marks an untapped liquidity pool, aligning with a previous support level.
Trade Idea (Short Bias) :
Let price sweep the 1.14392 high, form a bearish shift (change of character).
Ideal entry after confirmation of rejection.
Target: 1.13600
Invalidation: Clean break and close above 1.14500

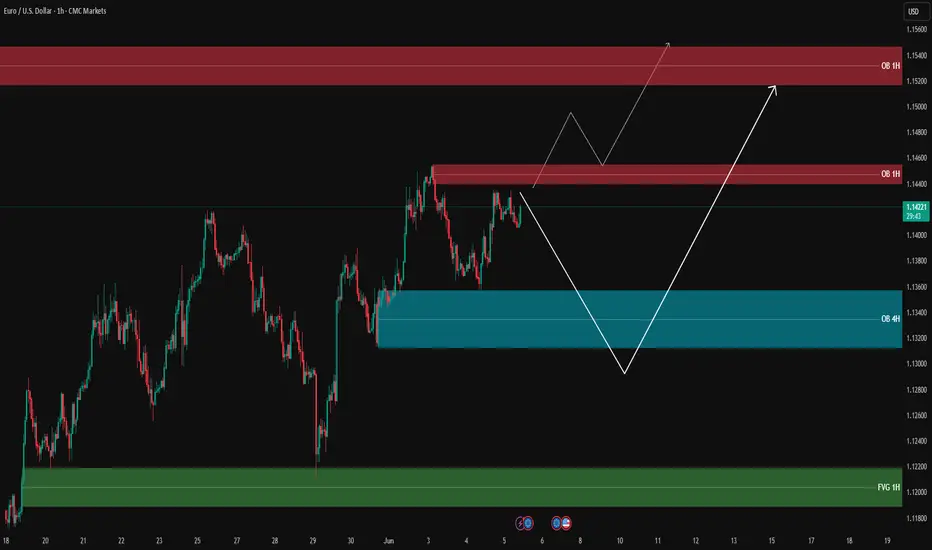
EUR/USD Analysis – Possible Scenarios🔹 Price is currently trading around 1.1421, consolidating between key supply and demand zones.
🔴 Supply Zone (Order Block 1H): 1.14360 – 1.14590
📌 Strong bearish reaction from this resistance area. First scenario: rejection from this OB and a move downward.
🔵 Demand Zone (Order Block 4H): 1.13050 – 1.13430
✅ If price fails to break the resistance, we could see a retracement to this OB. Bullish reaction here may offer long opportunities.
🟢 Fair Value Gap (FVG 1H): 1.11800 – 1.12220
📉 If OB 4H fails to hold, price could drop into this FVG area – a high-liquidity zone for potential reversal.
📊 Possible Scenarios:
1️⃣ Break and hold above OB 1H → price may extend toward next OB zone at 1.15150 – 1.15400
2️⃣ Rejection from OB 1H → pullback to OB 4H → possible long setup if confirmed
3️⃣ Break below OB 4H → deeper move into FVG 1H
‼️ Avoid premature entries – wait for valid confirmations.
🔍 Insight by ProfitaminFX
If this outlook aligns with your bias, or if you see it differently, feel free to share your perspective in the comments. Let’s grow together 📈
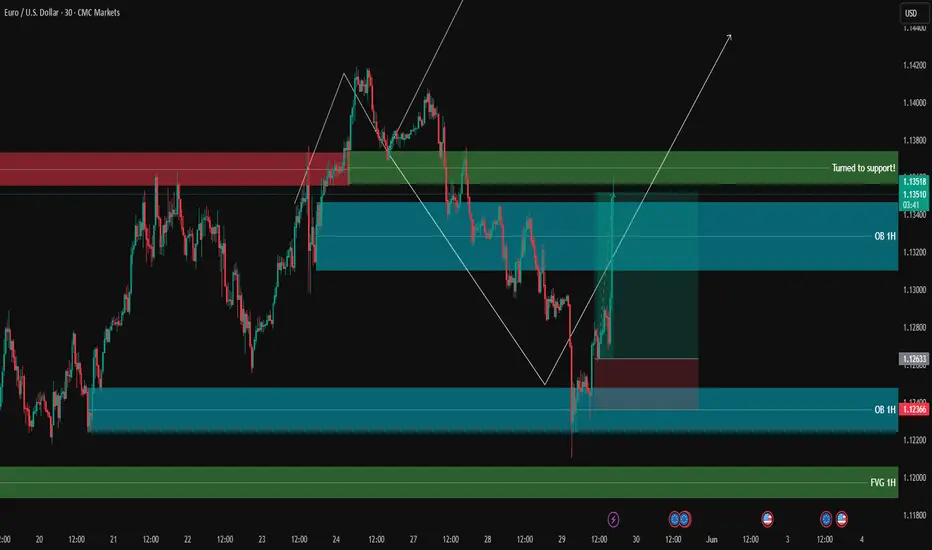
Mr. Wave Says... It’s Time for the Last Push!”[ b] EUR/USD is forming a clean Elliott Wave structure — and guess what?
We’re at Wave 4 consolidation, and Wave 5 is about to explode upward!
🔍 Here's what we're seeing:
✅ Wave 1 to 3 already confirmed with solid impulse
✅ Wave 4 found support near previous breakout zone
🎯 Target: Upper supply zone where Wave 5 is likely to terminate
🔔 This isn’t the time to sleep on the charts. Mr. Wave is literally pointing to the target zone — and we’re not ignoring it. 😉
---
🧠 Pro tip:
Use tight risk management, ride the final push of the motive wave, and watch for reversal signals in the supply zone.
---
📌 #GreenFireForex #ElliottWave #Wave5 #ForexTrading #TechnicalAnalysis #EURUSDSetup #ForexReel #WaveTheory #SupplyZone #ForexSignal #SmartTrading

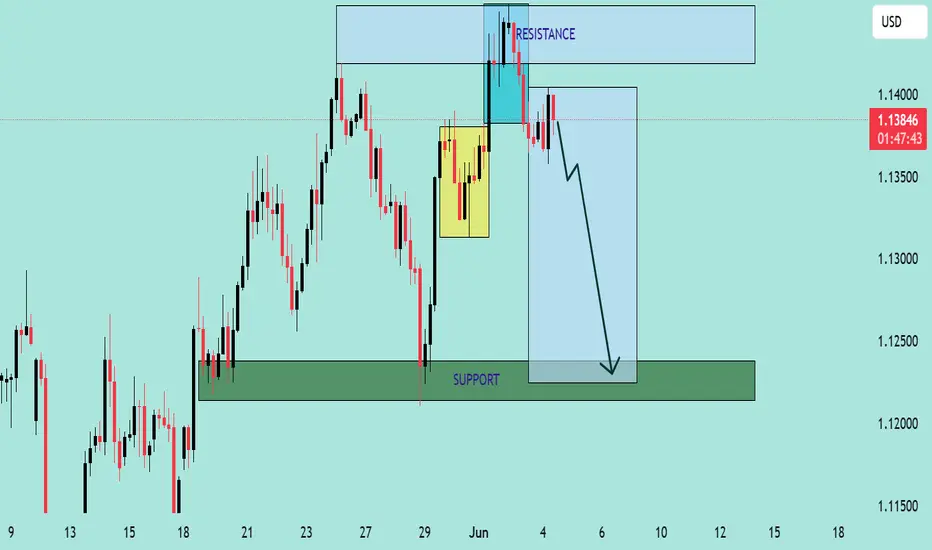
EUR/USD Bearish Reversal Setup Analysis EUR/USD Bearish Reversal Setup Analysis 🧠💼
The chart presents a clear bearish outlook on EUR/USD, with well-defined resistance and support zones, along with a projected short-term price trajectory. Here's a professional breakdown:
🔍 Key Technical Highlights
🔵 Resistance Zone (~1.1400 - 1.1430)
Price recently tested this resistance area and formed multiple wicks, signaling strong seller presence.
A bullish liquidity grab is evident in the highlighted cyan box, suggesting a fake breakout before reversal.
🟡 Supply Zone / Order Block
The yellow box marks a previous consolidation area (potential order block), which was revisited and rejected — reinforcing bearish intent.
🔽 Current Price Action
Price is trading around 1.1378, having broken structure and failed to maintain momentum above the resistance.
Sharp rejections and bearish engulfing candles imply strong selling pressure.
🟢 Support Zone (~1.1230 - 1.1260)
This is a previous demand area where price rallied strongly.
The large blue projection box and arrow suggest a bearish continuation targeting this support region.
📉 Bias: Bearish
Structure: Lower highs forming after liquidity grab.
Price Action: Bearish engulfing after resistance rejection.
Market Sentiment: Sellers appear in control after failing bullish breakout attempt.
🎯 Trade Idea
Entry: After confirmed rejection from resistance (~1.1370–1.1385)
TP: Around 1.1240 (support zone)
SL: Above recent highs (~1.1420)
Risk/Reward: Favorable R:R as the setup targets a large swing down.
EURUSD Update – Exceptional Long Entry As mentioned in our previous post, we were waiting for price to react from one of the key demand zones:
🔹 1.12250 – 1.12500
🔹 1.1190 – 1.12060
✅ We entered a long position on the 3-minute timeframe after getting a personal confirmation trigger.
The result? An exceptional entry with a minimum of 100 pips profit so far.
📍 Now it's time to secure profits and wait for the next structure to form.
We’ve been patiently waiting all week for price to hit this area – and it played out perfectly.
Great execution! ✅
Keep in touch!
EUR/USD May Face Minor Pullback Amid USD Strength📊 Market Overview:
EUR/USD is trading around 1.1330, slightly retreating after reaching near 1.1390 earlier this week. The US dollar is strengthening due to robust consumer confidence data and expectations that the Federal Reserve will maintain higher interest rates for an extended period. Meanwhile, the euro faces pressure as investors await upcoming Eurozone inflation data.
📉 Technical Analysis:
• Key Resistance: 1.1390
• Nearest Support: 1.1255
• EMA: Price remains above the 9-day EMA, indicating the uptrend is still intact.
• RSI: Near 60, suggesting mild overbought conditions.
• MACD: Forming a bearish crossover, signaling potential short-term correction.
📌 Outlook:
EUR/USD may continue to pull back in the short term if it fails to break above the 1.1390 resistance and the US dollar maintains its strength.
💡 Suggested Trading Strategy:
Sell EUR/USD at: 1.1380 – 1.1390
🎯 Take Profit: 1.1255
❌ Stop Loss: 1.1420
Buy EUR/USD at: 1.1255
🎯 Take Profit: 1.1350
❌ Stop Loss: 1.1215

EUR/CAD Bearish Flag Breakdown Toward Fibonacci SuppAnalysis
1. **Trend Breakdown:**
* The chart shows a clear **bearish structure** developing after a strong rally to the 1.58800 area (Fibonacci 1.618 extension level).
* Two upward trendlines were broken successively, confirming bearish momentum.
2. **Fibonacci Levels:**
* The retracement from 1.58800 down to the 0.382 level (1.54586) has held significant importance.
* Price action is respecting the **Fibonacci retracement zones**, with rejection near the 0.786 and 1.0 levels (1.56915 - 1.57109).
3. **Bearish Flag Pattern:**
* A small **bearish flag/pennant** formed after a strong drop, which has now broken downward.
* This confirms the **continuation of the bearish move**.
4. **Volume Confirmation:**
* Volume spikes during the initial sell-off and again on recent bearish candles suggest **strong selling interest**.
5. **Trade Setup (Marked on Chart):**
* **Entry:** Near 1.56443
* **Stop-Loss:** Around 1.57109 (just above recent highs)
* **Target:** Around 1.54848–1.54500 zone, aligning with prior demand and 0.382 Fib level
---
**Conclusion:**
The chart signals a high-probability **short setup**, backed by a break of structure, Fibonacci confluence, bearish flag breakdown, and volume. A continued decline toward the 1.54500–1.54800 region is likely, provided the price stays below 1.57100.

EURUSD time for correctionMonthly
On the monthly timeframe, we came to the Premium zone and captured Monthly Fractal High, where previously there was predominance from the sell side.
Weekly
Price has formed a Weekly FVG, indicating strong dominance from the buy side. However, it is important to understand WHERE this has led us ? The current quotes are interesting for sellers. Hence, we should assume that the price may receive a counter offer from the sell side. It is logical to assume potential points A and B in this context.
Daily
Price has formed primary signs of change in the price delivery state:
- Bullish PD Array disrespecting
- BISI forming
- CISD forming
All this indicates a shift of initiative to the selling side, so it is logical to expect a continuation of the downward movement after interaction with the marked PD Array.
Also, I would like to draw your attention to the fact that the price is within the Inside Bar for the 3rd day already. This means that recently the price has been held within the same values, which indicates a balance of power between buyers and sellers at the current quotes. In such a situation, all we have to do is to find the optimal area to continue the downward price formation.

EURNZD Bullish Reversal from Demand Zone (1H Chart)✅ 1. Market Context & Structure Analysis
The pair (EUR/NZD) was in a short-term downtrend before forming a higher low, indicating a potential bullish reversal.
A W-shaped structure is visible, suggesting a double bottom around the 1.8960–1.8970 zone.
The price has bounced multiple times from the demand zone (green box), confirming strong buying interest.
The recent price action shows the market respecting structure with a clean impulse–correction–impulse pattern, creating a potential continuation leg.
📍 2. Entry Criteria
Entry Price Range: 1.8960 – 1.8970
Why?
This area coincides with a tested support zone, from where price previously rallied.
The current pullback to this area presents a low-risk buying opportunity.
Candlestick confirmation (e.g., bullish engulfing or pin bar) would further validate the entry.
🔐 3. Stop Loss (Risk Management)
Stop Loss Placement: Below 1.8930
Reasoning:
Keeps SL below the structure low and the demand zone.
If price breaks this level, it invalidates the bullish setup and prevents deeper losses.
🎯 4. Take Profit Levels (Targets)
TP1 -1.9050 Minor resistance / partial booking
TP2 -1.9100 First key resistance zone
TP3 -1.9140 Swing high and strong supply area (red zone)
Risk-to-Reward (R:R): ~1:2.5 to 1:3+
You can trail your stop as price moves toward these levels.
📊 5. Technical Confluences
✅ Support Zone: Price bounced multiple times from 1.8960
✅ Bullish Market Structure: Higher highs and higher lows are forming
✅ Chart Pattern: Double bottom / W-pattern breakout potential
✅ Fibonacci (optional): The zone may also align with a 61.8% retracement (not shown but often observed)
⚙️ 6. Trade Management Strategy
🔄 Partial Exit: Book 50% profits at TP1
⏫ Trail SL: Move SL to entry after TP1 hit to make trade risk-free
🔚 Full Exit: At TP3 or if strong bearish reversal candle forms near resistance
⚠️ 7. Risk Disclaimer & Notes
Avoid overleveraging. Only risk 1–2% of your capital.
Reconfirm the trade setup during the London or early NY session for better volatility.
News events (like RBNZ or ECB speeches) could increase volatility — always check the economic calendar before entry.
========================================================
Disclosure: I am part of Trade Nation's Influencer program and receive a monthly fee for using their TradingView charts in my analysis.

EURUSD LIVE TRADEHello friends
Given the formation of an ascending channel and the price rebounding from the bottom of the channel, we can trade with risk and capital management.
*Trade safely with us*

EURUSD BEARISH PRESSURE .?Technical Analysis:
Current Price Movement: The EUR/USD pair has recently dipped below the 1.1200 level, indicating a bearish trend.
Resistance and Support Levels: The resistance at 1.14600 remains a significant barrier, while the pair is approaching the support target of 1.09500.
Fundamental Factors:
US Dollar Strength: The US dollar has gained strength due to positive trade developments and robust employment data.
Eurozone Economic Outlook: The Euro faces challenges amid expectations of further rate cuts by the European Central Bank, contributing to its weakness against the dollar.
Conclusion:
Given the current technical indicators and fundamental factors, the EUR/USD pair is under bearish pressure. Traders should monitor key levels, with a focus on the support at 1.09500 and resistance at 1.14600, to inform their trading strategies

EURUSD SELL (DOWNTREND) H4 SHORT LOOKEUR/USD Market Analysis
Trend: Bearish
Pattern: Strong downward momentum observed after recent highs around 1.1570
Sell Entry Zone: Confirmed with bearish momentum
Target Levels:
1st Target: 1.11000 – Key psychological and technical level
2nd Target: 1.09100 – Near the 55-day SMA, strong historical support
Final Target: 1.07500 – Close to 200-day SMA and March lows
Stop Loss: 1.15500 – Just below the recent high (1.1570), to limit upside risk.

EURUSD LONG FORECAST Q2 W18 D1 Y25EURUSD LONG FORECAST Q2 W18 D1 Y25
Professional Risk Managers👋
Welcome back to another FRGNT chart update📈
Diving into some Forex setups using predominantly higher time frame order blocks alongside confirmation breaks of structure.
Let’s see what price action is telling us today!
💡Here are some trade confluences📝
✅Weekly order block rejection
✅4 hour bullish order block
✅Intraday 15' order blocks
✅Tokyo ranges to be filled
🔑 Remember, to participate in trading comes always with a degree of risk, therefore as professional risk managers it remains vital that we stick to our risk management plan as well as our trading strategies.
📈The rest, we leave to the balance of probabilities.
💡Fail to plan. Plan to fail.
🏆It has always been that simple.
❤️Good luck with your trading journey, I shall see you at the very top.
🎯Trade consistent, FRGNT X

Euro Under Mild Pressure Amid Policy Uncertainty and Weaker USD📌 EUR/USD Outlook: Euro Under Mild Pressure Amid Policy Uncertainty and Weaker US Dollar 📉
🌍 Fundamental Overview
EUR/USD is trading cautiously around 1.1400, as market sentiment remains sensitive to developments in the US-China trade situation and broader monetary policy expectations.
Despite recent USD weakness — where the greenback lost ground against all G10 currencies this April — the Euro is facing renewed selling pressure amid rising speculation about further ECB rate cuts.
ECB policymakers, including Olli Rehn and François Villeroy de Galhau, highlighted the increasing risks of missing the 2% inflation target, reinforcing the need for more monetary easing if necessary.
Meanwhile, mixed signals between Trump and Beijing over trade negotiations have kept uncertainty high, putting both USD and risk sentiment in flux.
📈 Key Economic Events to Watch
US Data:
JOLTS Job Openings
Q1 GDP Preliminary
ISM Manufacturing PMI
ADP Employment Change
Nonfarm Payrolls (NFP)
Core PCE Price Index (March)
Eurozone Data:
Q1 GDP Preliminary
April HICP Inflation
Recent weaker-than-expected Spanish GDP (0.6% vs. forecast 0.7%) also adds pressure on the broader Eurozone outlook.
📊 Technical Outlook – EUR/USD
Immediate Resistance: 1.1450 – 1.1475
Immediate Support: 1.1375 – 1.1340
The pair is now hovering near the 1.1400 psychological level, with slight bearish momentum:
A break below 1.1375 could open the path towards 1.1340.
On the upside, holding above 1.1400 and reclaiming 1.1450 would be needed to revive bullish momentum.
The Dollar Index (DXY) remains trapped around 99.20, hinting at limited immediate USD strength but vulnerable to macro catalysts.
🧠 Trading Strategy
Prefer short-term sell setups if EUR/USD fails to hold 1.1400 and breaks below 1.1375.
Bullish setups are only valid if Price closes firmly above 1.1450, aiming towards 1.1475 resistance.
⚡ Traders should stay cautious ahead of major data this week, especially US NFP and Core PCE, which could redefine short-term Dollar strength.
💬 Are you watching for a deeper pullback or waiting for a bounce above 1.1450? Let’s discuss! 👇👇👇

EUR/USD Bullish Breakout Trade Setup – Targeting 1.18089Entry Point: 1.13860
Stop Loss Zone: 1.13642 to 1.12578
Resistance Point: 1.14320
Target (TP) Point: 1.18089
🔍 Observations
Support Zone: Marked in purple near the entry and stop-loss area, suggesting a strong demand zone.
Resistance Zone: Around 1.14320, indicating a potential breakout level.
Trend: Short-term uptrend after a consolidation range.
Risk/Reward Ratio: Quite favorable, targeting a move of approximately 470+ pips (4.20% gain) from entry to target.
📊 Technical Indicators
Moving Averages:
Red (likely 20 EMA): Price recently crossed above, showing bullish momentum.
Blue (likely 50 or 200 EMA): Serving as dynamic support.
Price Action: Formation suggests a potential breakout from resistance toward the 1.18 target.
🧠 Conclusion
This is a long (buy) setup expecting a bullish breakout:
Buy entry above the support zone.
Stop-loss placed below major support (1.12578).
Target set significantly higher, aligning with prior structure or resistance at 1.18089

Eur/Usd Apr/23 Elliott wave AnalysisHello eveyone...
IMO 5th wave compelted...so i'm looking for Corrective Waves

EURUSD:SIGNALHello friends
Due to the recent price growth, the price has now corrected in a support range.
Now, if the price continues to fall within the specified support ranges, we can make purchases with capital management and move to the specified targets.
*Trade safely with us*

Euro Stablecoin BOOMS: Bye, USD?The Euro Stablecoin Ascends: EURC Hits Record High as Traders Eye Dollar Alternatives Amid Global Uncertainty
For years, the digital asset landscape has been dominated by the US dollar, not just in trading volume but fundamentally through the ubiquity of USD-pegged stablecoins. Tokens like Tether (USDT) and Circle's own USD Coin (USDC) have become the bedrock of the crypto economy, acting as crucial bridges between volatile cryptocurrencies and traditional fiat, facilitating trading, lending, and yield generation within decentralized finance (DeFi). However, the winds of change may be subtly shifting. Amidst a backdrop of persistent global trade tensions, geopolitical maneuvering, and questions surrounding the long-term trajectory of the US dollar, alternative fiat-backed stablecoins are gaining traction. Leading this nascent charge is the Euro Coin (EURC), Circle's Euro-backed offering, which recently surged to a record market capitalization exceeding $246 million.
This milestone, while still dwarfed by its multi-billion dollar USD counterparts, is significant. It signals a growing appetite among traders, investors, and institutions for stable digital assets pegged to currencies other than the greenback. The rise of EURC isn't happening in a vacuum; it reflects a confluence of factors challenging the dollar's undisputed reign in the digital sphere and highlighting the strategic appeal of diversification.
Understanding the Stablecoin Status Quo and the Dollar's Dominance
Stablecoins are indispensable cogs in the crypto machine. They offer price stability relative to a specific asset (usually a major fiat currency), allowing market participants to park funds, calculate profits, pay for services, and interact with DeFi protocols without the wild price swings characteristic of Bitcoin or Ethereum. USDT and USDC have achieved massive network effects, integrated across countless exchanges, wallets, and DeFi applications, making them the default choice for liquidity and settlement.
Their success, however, inherently ties a vast swathe of the digital economy to the US dollar's fate and US monetary policy. For international users, particularly those operating primarily within the Eurozone or holding significant Euro-denominated assets or liabilities, relying solely on USD stablecoins introduces foreign exchange (FX) risk and potential conversion inefficiencies.
Enter EURC: A Regulated Euro On-Chain
Launched by Circle, the same regulated fintech firm behind the highly successful USDC, Euro Coin (EURC) aims to replicate the trust and utility of its dollar sibling, but pegged 1:1 to the Euro. Each EURC token is intended to be fully backed by Euros held in dedicated, segregated bank accounts under Circle's custody. This emphasis on transparency and regulatory compliance, mirroring the approach taken with USDC, is crucial for building trust, especially among institutional players wary of less transparent stablecoin issuers.
The recent surge in EURC's supply to over €246 million (equivalent to ~$246 million at the time of the record, assuming near parity for simplicity, though the exact USD value fluctuates) indicates accelerating adoption. This growth isn't just passive accumulation; it suggests active minting driven by real demand.
Why the Shift? Trade Uncertainty and the Allure of Diversification
The primary catalyst cited for this growing interest in non-USD stablecoins is the pervasive sense of uncertainty clouding the global trade environment and the US dollar's outlook. Several factors contribute to this:
1. Geopolitical Tensions & Deglobalization Trends: Ongoing conflicts, shifting alliances, and a move towards regional trading blocs can create volatility and potentially weaken dominant currencies like the dollar as nations explore alternative payment and reserve systems.
2. US Economic Concerns: Debates around US national debt levels, inflation trajectory, and the Federal Reserve's monetary policy decisions can lead some international investors and traders to hedge against potential dollar depreciation.
3. Desire for FX Hedging: Businesses and traders operating significantly within the Eurozone may prefer a Euro-native stablecoin to minimize the costs and risks associated with constantly converting between EUR and USD stablecoins. Holding EURC directly aligns their digital cash position with their operational currency.
4. European Regulatory Clarity (MiCA): The implementation of the Markets in Crypto-Assets (MiCA) regulation in the European Union provides a clearer framework for stablecoin issuers and users within the bloc, potentially boosting confidence in well-regulated Euro stablecoins like EURC.
5. DeFi Diversification: As the DeFi ecosystem matures, users are seeking more diverse collateral types and trading pairs. EURC allows for the creation of Euro-based liquidity pools and lending markets, catering to a specific user base and reducing systemic reliance on USD assets.
Traders aren't necessarily predicting an imminent dollar collapse, but rather strategically positioning themselves to mitigate risk. Holding a portion of their stable digital assets in EURC provides a hedge – if the dollar weakens against the Euro, the value of their EURC holdings, when measured in dollars, would increase, offsetting potential losses on USD-denominated assets.
Use Cases and Potential Beyond Hedging
While hedging FX risk is a significant driver, the utility of EURC extends further:
• Seamless Euro Transactions: Facilitates frictionless payments and settlements within the Eurozone using blockchain technology.
• European DeFi Growth: Enables the development of DeFi applications tailored to the European market, offering Euro-based borrowing, lending, and yield opportunities.
• Remittances: Potentially offers a more efficient channel for cross-border Euro transfers compared to traditional banking rails.
• Trading Pairs: Allows exchanges to offer direct EURC trading pairs against various cryptocurrencies, simplifying the process for Euro-based traders.
Challenges and the Road Ahead
Despite its record supply, EURC faces hurdles. Its market capitalization and liquidity remain a fraction of USDT's and USDC's. This lower liquidity can mean higher slippage on large trades and limits its immediate utility as deep collateral in major DeFi protocols, which thrive on multi-billion dollar liquidity pools. Building the network effect – getting listed on more exchanges, integrated into more wallets, and accepted by more DeFi platforms – takes time and concerted effort.
Furthermore, EURC's success is intrinsically linked to the stability and economic health of the Eurozone itself. It diversifies away from the dollar, but not away from fiat risk entirely. The regulatory landscape, while clarifying under MiCA, will continue to evolve and shape the operational environment.
Conclusion: A Sign of a Maturing Market
The surge in Circle's EURC supply to over $246 million is more than just a numerical milestone; it's a tangible indicator of a maturing stablecoin market seeking diversification beyond the US dollar. Driven by global trade uncertainties, geopolitical shifts, and a desire among European users and savvy traders to hedge FX risk, Euro-based stablecoins are carving out a growing niche. While the dollar-pegged giants still dominate, the ascent of well-regulated alternatives like EURC signifies a crucial step towards a potentially multi-polar stablecoin future. It underscores the demand for trusted, compliant digital representations of major world currencies, offering users greater choice and resilience in an increasingly complex global financial landscape. The journey for EURC and its Euro counterparts is still in its early stages, but the trend towards diversification is clear, promising a more varied and potentially more stable digital asset ecosystem ahead.

EURUSD LIVE TRADE AND EDUCATIONAL BREAKDOWN EUR/USD remains offered and below 1.1300
EUR/USD is feeling the squeeze, revisiting the area below its key 1.1300 support as the US Dollar gains extra momentum on Tuesday. Mixed domestic data hasn't done the Euro any favours either.

EURUSD signalsI’ll be sharing valuable information over the next 30 days. After that, I’m going private. Anyone interested is more than welcome to follow—this is a space where stop losses don’t exist.

EURUSD SHORT FORECAST Q2 W16 D14 Y25EURUSD SHORT FORECAST Q2 W16 D14 Y25
- Weekly Order Block rejection
Setup 1
-15' break of structure
- Tokyo low range remains
- Pull back into 15' order block
- Lower time frame shift in price action from bullish to bearish
Setup 2
- Lower time frame break of structure
- Lower time frame bearish candle formation
Let's see how EURUSD short set up plays.
Certainly short potential but as always. We await price action to present itself to us.
It is far too easy to find a position once we have noticed potential. Sit back and await the play!
EURUSD SHORT FORECAST Q2 W16 D14 Y25
FRGNT X

EURUSD Daily Analysis 📊 EURUSD Daily Chart – 12/04/2025
Price has shown strong bullish momentum after a clear market structure shift (MSS) and a clean break above the previous daily low (PDL). The recent breakout from the order block (OB) confirms bullish intent, supported by the price filling and respecting the Fair Value Gaps (FVG).
🔍 Key Highlights:
Bullish MSS confirms a shift in structure.
Price filled the FVG below and used it as support.
Potential retracement into the new FVG (around 1.11500–1.12500) before targeting the monthly high at 1.14738.
📈 Bias: Bullish
📌 Target: Monthly high above 1.14700
📉 Watch for: Price reaction at FVG zone before continuation.
