EURUSD: Rise then dropEURUSD could do a straight away but I'd like to see some sort pullback before heading bearish.
Eurusddaily

EURUSD LONG 100 PIP MOVE LIVE TRADE AND EDUCATIONAL BREAK DOWNEUR/USD trades decisively higher on the day above 1.1000 on Wednesday as the US Dollar (USD) stays under persistent selling pressure on growing fears over a recession as a result of the US trade war with China. Later in the American session, the Federal Reserve will release the minutes of the March policy meeting.

EURUSD SHORT FORECAST Q2 W15 Y25 TUESDAY 8TH APRIL 2025EURUSD SHORT FORECAST Q2 W15 Y25 TUESDAY 8TH APRIL 2025
Welcome back if you're returning, Welcome if you're new here!
Let's take a long into a much unchanged EUERUSD short analysis. The weekly time frame in particular is setting the short scene here. The weekly order block created in September 2024 is providing the valid short point of interest and we have witnessed rejection from that area.
It is also worth mentioning risk management. It does not really feel like a change in dynamic, the majority of us have seen similar price action movements during financial global shifts. My only take away is RISK MANAGEMENT during those/ these periods. One thing I have noticed being a trader is I can always find a position, the question is, BUT... "what position are you going to execute"
This was the difference between FRGNT now and FRGNT then.
Take EURUSD, we have alerts set just below our points of interest. Once that alert sounds, we are aware that our high probability set up is to be looked at closer.
EURUSD short forecast in that case remains 100% unchanged at this time and I shall link the EURUSD short forecast from week 15 beginning.
You may feel that there is no need to read but I hope this reenforces that at times there are trading periods in which there simply is no position to execute. Our job at professional risk managers is to ensure that when our set up does materialise, we are there ready with out account balance intact to bank the full rewards.
FRGNT X

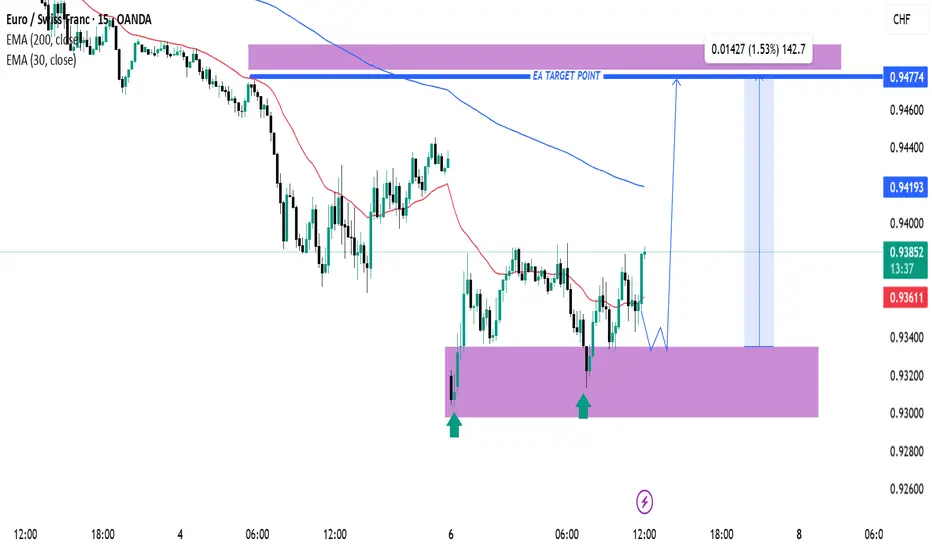
EUR/CHF Bullish Reversal Setup from Key Support Zone – Targeting1. Support Zone (Purple Box at Bottom):
The price has tested this zone multiple times (marked by green arrows), indicating strong demand and a potential double or triple bottom pattern forming.
This support zone ranges roughly between 0.93150 and 0.93350.
2. Projected Bullish Move:
A projected move is drawn from the current price level (around 0.93638) to a target zone near 0.94774, which is marked as the "EA Target Point".
This suggests a potential gain of approximately 1.53% (142.7 pips).
3. Exponential Moving Averages (EMAs):
EMA 30 (red) is currently below the
EURUSD LONGI am looking to buy EURUSD at 1.08300.
I am overall Bullish on the fiber. I am waiting for a deeper retracement.
My target is the previous weekly high.
EURUSD on high time frame
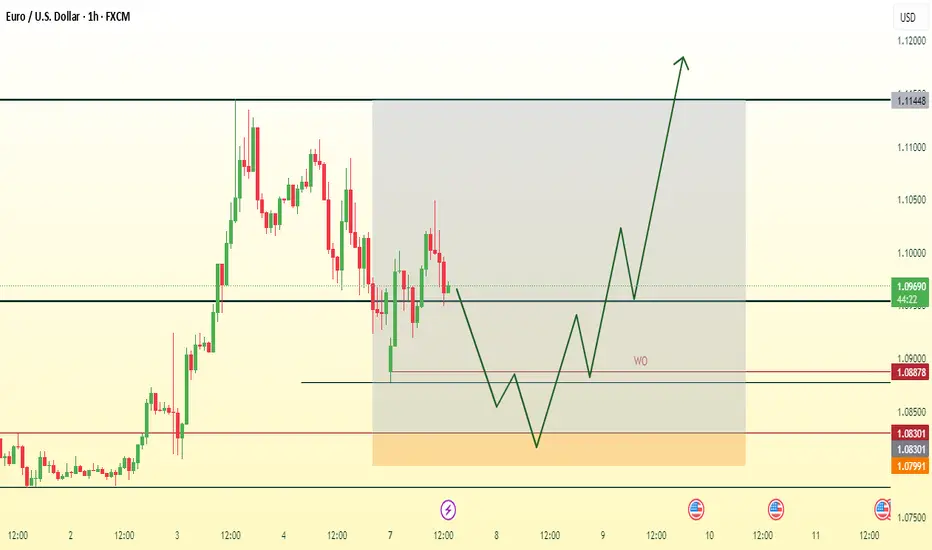
"When considering EUR/USD, the price has decisively broken the structure on the daily time frame. Currently, it is undergoing a pullback towards the origin of the move. In my analysis, once this pullback is complete, it presents a favorable buying opportunity. My target for this trade is 1.120.
Depending on your strategy, you may opt to wait for the completion of the pullback and the formation of a (FVG) candle on the 1-hour chart before taking action."
If you need further assistance or have any specific questions, feel free to ask!

EURUSD - what’s next?Here is our in-depth view and update on EURUSD . Potential opportunities and what to look out for. This is a long-term overview on the pair sharing possible entries and important Key Levels .
Alright first, let’s take a step back and take a look at EURUSD from a bigger perspective.
After making such a huge upside move, we are expecting EURUSD to have some sort of a correction or a pullback to the downside. After that we got a sell off on EURUSD and just today we hit the 50% correction level at around 1.08442 . After failing to break to the upside we can expect more sells to be in play. Any breaks to the downside from the current price will confirm this. Although TVC:DXY is not as strong at the moment, it still is a global reserve currency . We seen that in play last week when we saw massive upside on OANDA:XAUUSD and on TVC:DXY . We must understand that investors are also pouring their money into DXY as it is a global reserve currency. I still personally believe TVC:DXY holds more strength against TVC:EXY hence why I am still looking to short the pair.
Scenario 1: SELLS from current price
With the instant sell, we are risking a possible pullback and continuations to the upside however, DXY is looking like it will reverse. Failing to break to the upside can also be taken as a confirmation for potential sells.
Scenario 2: BUYS at the break of the Key Level (around 1.085)
With the break to the upside, we can expect more buys to come in play possibly targeting previous highs on EURUSD at around 1.09444.
KEY NOTES
- DXY possible reversal to the upside.
- Breaks above the KL and to the upside would confirm higher highs.
- EURUSD has completed the 50% correction to the upside.
- DXY is the global reserve currency.
Happy trading!
FxPocket

EURUSDHello friends
Given the good price growth, we can now buy in the support areas during the pullbacks that the price makes, of course with capital management...
*Trade safely with us*

EUR USD Trade Setup Daily Timeframe EUR USD has tapped on a Daily supply level that also acted as a strong resistance level in the past.
So we will be looking for selling opportunities from the lower timeframe.

Eurusd outlookThis chart represents a technical analysis of EUR/USD on the 1-hour timeframe, highlighting key support and resistance levels.
Key Analysis:
Resistance Level: Marked around 1.09500, this level serves as a potential selling zone where price may struggle to break higher.
Support Level: Identified near 1.08000, this is a demand area where buying pressure may emerge.
Current Price: EUR/USD is trading at approximately 1.09183, near the resistance zone.
Expected Price Movement: The analysis suggests a potential rejection from resistance, leading to a downward move toward the support zone.
Outlook:
The market structure indicates a possible bearish retracement from resistance. If the price fails to break above 1.09500, a short-selling opportunity may arise with a target around 1.08000. However, if the resistance is broken, further upside momentum could be expected.

EUR/USD: Breakdown Amidst Euro Surge on German Fiscal StimulusThe EUR/USD currency pair has recently experienced significant movements influenced by both technical patterns and fundamental developments.
Technical Analysis:
The EUR/USD pair has been trading within a well-defined ascending channel, characterized by higher highs and higher lows. However, recent price action indicates a breach below the channel’s lower boundary, suggesting potential bearish momentum. This breakdown could signal a trend reversal or a corrective phase, with the next support level identified around 1.06339. Traders should monitor this level closely, as a sustained move below it may confirm further downside potential.
Fundamental Analysis:
The euro has surged, marking its most substantial weekly gain against the dollar since 2009. This appreciation is largely attributed to Germany’s announcement of a historic fiscal stimulus package aimed at bolstering the Eurozone’s economic recovery. In contrast, the U.S. dollar has weakened due to escalating trade tensions and concerns over the economic implications of aggressive trade policies under President Trump. Investors are increasingly favoring the euro, reflecting optimism about the Eurozone’s growth prospects compared to the uncertain U.S. economic outlook.

EUR/USD on high time frame It's a good opportunity to buy EUR/USD on high time frame , base on my strategy EUR is in bullish trend ,
EUR USD buy position ,
Tp: 1/090
St : 1/030

EURUSD BULLISHEURUSD may continue to rise towards 1.0700 to 1.0730 till it is stable above 1.0360.
Buy the dips!!!

Eurusd sell zoneThis is a EUR/USD (Euro/US Dollar) 1-hour timeframe technical analysis from FXCM, showing a sell trade setup with the following key details:
1. Entry Point: Around 1.05112, marked in yellow.
2. Stop Loss: Placed at 1.05690 (red zone), indicating the level where the trade will be exited if the price moves against the setup.
3. Target Level: 1.03978, shown in blue, representing the expected price drop and profit target.
4. Market Outlook: The analysis suggests a potential bearish move, with price expected to decline from the entry point, retrace slightly, and then drop further to hit the target.
5. Risk-Reward Ratio: The trade setup has a favorable risk-reward structure, with the potential reward being larger than the risk.
This setup is based on the expectation that EUR/USD will reverse from resistance and move downward, making it a short (sell) trade opportunity.

MY analysis on Gold in 1H chart its again downwords gold xauusd is in downword we can take sell positions for some time as it almost touches the EMA200 and again going downwords .
Key Observations:
Downtrend Channel Breakout:
The price was previously in a descending channel (marked in blue).
A breakout to the upside occurred, signaling a potential reversal or retracement.
200 EMA Resistance (Blue Line at ~2897):
The price approached the 200 EMA, which is a strong dynamic resistance.
The rejection at this level (highlighted by the red arrow) suggests selling pressure.
Bearish Rejection (Yellow Circle & Red Arrow):
A wick at the 200 EMA shows that buyers attempted to push higher but faced resistance.
This could be a sign of a potential trend continuation to the downside.
Potential Downside Target (Blue & Red Zones):
A short-term support zone is marked in blue, where price might retest.
A larger support block (red zone) indicates a deeper pullback if bearish momentum continues.
Volume Increasing:
Volume is rising, which could indicate stronger price action, whether continuation or reversal.
Possible Trading Scenarios:
Bearish Case (Most Likely):
If price continues to reject the 200 EMA, it could drop toward the red support zone (~2,860-2,870).
A break below this level could lead to further downside.
Bullish Case (Less Likely):
If price reclaims the 200 EMA and holds above it, it could target the next resistance zone (~2,920).
Conclusion:
Bias: Bearish below 200 EMA unless price breaks above.
Potential Trade: Watch for a retest of the blue zone for a possible short entry targeting the red support block.
Would you like an entry/exit plan based on this setup?

EURUSD LongNice long opportunity with tight stop loss, I have taken a trade yesterday low on long with nice trail stop of 50 pips profit~ didn’t have the time to share the idea~ but looking for another long setup

EUR/USD at a Crossroads: Will Trade Tensions Push It Lower? EUR/USD has been struggling to maintain momentum above the 1.0500 mark, facing renewed selling pressure as macroeconomic and geopolitical factors influence sentiment. With the US Dollar regaining strength and concerns about European economic stagnation growing, the pair remains vulnerable to further downside.
Technical Analysis:
Resistance Levels: 1.0532 (January 27 high), 1.0629 (December peak), 1.0744 (200-day SMA).
Support Levels: 1.0405 (55-day SMA), 1.0282 (February 10 low), 1.0209 (February 3 low), and 1.0176 (January 13 YTD low).
Indicators: The Relative Strength Index (RSI) is near 55, indicating modest momentum, while the Average Directional Index (ADX) remains around 15, suggesting a weakening trend.
Moving Averages: The 200-day SMA at 1.0744 serves as a key dynamic resistance, while the 55-day SMA at 1.0405 acts as interim support.
Fundamental Analysis:
Several key fundamental factors are exerting downward pressure on EUR/USD:
Trade Policy Uncertainty: While US tariff tensions have temporarily eased, lingering trade disputes, including a 10% duty on Chinese imports and potential EU-targeted tariffs, keep investors cautious.
Diverging Central Bank Policies: The Federal Reserve remains firm on keeping interest rates elevated, while the European Central Bank has begun rate cuts, signaling weaker economic confidence in the Eurozone.
Economic Growth Divergence: The US economy continues to show resilience with robust labor markets and stable inflation, while the Eurozone faces stagnation and potential contraction, particularly in Germany.
European Political Risks: Uncertainty in Germany and wider Eurozone economic struggles add to the Euro’s bearish outlook, making it less attractive compared to the US Dollar.
The EUR/USD pair is at a critical juncture, with key support levels in focus. Trade policies, central bank divergence, and economic growth disparities continue to drive market sentiment. This week is pivotal for the Eurozone, with key economic data releases culminating in Friday’s PMI figures, which could determine the pair’s next major move. Traders should remain cautious and closely monitor both technical and fundamental developments.
Note: Please remember to adjust this trade idea according to your individual trading conditions, including position size, broker-specific price variations, and any relevant external factors. Every trader’s situation is unique, so it’s crucial to tailor your approach to your own risk tolerance and market environment.

Sell Signal📉 EURUSD Sell Signal 📉
🔹 Wait for the best candle formation before entering the sell trade! Risk management is crucial.
🔹 The 1.04980 resistance zone is considered as the entry point.
🔹 Stop-loss is set at 1.05355 to minimize potential risks.
🔹 Target levels:
✅ First target: 1.04658
✅ Second target: 1.04133
⚠️ Always manage your risk! Make sure to get additional confirmations before entering the trade.


EUR/USD on high time frame
"Regarding EUR/USD on high time frames, as per my recent analysis, the price has shifted towards a bullish momentum. I anticipate the price to surpass the mitigated order block on the 4-hour chart and reach the 1/1 price zone on the weekly and daily time frames. However, this analysis would be invalidated if the price closes below 1.02 on the daily time frame."
If you have any specific questions or if you need further assistance with your text, please let me know!

EURUSD Buy📉 EURUSD Signal | 1H Timeframe Analysis
📆 Date: February 7, 2025
🔍 Strategy: Breakout and Risk Management
✅ Suggested Position: Buy after pullback confirmation
🎯 Targets:
First Target: 1.04016
Second Target: 1.04429
Third Target: 1.04938
🛑 Stop Loss: 1.03083
🔄 Entry Level: Confirmed breakout at 1.03372
⚠ Key Points:
Enter if a pullback to 1.03372 is confirmed.
Set stop loss at 1.03083.
Apply proper risk management.
📊 Technical Analysis: The previous downtrend has been corrected, and we are in a demand zone. If the key level breaks, an upward move is expected.
#Forex #TechnicalAnalysis #EURUSD

