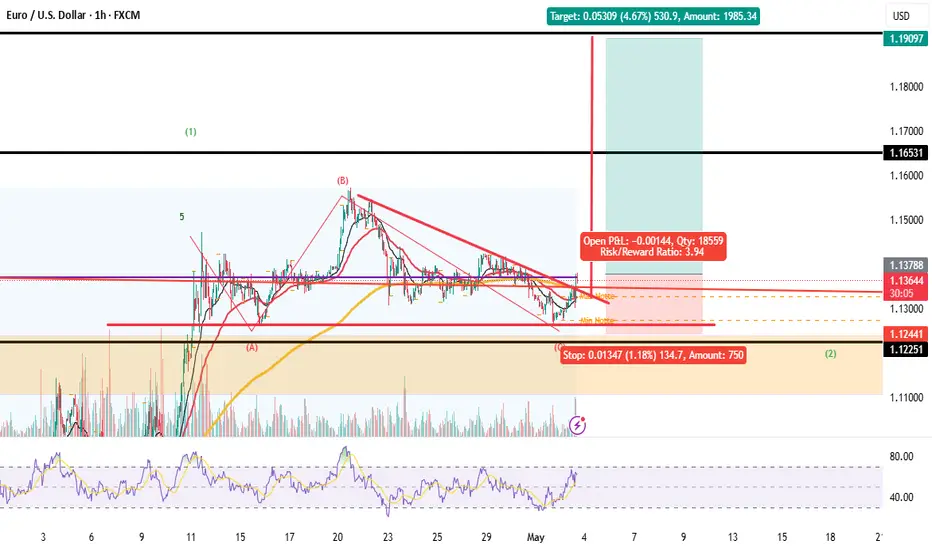
EUR/USD - Channel Breakout (02.05.2025) FX:EURUSD The EUR/USD pair on the M30 timeframe presents a Potential Buying Opportunity due to a recent Formation of a Breakout Pattern. This suggests a shift in momentum towards the upside and a higher likelihood of further advances in the coming hours.
Possible Long Trade:
Entry: Consider Entering A Long Position around Trendline Of The Pattern.
Target Levels:
1st Resistance – 1.1387
2nd Resistance – 1.1430
🎁 Please hit the like button and
🎁 Leave a comment to support for My Post !
Your likes and comments are incredibly motivating and will encourage me to share more analysis with you.
TVC:DXY
Best Regards, KABHI_TA_TRADING
Thank you.
Eurusdlong

EUR/USD Short term longs to a supplyThis week, I’ll be watching to see how much downside momentum remains after price reacted from my 8H supply zone. Just below the current price action, there’s a clean 3H demand zone I’m expecting price to mitigate — which could spark a bullish reaction or a short-term bounce.
My next supply zones are further above on the 2H and 5H timeframes, so I’ll be waiting to see whether we get another break of structure from this move, which could create a new, tradable supply zone. Ideally, I’ll wait for a Wyckoff schematic to develop at one of these key POIs before committing to a trade.
Confluences for EUR/USD Buys (Short-Term):
- Multiple liquidity points to the upside that price may seek to take out.
- A clean, unmitigated 3H demand zone just below the current level.
- The DXY is still showing weakness, aligning with bullish short-term EU moves.
- This could be a counter-trend opportunity before a larger sell-off resumes.
P.S. While my bias leans more towards selling from higher up, I’ll be open to counter-trend longs if the lower POIs hold. Just remember to keep your risk management tight and only take trades with clear confluence and confirmation.

EURUSD - Breakout of Triangle - LongEURUSD - Breakout of Triangle - Long
Long structure if we go above 1.138
We can have a good new long phase, trigger wil be the break of 1.1380 structure with daily candle.
EURUSD - LONG TERM STRATEGYWe have a nice big impulse wave in Long time frame we can note that is a impulsive 3W. So we can have a nice good new long wave in the next months.
This is a strategic analysis for the next move of cross... Is attend an increase o EUR value.

EURUSD Analysis todayHello traders, this is a complete multiple timeframe analysis of this pair. We see could find significant trading opportunities as per analysis upon price action confirmation we may take this trade. Smash the like button if you find value in this analysis and drop a comment if you have any questions or let me know which pair to cover in my next analysis.

EURUSD potential drop support?EURUSD has broken out of the daily support proceeding to daily 20EMA to swing high to retest as support. As with a head and shoulder on 4h price breaks out of support ( Daily ) with multiple liquidity grab it is a high probability for the price to potentially drop to support.
A sell trade is high probable

EURUSD LONG FORECAST Q2 W18 D1 Y25EURUSD LONG FORECAST Q2 W18 D1 Y25
Professional Risk Managers👋
Welcome back to another FRGNT chart update📈
Diving into some Forex setups using predominantly higher time frame order blocks alongside confirmation breaks of structure.
Let’s see what price action is telling us today!
💡Here are some trade confluences📝
✅Weekly order block rejection
✅4 hour bullish order block
✅Intraday 15' order blocks
✅Tokyo ranges to be filled
🔑 Remember, to participate in trading comes always with a degree of risk, therefore as professional risk managers it remains vital that we stick to our risk management plan as well as our trading strategies.
📈The rest, we leave to the balance of probabilities.
💡Fail to plan. Plan to fail.
🏆It has always been that simple.
❤️Good luck with your trading journey, I shall see you at the very top.
🎯Trade consistent, FRGNT X

EURUSD(20250430) Today's AnalysisMarket news:
The European Central Bank expects prices to rise 2.9% over the next 12 months, up from 2.6% in February, according to a monthly survey released on Tuesday. This is the highest level since April 2024. The three-year indicator rose slightly to 2.5%. The ECB's first five-year forecast was 2.1%.
Technical analysis:
Today's buying and selling boundaries:
1.1391
Support and resistance levels:
1.1443
1.1424
1.1411
1.1372
1.1359
1.1340
Trading strategy:
If the price breaks through 1.1391, consider buying, the first target price is 1.1411
If the price breaks through 1.1372, consider selling, the first target price is 1.1359

EURUSD long opportunityMy analysis indicates EU and other xxxUSD pairs could go up with the news release. My bias for today is bullish and have placed a position here.

EUR/USD remains capped below 1.1400, bullish bias prevailsEUR/USD's near-term outlook is neutral. The pair oscillates below a flat 20 SMA, while longer-term (100/200) SMAs maintain upward slopes. Momentum is flat around 100, and the RSI is only slightly higher near 45, suggesting limited upward potential.

EURUSD(20250428) Today's AnalysisMarket news:
The Fed's subsequent policy path considers two scenarios: First, there is no substantial progress in the negotiations between the United States and its trading partners. After 90 days, the US tariffs are still high. Weakened economic demand may prompt the Fed to cut interest rates starting in July, and the annual rate cut may reach 100 basis points; second, the negotiations are fruitful, tariffs are reduced, and the demand shock is small, but inflationary pressure continues. The Fed may postpone easing and only cut interest rates slightly in December. For the market, although the easing comes early in the first scenario, the "recession-style" rate cut may suppress risky assets.
Technical analysis:
Today's buying and selling boundaries:
1.1357
Support and resistance levels:
1.1434
1.1405
1.1386
1.1327
1.1308
1.1280
Trading strategy:
If the price breaks through 1.1357, consider buying, the first target price is 1.1386
If the price breaks through 1.1327, consider selling, the first target price is 1.1308

EURUSD: The range is compressing in the sideway zone. Waiting foThe Relative Strength Index (RSI) indicator on the 4-hour chart stays below 50 and EUR/USD failed to make a 4-hour close above the 20-period and 50-period Simple Moving Averages (SMA), reflecting a lack of buyer interest.
On the downside, 1.1300 (static level) aligns as interim support before 1.1270-1.1260 (Fibonacci 238.2% retracement of the latest uptrend, 100-period SMA) and 1.1180 (Fibonacci 50% retracement).
EUR/USD could face strong resistance at 1.1380, where the Fibonacci 23.6% retracement level converge with the 20-period and 50-period SMAs. In case EUR/USD manages to stabilize above this resistance, 1.1450 (static level) and 1.1500 (static level, round level) could be seen as next hurdles.

EURUSD Analysis todayHello traders, this is a complete multiple timeframe analysis of this pair. We see could find significant trading opportunities as per analysis upon price action confirmation we may take this trade. Smash the like button if you find value in this analysis and drop a comment if you have any questions or let me know which pair to cover in my next analysis.

Targeting 1.185: Strategies for Navigating Euro Volatility!A few thoughts on the results of the analysis of Friday's stock exchange reports on the euro/dollar pair
We noticed a portfolio that has entered the market with a target of 1.185, and only have 12 days until expiration. With the current volatility at 10.23, the future price at expiration is expected to be in the range of 1.0993 to 1.1849 — a 95% probability. Interesting, right?
Now, let’s consider two possible scenarios.
The first option : if the price is rapidly moving towards 1.185, it might be wise to think about selling the asset. Why? Because this price will act as a strong resistance level. Two reasons:
First , the expected price range is based on a mathematical formula and statistical data. Second , using leverage embedded in options that are deep out of the money (i.e., far from the current price) presents an excellent opportunity to create a synthetic short position without any risk, even if the market continues to move upward! Sounds unreal? Start learning about options, and a new world of opportunities will open up for you. Your perspective on risk and opportunities will change dramatically!
OK, now let's get back to the point of the post. The second option : if the price consolidates above 1.1436 on the futures, this could signal a buying opportunity.
Taking into account other factors (you can dig deeper using our website's data), the current sentiment is quite bullish and the continuation of the uptrend seems more likely than a correction.
Which path will you choose? Share your thoughts in the comments!
That’s where our market research comes in. Think of it as your “bias detector.” We’ve developed and use it daily to get a second opinion on trades. It’s like having a pro trader whisper, “Hey, this isn’t looking good— think twice.”.
P.S. No pressure, just a chance to trade smarter! No Valuable Data, No Edge!

EURUSD(20250425) Today's AnalysisMarket news:
Federal Reserve-①Hamack: If economic data is clear, the Fed may cut interest rates in June
②Waller: It will take until July to get a clearer understanding of how tariffs affect the economy. If tariffs lead to higher unemployment, interest rate cuts may be initiated. ③The Atlanta Fed GDPNow model predicts that the US GDP growth rate in the first quarter will be -2.5%. ④Kashkari: The frequent announcements from Washington have brought challenges to policymakers and everyone.
Technical analysis:
Today's buying and selling boundaries:
1.1366
Support and resistance levels:
1.1448
1.1417
1.1397
1.1335
1.1315
1.1284
Trading strategy:
If the price breaks through 1.1397, consider buying, the first target price is 1.1417
If the price breaks through 1.1366, consider selling, the first target price is 1.1335

EURUSD(20250424) Today's AnalysisMarket News:
The United States hit a 16-month low in April. The total number of new home sales in the United States in March was an annualized to a new high since September 2024.
Technical analysis:
Today's buying and selling boundaries:
1.1354
Support and resistance levels:
1.1485
1.1436
1.1404
1.1303
1.1272
1.1223
Trading strategy:
If the price breaks through 1.1354, consider buying, the first target price is 1.1404
If the price breaks through 1.1303, consider selling, the first target price is 1.1272

EURUSD Short Term Buy Idea Update!!!Hi Traders, on April 15th I shared this idea "EURUSD Short Term Buy Idea"
Expected retraces and further continuation higher until the strong support zone holds. You can read the full post using the link above.
Price moved as per the plan!!!
Retraces happened as expected and then the price moved higher further.
If you enjoy this idea, don’t forget to LIKE 👍, FOLLOW ✅, SHARE 🙌, and COMMENT ✍! Drop your thoughts and charts below to keep the discussion going. Your support helps keep this content free and reach more people! 🚀
--------------------------------------------------------------------------------------------------------------------
Disclosure: I am part of Trade Nation's Influencer program and receive a monthly fee for using their TradingView charts in my analysis.

EURUSD: BUY trend continuesEURUSD is taking a breather, but bulls are still in charge. The 2-hour chart shows price well above key moving averages, keeping the uptrend alive. Momentum has cooled slightly, yet indicators stay near highs—no real signs of weakness. Dips toward 1.1500 are likely to draw buyers back in.

Week of 4/20/25: EURUSD AnalysisEU had a crazy week of consolidation last week and it was best to stay out until structure was clearer and had a direction.
My direction this week is bullish since all structure is bullish and we are starting to see that demand is in control. If it isn't, expect the lower level 4H POI to be mitigated and then continue the bull run.
Major News:
PMI - Wednesday
Unemployment - Thursday
Thanks for coming, hope you guys have a great week!

EUR/USD "The Fiber" Forex Bank Heist Plan (Swing/Day)🌟Hi! Hola! Ola! Bonjour! Hallo! Marhaba!🌟
Dear Money Makers & Robbers, 🤑 💰💸✈️
Based on 🔥Thief Trading style technical and fundamental analysis🔥, here is our master plan to heist the EUR/USD "The Fiber" Forex Market. Please adhere to the strategy I've outlined in the chart, which emphasizes long entry. Our aim is the high-risk Red Zone. Risky level, overbought market, consolidation, trend reversal, trap at the level where traders and bearish robbers are stronger. 🏆💸"Take profit and treat yourself, traders. You deserve it!💪🏆🎉
Entry 📈 : "The vault is wide open! Swipe the Bullish loot at any price - the heist is on!
however I advise to Place buy limit orders within a 15 or 30 minute timeframe most recent or swing, low or high level. I Highly recommended you to put alert in your chart.
Stop Loss 🛑:
Thief SL placed at the Nearest / Swing low level Using the 4H timeframe (1.08500) Day/Swing trade basis.
SL is based on your risk of the trade, lot size and how many multiple orders you have to take.
🏴☠️Target 🎯: 1.13000 (or) Escape Before the Target
🧲Scalpers, take note 👀 : only scalp on the Long side. If you have a lot of money, you can go straight away; if not, you can join swing traders and carry out the robbery plan. Use trailing SL to safeguard your money 💰.
EUR/USD "The Fiber" Forex Market Heist Plan (Swing / Day Trade) is currently experiencing a bullishness,., driven by several key factors.👇👇👇
📰🗞️Get & Read the Fundamental, Macro, COT Report, Quantitative Analysis, Sentimental Outlook, Intermarket Analysis, Future trend targets..., go ahead to check 👉👉👉🔗
Detailed Explanation 📝✨
Point 1: Fundamentals = tug-of-war ⚔️; U.S. strength 💪 offset by tariffs 🌧️, Eurozone weakness 🇪🇺 mitigated by ECB stability 🌟.
Point 2: Macro shows U.S. resilience cracking 😟, euro holding ground ⚖️.
Point 3: Global markets mixed 🌐, no clear winner, EUR/USD in range 🔄.
Point 4: COT cautious 📑, speculators less bullish 😐, hedgers bearish 📉.
Point 5: Intermarket neutral ⚖️; dollar-yield link key 📈, equity dips cap extremes 📉.
Point 6: 1.0950 pivot 🎯, breakout or breakdown ahead 🚀📉.
Point 7: Sentiment balanced 😊, retail buys 📈 vs. institutional caution 😐.
Point 8: Trends hinge on 1.0950 🔮; bullish needs breakout 📈, bearish risks below support 📉.
Point 9: Neutral outlook ⚖️, breakout potential either way 🌟📉.
Accurate as of April 7, 2025 ⏰, based on trends & projections. Watch U.S. CPI & Eurozone news 👀!
⚠️Trading Alert : News Releases and Position Management 📰 🗞️ 🚫🚏
As a reminder, news releases can have a significant impact on market prices and volatility. To minimize potential losses and protect your running positions,
we recommend the following:
Avoid taking new trades during news releases
Use trailing stop-loss orders to protect your running positions and lock in profits
💖Supporting our robbery plan 💥Hit the Boost Button💥 will enable us to effortlessly make and steal money 💰💵. Boost the strength of our robbery team. Every day in this market make money with ease by using the Thief Trading Style.🏆💪🤝❤️🎉🚀
I'll see you soon with another heist plan, so stay tuned 🤑🐱👤🤗🤩

Long-term bullish breakout on EUR/USD!Hey traders,
Let’s dive into some weekly price action on EUR/USD and uncover what the charts are really telling us. 📈
🔍 Key observations (weekly Chart):
Major breakout:
Two weeks ago, EUR/USD printed a strong bullish candle that broke and closed above a critical resistance zone, the July 2023 high and September 2024 high.
➡️ This marks a bullish structural shift on the higher timeframe.
Bullish inside bar:
Last week's candle was also bullish but formed an inside bar, closing within the previous candle’s range and failing to break the high.
➡️ This suggests consolidation, not rejection.
🧠 What it means:
✅ The break above multi-month highs signals strength and long-term bullish momentum.
✅ The inside bar can be viewed as a pause or healthy retest rather than weakness.
✅ Likely, price is accumulating orders before a new push higher.
📅 Weekly bias: bullish continuation
Here’s why:
The break and close above key structure is a big deal.
Consolidation after such a breakout is normal and often precedes continuation.
As long as price stays above the broken highs, the bias is firmly bullish.
🔔 What to watch next:
✅ A break and close above last week's high = strong bullish continuation signal.
🔁 A dip into the broken resistance (now support) + bullish rejection = a solid buy opportunity.
⚖️ There’s a price imbalance just below last week’s low, price could dip into it before taking off again.
💬 Final thoughts:
The long-term trend is shifting. This is not the time to fade strength, but rather to look for high-probability entries on pullbacks.
📢 If this breakdown helped you, don’t forget to boost the idea and follow for more weekly updates!

EURUSD(20250418) Today's AnalysisMarket news:
The European Central Bank cut interest rates by 25 basis points as expected, the seventh rate cut in the past year, and this decision was unanimous.
Technical analysis:
Today's buying and selling boundaries:
1.1367
Support and resistance levels:
1.1440
1.1413
1.1395
1.1339
1.1321
1.1294
Trading strategy:
If it rises and breaks through 1.1395, consider buying, the first target price is 1.1413
If it falls and breaks through 1.1367, consider selling, the first target price is 1.1339

EURUSD:SIGNALHello friends
Due to the recent price growth, the price has now corrected in a support range.
Now, if the price continues to fall within the specified support ranges, we can make purchases with capital management and move to the specified targets.
*Trade safely with us*
