Ready to Swipe the Pips? | EUR/USD Heist Blueprint Unlocked🏴☠️💸 EUR/USD "Fiber Heist Plan" – Thief Trader Style 💸🏴☠️
The Vault is Open – Swipe the Bullish Bags! 🚀📈💰
🌟Hi! Hola! Ola! Bonjour! Hallo! Marhaba!🌟
Welcome, Money Makers & Market Robbers! 🤑✨
Here’s the latest masterstroke based on our Thief Trading Style™—a tactical breakdown of EUR/USD primed for a bullish breakout robbery. We’re targeting the red zone 🎯—where the weak hands panic, and the real players win.
🔓 Entry Plan (Buy Setup):
🟢 "The vault is wide open!" — We’re planning bullish entries using 15m–30m timeframe swing levels.
✅ Buy Limit Orders: Plot them smartly around most recent swing lows/highs.
⚠️ Chart Alert Suggested: Eyes on the prize, don’t miss the break-in.
🛑 Risk Guard (SL Setup):
💼 Stop-Loss: Set at nearest 30-min swing low (based on your risk appetite).
Remember, it’s about preserving your loot, not just grabbing it.
🎯 Target Area:
🎯 Primary Target: 1.19000
🎯 Optional Trailing SL: Ride the wave, lock the profits as price moves.
🧲 Scalpers' Notice:
Only scalp long. Got big pockets? Jump in. Smaller bags? Swing along.
💡 Trailing stop advised—don’t let the market steal your gains.
💹 Current Market Outlook:
EUR/USD is moving bullish—supported by technical signals, macro news, COT insights, and intermarket vibes.
🧠 Use all tools: Fundamental 📊 + Sentiment 🧭 + Quant + Bias Score 📈.
📎 Want the full breakdown? Check the 👉.Liinkk.🔗
(Keep updated, conditions shift fast!)
⚠️ News Risk Alert:
🚨 Stay alert during news drops—avoid fresh trades then.
Use trailing SLs to lock profits & guard against reversal raids.
💖 Support the Robbery Plan!
💥 Hit that Boost Button 💥 if you're riding with the Thief Team!
We steal smart, we trade sharp — every day’s a new heist in this market.
See you on the next plan! Stay legendary 🐱👤💸🤑🔥
Eurusdlong

EURUSD LONG TERM UPEURUSD Live Trading Session/ EURUSD analysis #forex #forextraining #forexHello Traders
In This Video EURUSD HOURLY Forecast By World of Forex
today EURUSD Analysis
This Video includes_ (EURUSD market update)
EURUSD Analysis today | Technical and Order Flow
#usdjpy #usdchftechnicalanalysis #usdjpytoday #gold
What is The Next Opportunity on EURUSD Market
how to Enter to the Valid Entry With Assurance Profit?
This Video is For Trader's that Want to Improve Their Technical Analysis Skills and Their Trading By Understanding How To Analyze The Market Using Multiple Timeframes and Understanding The Bigger Picture on the Charts.
Disclaimer: Financial Trading Has Large Potential Rewards, But Also Large Potential Risk. You must be aware of the Risk and Be Welling to Accept Them in order to Trade the Financial Market . Please be Carefully With Your Money.
We are talking about future market, anything can Happen,Markets are Always like that.dnt Risky more Than 2% of your account
Now you can join with our "vip premium" service
Join us and let's make trading together

EUR/USD Holding the Line: Bullish Channel Setup!Hi traders! Analyzing EUR/USD on the 30-min timeframe, price is currently reacting near the bottom of a well-defined ascending channel, signaling a potential bullish continuation within the trend:
🔹 Entry: 1.17071
🔹 Take Profit: 1.17423
🔹 Stop Loss: 1.16825
After a corrective move downwards, price tapped into a key trendline support, aligning with prior structure and psychological level near 1.1700. The RSI is showing a bullish divergence near oversold levels, adding confluence to a possible reversal.
As long as price holds above the lower boundary of the channel, bulls may look to target the mid-to-upper region of the range, aligning with previous highs and dynamic resistance.
🟢 The trend remains intact as long as higher lows are respected.
⚠️ DISCLAIMER: This is not financial advice. Every trader is responsible for managing their own risk and strategy.

EURUSD is in a Downside DirectionHello Traders
In This Chart EURUSD HOURLY Forex Forecast By FOREX PLANET
today EURUSD analysis 👆
🟢This Chart includes_ (EURUSD market update)
🟢What is The Next Opportunity on EURUSD Market
🟢how to Enter to the Valid Entry With Assurance Profit
This CHART is For Trader's that Want to Improve Their Technical Analysis Skills and Their Trading By Understanding How To Analyze The Market Using Multiple Timeframes and Understanding The Bigger Picture on the Charts

EURUSD Bearish SMC Setup | Premium Supply Rejection + CHoCH +FVGPair: EUR/USD
Timeframe: 4H
Price reacted strongly from a Premium Selling Zone, forming multiple CHoCH (Change of Character) and BOS (Break of Structure) confirmations.
🔻 Red Zones indicate strong institutional selling
🔺 Weak High is now likely to remain protected
Market structure has shifted bearish, and price is targeting imbalances (IMB) and Fair Value Gaps (FVG) below.
⸻
✅ Entry: Taken from the premium supply rejection
🎯 Target 1: 1.16000 – Minor imbalance fill
🎯 Target 2: 1.15000 – Mid-level demand
🎯 Final Target: 1.14500 – Major liquidity zone
❌ Invalidation: Clean break above 1.18000
⸻
📉 Smart Money Confirmation Setup:
• Premium Supply
• CHoCH
• BOS
• FVG & IMB below
🔄 Missed the entry? Wait for a pullback into lower OB or supply zone.
#EURUSD #SmartMoney #SMC #CHoCH #BOS #FVG #OrderBlock #Forex #LiquiditySweep #SupplyDemand

EURUSD Will Keep Growing!
HI,Traders !
#EURUSD is trading in an
Uptrend and the pair broke
The key horizontal level
Of 1.16370 and the breakout
Is confirmed so after a potential
Retest of the support cluster
Of the rising and horizontal
Support lines below we will
Be expecting a bullish continuation !
Comment and subscribe to help us grow !

EURUSD Looking for a retest of potential SupportWe have seen more USD weakness since the ceasefire in the MIddle East as the threat of Global inflation caused by higher Oil prices lowers, raising hopes of future rate cutes by the FED
EURUSD has broken out cleanly from a previous resistance zone, and can act as support on any retests of the 1.1616-1.1636 zone
Stops would need to be below 1.1611
Targets to be around 1.1670-1.1685

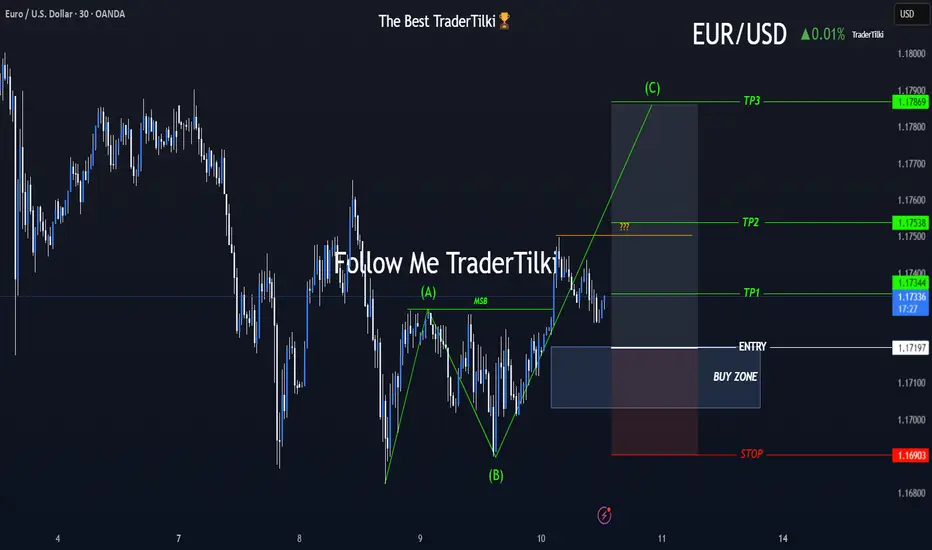
A New Chapter Begins with EURUSD’s ABC Wave Formation!🎯 Hey Guys,
I’ve prepared a fresh EURUSD analysis for you.
The market has shifted direction, and an ABC wave structure has emerged.
I’ve placed a Buy Limit order based on my entry level.
Below, you’ll find my detailed target zones and entry specifics:
🟩 Buy Limit Order: 1.17197
🟥 Stop Loss: 1.16903
📌 Targets:
🔹 TP1: 1.17344
🔹 TP2: 1.17538
🔹 TP3: 1.17869
📊 Risk/Reward Ratio: 2.27
Your likes and support are what keep me motivated to share these analyses consistently.
Huge thanks to everyone who shows love and appreciation! 🙏
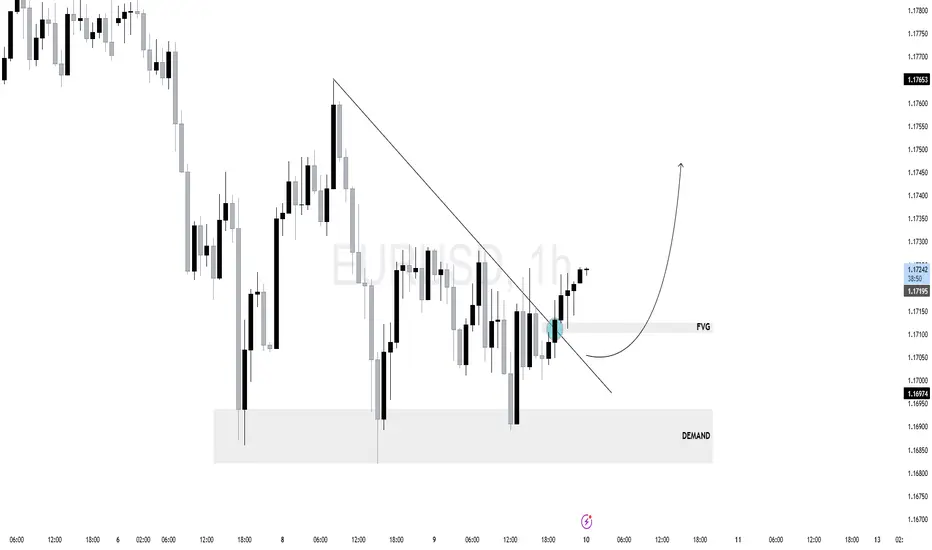
$EU (EURUSD) 1HPrice has been in a short-term downtrend with lower highs and lower lows. Recently, price tapped into a clear demand zone (marked gray at the bottom), showing strong bullish rejection and mitigation.
A clean break of the descending trendline confirms a potential shift in market structure.
Price has now retraced into a Fair Value Gap (FVG) after the breakout — a bullish continuation setup.
As long as price holds above the FVG and demand zone, expect a continuation toward external liquidity above - Demand Zone (1.16700–1.16950)
If price breaks back below the FVG and especially under the demand zone, the bullish scenario weakens
EurUsd - This is the deadly breakout!EurUsd - FX:EURUSD - is about to fly:
(click chart above to see the in depth analysis👆🏻)
EurUsd has been rallying about +15% over the past couple of months. Additionally the breakout at the current resistance trendline is about to be confirmed. Subsequently EurUsd is setting up for another major move higher, which will be painful for all European traders.
Levels to watch: $1.23, $1.11
Keep your long term vision🙏🙏
Philip (BasicTrading)

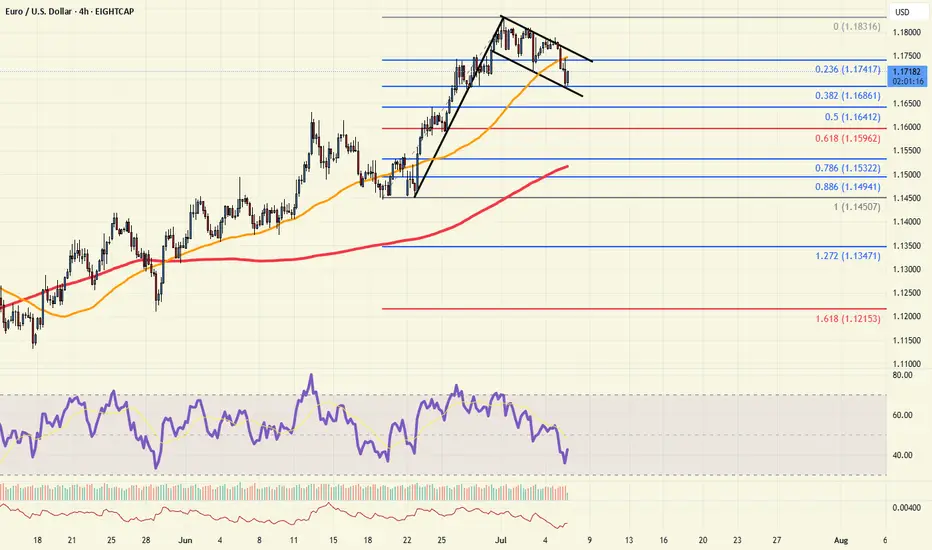
EUR/USD Bullish Setup from Key Support📈 EUR/USD Bullish Setup – Targeting 1.18500
Timeframe: 4H
Pair: EUR/USD
💡 Analysis:
The market is currently showing strong bullish momentum with clear support zones holding price action. After a healthy retracement, price is reacting well around the recent support level near 1.16800. If this level holds, we can anticipate a bullish continuation toward the target resistance zone at 1.18500.
🔶 Support Levels:
1. 1st Support Area: ~1.16800 – Recent consolidation and strong reaction zone
2. 2nd Support Area: ~1.15800 – Previous breakout level
3. 3rd Support Area: ~1.14300 – Major structure support
🎯 Target Point:
• 1.18500 – Major resistance and previous swing high
📊 Trade Idea:
We are looking for a bullish move from the current price level (~1.1700) toward the resistance at 1.1850. If price respects the nearest support zone, long entries with proper risk management could be favorable.

EURUSD and GBPUSD Analysis todayHello traders, this is a complete multiple timeframe analysis of this pair. We see could find significant trading opportunities as per analysis upon price action confirmation we may take this trade. Smash the like button if you find value in this analysis and drop a comment if you have any questions or let me know which pair to cover in my next analysis.

EUR/USD Holds Above Key Support — Outlook IntactHi Everyone,
Price briefly dipped below the 1.16680 support, but our broader outlook remains unchanged as long as it continues to hold above the key 1.16450 level. Should buyers successfully defend the 1.16450 zone, we still see potential for the pair to stabilise and make another attempt higher in the coming sessions.
We’ll be monitoring price action closely to see if support continues to hold and whether momentum starts to build back to the upside.
We maintain the view that a decisive break above last week’s high could attract additional buyers, paving the way for a move towards the 1.19290 level and ultimately the 1.20000 level.
We’ll share further updates on the projected path for EUR/USD if price breaks above this key resistance.
The longer-term outlook remains bullish, with expectations for the rally to extend towards the 1.2000 level, provided the price holds above the key support at 1.10649.
We will continue to update you throughout the week with how we’re managing our active ideas and positions. Thanks again for all the likes/boosts, comments and follows — we appreciate the support!
All the best for a good end to the week. Trade safe.
BluetonaFX

EUR/USD Could Take Off From Here! Strategic SetupHi traders! , Analyzing EUR/USD on the 30 minute timeframe, price is currently reacting from a strong support zone near 1.1696, showing potential for a bullish rebound after a sharp drop.
🔹 Entry: 1.1696
🔹 Take Profit (TP): 1.1770
🔹 Stop Loss (SL): 1.1621
After a strong downside move, EUR/USD is attempting a recovery from a key intraday support area. The RSI is bouncing from oversold conditions (around 34), indicating a possible short-term shift in momentum.
Price is also approaching the 200 EMA from below, and a break above could confirm bullish continuation toward the 1.1770 resistance zone. The setup offers a solid risk-reward ratio and aligns with mean reversion expectations.
⚠️ DISCLAIMER: This is not financial advice. Every trader is responsible for their own decisions and risk management.

EUR/USD Update: Breakout Potential Above Recent HighsHi Everyone,
Monday played out as expected; a bounce off the highlighted support area appears to have provided enough momentum for a retest of the 1.18000 level. Price could briefly dip below the 1.16680 support; however, our outlook will remain unchanged as long as we hold above the 1.16450 level.
We maintain the view that a decisive break above last week’s high could attract additional buyers, paving the way for a move towards the 1.19290 level and ultimately the 1.20000 level.
We’ll share further updates on the projected path for EUR/USD if price breaks above this key resistance.
The longer-term outlook remains bullish, with expectations for the rally to extend towards the 1.2000 level, provided the price holds above the key support at 1.10649.
We will continue to update you throughout the week with how we’re managing our active ideas and positions. Thanks again for all the likes/boosts, comments and follows — we appreciate the support!
All the best for a good end to the week. Trade safe.
BluetonaFX

Bull Flag PatternThe EURUSD is developing a bull flag pattern, and reinforced the pattern on the dip to the 1.1686 level, or 38% retracement. For bulls, this level will be critical to hold in the session ahead. A break back above the flag resistance at 1.1750 would reengage the dip buyers.
For the traders looking for a bigger US Dollar bounce, a move back below the 1.1686 level may open the door for a move back below the 1.1600 level.
EURUSD I Technical & Fundamental Forecast Welcome back! Let me know your thoughts in the comments!
** EURUSD Analysis - Listen to video!
We recommend that you keep this pair on your watchlist and enter when the entry criteria of your strategy is met.
Please support this idea with a LIKE and COMMENT if you find it useful and Click "Follow" on our profile if you'd like these trade ideas delivered straight to your email in the future.
Thanks for your continued support!Welcome back! Let me know your thoughts in the comments!

#EURUSD: Nothing to expect from DXY| View Changed Swing Trading|Hey there! So, we were previously thinking EURUSD was going to be bearish, but things have turned around and it’s looking bullish for now.
The extreme bearish pressure on USD has caused all the major USD pairs to be in a range. As the week goes on and we get the NFP data, the market will probably focus more on these economic indicators. So, it’s not surprising to see some market ranges during this time.
We’ll keep a close eye on the market, as there might be some manipulation going on this week.
We recommend waiting until Monday’s daily candle closes to see if the bullish trend is strong enough. Then, based on the price momentum, you can make your decisions.
We hope you have a great week and safe trading! If you like our work and analysis, please consider liking, commenting, and sharing our content.
Cheers,
Team Setupsfx
❤️🚀

Where the coffee is strong (EUR/USD)Setup
EUR/USD is in a strong uptrend and recently broke above multi-year resistance just under 1.16. The pair looks to be targeting long term resistance at 1.23.
Signal
RSI is dropping back from overbought territory on the daily chart, offering a possible dip-buying opportunity above resistance-turned-support at 1.16.

Long EURUSDThe uptrend on EURUSD remains intact, and buying opportunities are still the only viable option.
No major news is expected from the economic calendar this week.
Watch for the end of the current pullback and signs of a new bullish move.
The target is a breakout above the previous high, aiming for 1,1915.

EUR/USD: UPDATEHello friends
Everything is clear on the chart for you, our probability is price growth until the specified areas.
In case of price decline, we have identified two support areas where you can buy.
Be sure to observe risk and capital management.
*Trade safely with us*

EUR/USD Rally Pauses Near 1.18000 – Higher Targets in SightHi Everyone,
Last week, price action delivered the 1.18000 level we had been calling for, and as expected, dynamic resistance around that area proved to be significant.
Looking ahead, we anticipate EUR/USD will continue to test the 1.18000 level this week while holding above the 1.16680 support zone. A strong break above last week’s high could attract further buyers, paving the way for a move towards the 1.19290 and ultimately the 1.20000 levels. We’ll share further updates on the projected path for EUR/USD if price breaks above this level.
The longer-term outlook remains bullish, with expectations for the rally to extend towards the 1.2000 level, provided the price holds above the key support at 1.10649.
We will continue to update you throughout the week with how we’re managing our active ideas and positions. Thanks again for all the likes/boosts, comments and follows — we appreciate the support!
All the best for a good end to the week. Trade safe.
BluetonaFX

EURUSD Bullish Setup: Watching for a Break and Retest📈 Looking at EURUSD right now, we’re in a strong bullish structure 🔼 — but it’s clearly overextended 🚀
As we head into the end of the week, there’s still potential for more upside today ⬆️ — but ⚠️ be cautious, since Fridays often bring retracements as we move into the weekly close 🕒📉
🔍 I’m watching for a bullish opportunity if we get a break above the current equal highs, followed by a retest and failure to break back below 🧠📊
If that setup doesn’t materialize, we’ll simply step aside and abandon the idea 🚫
💬 Not financial advice — always trade at your own risk.
