Chartanalyse: Der Chart zeigt eine Seitwärtskonsolidierung mitTechnical Overview:
The EUR/USD chart exhibits signs of a bearish reversal pattern forming near a key resistance zone (1.15800 - 1.16000), highlighted with repeated rejection wicks (🔴 red arrows). Price is currently trading at 1.15222, after failing to hold above the neckline of the rounded bottom pattern.
🔍 Key Observations:
🔺 Resistance Zone: Strong resistance has been confirmed multiple times (red arrows), indicating sellers are active at the top.
🟠 Double Top / Head & Shoulders Behavior: Price action shows topping formations (highlighted with orange circles), suggesting exhaustion of bullish momentum.
📉 Bearish Breakdown Possibility:
Price rejected near neckline and is showing bearish candle formations.
Breakdown from the current consolidation zone could push price toward the target zone at 1.14491, marked in purple.
This aligns with previous support structure, reinforcing a technical downside projection.
🔻 Support Zone: Around 1.13800 - 1.14000 is a strong area of demand and may act as the next bounce point if the bearish move continues.
📐 Chart Pattern Structure:
Rounded bottom formed earlier, but the failure to continue higher and breakout suggests a false breakout trap for buyers.
Downward sloping trendline broke, but now price is struggling to sustain above previous highs.
📌 Conclusion:
⚠️ Caution for bulls as price shows signs of weakness at resistance. A move below 1.15000 may initiate further downside toward 1.14491 and possibly lower. Short-term traders can watch for confirmation candles near this zone for entries.
📅 Short-Term Bias: Bearish
🎯 Target: 1.14491
⛔️ Invalidation: Strong breakout above 1.16000
Eurusdlong

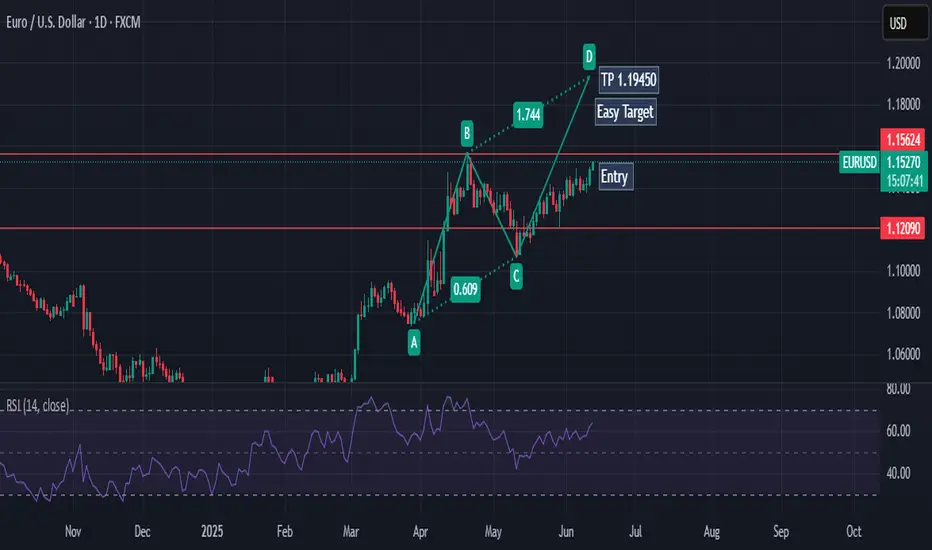
EURUSD Breaks Structure: Bullish Continuation Opportunity💶 EUR/USD Analysis – Bullish Momentum Builds 📈
Taking a look at the EUR/USD on the daily chart, it’s clear the pair is currently in a strong bullish trend 🚀. Momentum has been building consistently, reflecting underlying euro strength and continued USD weakness.
🕓 On the 4H timeframe, we’ve now seen a clear shift in market structure to the upside, confirming bullish intent. Look for a continuation entry after a retracement back into equilibrium — ideally around the 50% level of the current price swing 🔄📐.
🎯 Trade Plan Idea:
Wait for price to pull back into equilibrium 🌀
Entry: Long from the discounted zone 🟩
Stop loss: Just below the recent swing low 🔻
Target: Previous high as a logical take-profit zone 🎯📊
⚠️ Disclaimer:
This content is for educational and informational purposes only and should not be considered financial advice. Always do your own research and consult with a qualified financial advisor before making any trading decisions. 📚💼

EURUSD SHORT & LONG FORECAST Q2 W25 D19 Y25EURUSD SHORT & LONG FORECAST Q2 W25 D19 Y25
Professional Risk Managers👋
Welcome back to another FRGNT chart update📈
Diving into some Forex setups using predominantly higher time frame order blocks alongside confirmation breaks of structure.
Let’s see what price action is telling us today!
💡Here are some trade confluences📝
✅Weekly order block rejection
✅15' order block
✅4 hour order block identified
✅Daily Order block identified
🔑 Remember, to participate in trading comes always with a degree of risk, therefore as professional risk managers it remains vital that we stick to our risk management plan as well as our trading strategies.
📈The rest, we leave to the balance of probabilities.
💡Fail to plan. Plan to fail.
🏆It has always been that simple.
❤️Good luck with your trading journey, I shall see you at the very top.
🎯Trade consistent, FRGNT X

Core Impact Logic of the Middle East Situation on EURUSD(I) Energy Transmission Chain: Oil Price Fluctuations → Eurozone Inflation and Economy
The escalation of the Middle East situation (the Iran - Israel conflict, risks in the Strait of Hormuz) directly impacts the global energy supply chain:
If the conflict expands to block the Strait of Hormuz (transports ~20% of global crude oil 🛢️), Brent crude has already soared from recent lows—spiking over 5% on June 17 amid tensions ⛽️. This pushes up imported inflation in the Eurozone.
As a net energy - importing region 🌍, prolonged high oil prices will squeeze corporate profits, suppress consumption, and drag Eurozone economic recovery (German/French manufacturing is acutely energy - cost - sensitive 🏭). This weakens the euro’s fundamental support.
(II) Geopolitical Safe - Haven Sentiment: The "Safe - Haven Balance" Between USD & EUR
Amid Middle East tensions, the US dollar’s traditional safe - haven status competes with Eurozone havens like German bonds 📈:
If the US (e.g., the Trump administration) intervenes militarily 💥, market fears of "America mired in war" rise. USD safe - haven demand may temporarily weaken ⬇️, and the euro benefits as funds shift 🔄
⚡️⚡️⚡️ EURUSD ⚡️⚡️⚡️
🚀 Buy@ 1.14500 - 1.15000
🚀 TP 1.15500 - 1.15600
Accurate signals are updated every day 📈 If you encounter any problems during trading, these signals can serve as your reliable guide 🧭 Feel free to refer to them! I sincerely hope they'll be of great help to you 🌟 👇

DXY 2H Analysis – June 18, 2025Pair : dxy ,,💲
Is the bullish move fading out? 📉
Price reacting near upper trendline resistance 🔵
Potential correction or final push before deeper drop ❗
Wave count suggests i–ii–iii–iv completed; wave v setup expected 🔁
Watch the reaction in the highlighted zone 📦
Either short continuation or a bullish trap loading 🧠
📌 Strategy: Elliott Wave + Trendline Confluence
📅 Stay sharp. Events approaching 📰
📈 Trade with a plan, not hope.
🔔 Follow @Greenfireforex for more real-time setups and ideas.

a comparison or integration of two trading concepts: 📉📈
The image presentsElliott Wave Theory and Smart Money Concepts (SMC), often associated with Wyckoff distribution/accumulation.
🌟 On the left side, there's an illustration of Elliott Wave Theory, showing a typical 5-wave impulse (labeled 1-2-3-4-5, presumably wave A) followed by a 3-wave corrective structure (labeled A-B-C). Within this, there's a smaller "Accumulation" phase depicted.
✅ On the right side, there's a diagram illustrating Smart Money Concepts/Wyckoff phases, specifically "Accumulation," "Manipulation," and "Distribution." This diagram shows how price moves through these phases, often with a false breakout (manipulation) before the true move.
🟢The overall implication of the image and its central text is that SMC principles, such as accumulation and distribution, can be observed or understood within the larger framework of Elliott Wave patterns. It suggests that SMC provides a more granular view of market behavior (identifying smart money footprints) that aligns with or unfolds within the Elliott Wave structures.

Opportunity for selling EURUSDI see that EURUSD has confirmed strong resistance, so I took a sell trade with it.

buying EURUSD (update) 1:10 RREURUSD touched strong support, so I think it will rise further, as shown.
EURUSD(20250616) Today's AnalysisMarket news:
Trump: The United States may still intervene in the Iran-Israel conflict. If Iran launches an attack on the United States, the United States will "fight back with all its strength on an unprecedented scale." Iran and Israel should reach an agreement.
Technical analysis:
Today's buying and selling boundaries:
1.1550
Support and resistance levels:
1.1674
1.1628
1.1598
1.1502
1.1472
1.1426
Trading strategy:
If the price breaks through 1.1550, consider buying, and the first target price is 1.1598
If the price breaks through 1.1502, consider selling, and the first target price is 1.1472

EUR/USD - Upside Bias Continues Amid Market EventsHi Everyone,
As outlined in our analysis last week, we continue to expect EUR/USD to advance further to the upside. A successful retest of the 1.15240 level provides support for the move.
This promises to be an eventful week as markets navigate geopolitical tensions and upcoming central bank decisions. As long as price holds above 1.14483, we anticipate a continuation higher toward the 1.16564 level, which would further reinforce our long-term bullish outlook.
A confirmed break above this resistance would likely open the door for a move toward 1.18325, where we anticipate encountering dynamic resistance.
We will provide further updates on the projected path for EUR/USD should price reach this level.
The longer-term outlook remains bullish, with expectations for the rally to extend toward the 1.2000 level, provided the price holds above the key support at 1.10649.
We will continue to update you throughout the week with how we’re managing our active ideas and positions. Thanks again for all the likes/boosts, comments and follows — we appreciate the support!
All the best for a good end to the week. Trade safe.
BluetonaFX

EURUSD, GBPUSD and AUDUSD Analysis todayHello traders, this is a complete multiple timeframe analysis of this pair. We see could find significant trading opportunities as per analysis upon price action confirmation we may take this trade. Smash the like button if you find value in this analysis and drop a comment if you have any questions or let me know which pair to cover in my next analysis.

Opportunity for buying EURUSDEURUSD touched strong support, so I think it will rise further, as shown.

EURUSD ||| '' W '' PATTERN IDENTIFIED . ✅ Harmonic Formation (Bearish Potential)
⚠️ Selling Bias forming soon
---
🧩 Pattern Breakdown:
A Bearish Harmonic Pattern (likely Butterfly or Deep Crab) has been identified and is now nearing completion at the D point.
Current price is approaching key resistance / reversal zone, precisely around the 0.786 - 0.886 fib area (highlighted red).
The Risk-to-Reward is clearly mapped:
🔺 Stop Loss: 1.19405
✅ Entry Zone: Around 1.17106
🎯 Target: 1.09588
Potential short setup if price respects the harmonic symmetry and fails to break above resistance.

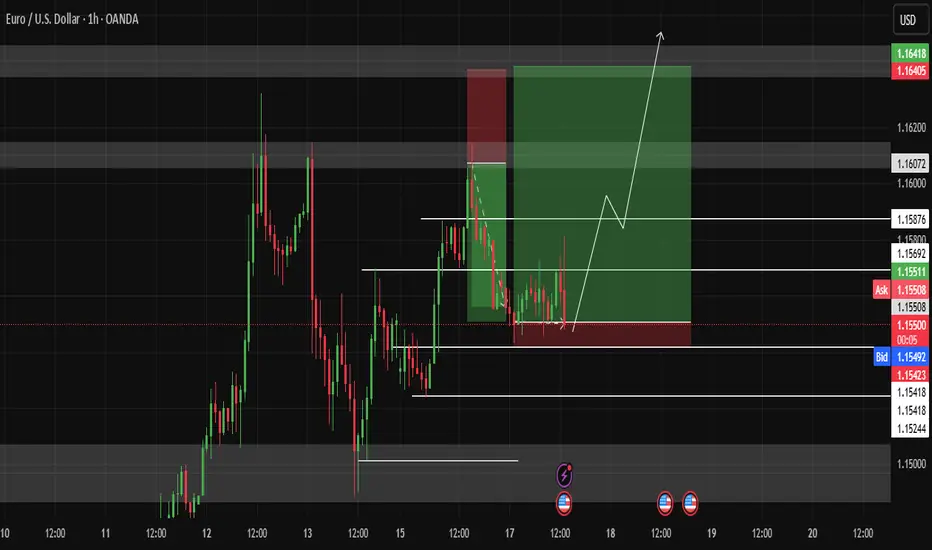
EURUSD is continuing its uptrendEURUSD is still in a strong uptrend. There was a drop in the Asian and European sessions on Friday but that was not enough to reverse the pair. The end of the US session saw the price being pushed up by the bulls from the 1.155 price zone and is stuck in this resistance zone.
The price continues to increase when breaking 1.155 will head towards the resistance of 1.161, the highest peak of last week. If there is a retest of 1.155, the price will head towards 1.166 next week to be able to use short-term SELL strategies
The BUY strategy is still prioritized as the EU is still in an uptrend. The main BUY zone of the pair is still waiting for 1.150 and lower is the breakout zone of 1.145
Resistance: 1.161, 1.166
Support: 1.150, 1.145

Nasdaq Oro EurUsd UsdJpyPost analysis of the entries this Friday, market compress the week and today gave us the respite to have a good weekend

EURUSD Setup | CPI Fades, Fed Focus & Gold Leads Dollar ReboundEURUSD is showing signs of exhaustion after soft US CPI failed to extend the rally beyond 1.1495. While markets initially priced in a dovish Fed response, recent commentary and gold’s rejection from its highs suggest the dollar may be gearing up for a short-term recovery. With Gold pulling back and yields stabilizing, EURUSD could now follow suit lower into key support levels—especially if the Fed maintains a patient tone at this week’s meeting.
🔹 EURUSD (4H) Analysis
📉 Bias: Bearish
💡 Context:
EURUSD stalled just below 1.1500 after the CPI miss and now sits at a high-liquidity reversal zone. With DXY stabilizing and gold already rolling over, EURUSD may lag behind but eventually follow the same path. If the Fed leans hawkish or even neutral (ignoring political pressure), it could catalyze a drop toward 1.1268 and below.
📊 Technical Levels:
Resistance Zone: 1.1495–1.1530
Target 1: 1.1268
Target 2: 1.1086
Invalidation: Daily close above 1.1530 (or strong bullish follow-through after FOMC)
🪙 Leading Asset Clue:
Gold has already rejected major resistance (3,390–3,403) and is now pulling lower. Historically, EURUSD tends to follow when metals stall—especially if driven by real yields and Fed dynamics.
⚠️ Fundamentals to Watch:
🏦 FOMC Rate Decision & Dot Plot (June 12)
📈 US PPI + Jobless Claims (June 13)
💬 Fed Chair Powell's Press Conference
📰 Any shift in ECB or Fed rate cut timelines
🧠 Risk Factors:
Fed surprise dovish shift due to CPI softness
Market overreacts to rate cut expectations
Geopolitical risk-off flows favoring EUR
✅ Summary: Bias and Watchpoints
EURUSD
Bearish
Fed holding firm vs. ECB easing bias
Fed turning dovish post-CPI (Top Risk)
FOMC Rate Decision, PPI, Powell
📌 Final Note:
Gold is leading the turn as dollar strength resurfaces. EURUSD may lag initially but the macro context favors downside from this key resistance zone. Watch the Fed for confirmation—positioning into 1.1268 and 1.1086 looks attractive if the dollar gains traction post-FOMC.

EUR/USD Rally Extends – Eyes on 1.20000 as Momentum BuildsHi Everyone,
As outlined in our analysis last week (idea linked below), EUR/USD continued to the upside and reached the 1.15240 level.
We expect price action to extend further toward the 1.16564 level, which would reinforce our long-term bullish outlook.
A confirmed break above this resistance would likely open the door for a move toward 1.18325, where we anticipate encountering dynamic resistance.
We will provide further updates on the projected path for EUR/USD should price reach this level.
The longer-term outlook remains bullish, with expectations for the rally to extend toward the 1.2000 level, provided the price holds above the key support at 1.10649.
We will continue to update you throughout the week with how we’re managing our active ideas and positions. Thanks again for all the likes/boosts, comments and follows — we appreciate the support!
All the best for a good end to the week. Trade safe.
BluetonaFX


EURUSD(20250612) Today's AnalysisMarket news:
① The EU hopes that the trade negotiations will be extended beyond the suspension period set by Trump. ② Bessant: As long as "sincerity" is shown in the negotiations, the Trump administration is willing to extend the current 90-day tariff suspension period beyond July 9. ③ Trump will hold multiple bilateral talks during the G7 summit. ④ The total customs revenue of the United States in May reached a record high of US$23 billion, an increase of nearly four times year-on-year. ⑤ Lutnick: One deal after another will be reached.
Technical analysis:
Today's buying and selling boundaries:
1.1463
Support and resistance levels:
1.1556
1.1521
1.1499
1.1427
1.1404
1.1369
Trading strategy:
If the price breaks through 1.1499, consider buying in, and the first target price is 1.1521
If the price breaks through 1.1463, consider selling in, and the first target price is 1.1427

Today's EUR/USD Trend Analysis and Trading RecommendationsThe EUR/USD is trading at the upper end of its recent range, having hit an intraday high of around 1.1440 and remaining near that level. The US Dollar strengthened in the early session due to optimism about the easing of Sino-US trade tensions, but later declined as European stocks fluctuated. Technically, the daily chart shows bulls remain in control, with the 20-day SMA rising gently at 1.1330. In the short term, the pair is range-bound around the 20-day SMA, yet to confirm a bullish breakout, while the 100-day and 200-day SMAs support the overall upward trend.
EUR/USD
buy@1.14200-1.14300
tp:1.14600-1.14900

Eurusd D Updatei buy eurusd 3 time{yellow line]
now we hit first take profit so we put stop loss on entry price and we keep eurusd for next take profit

Correction on EURUSDAfter Friday’s news, EURUSD reached 1,1368.
Make a note of the news candle and wait for a breakout.
If the retracement continues, the next key support level is 1,1317.
Important USD-related news is expected this Wednesday.
Watch for potential trend continuation setups and avoid rushing into new trades.
